Spatial and temporal processing biases in visual working memory in specific anxiety
D ISSERTATION
for the degree of Doctor rerum naturalium (Dr. rer. nat.)
presented to the Department of Mathematics and Natural Sciences of Dresden University of Technology
by Dipl. Psych. Andrea Reinecke Doctoral defense: April 10th 2007 Reviewer: Prof. Dr. Thomas Goschke (Dresden, Germany) Prof. Dr. Eni S. Becker (Nijmegen, The Netherlands) Dr. habil. Mike Rinck (Nijmegen, The Netherlands) Prof. Dr. Peter J. de Jong (Groningen, The Netherlands)
Contact:
[email protected]
Acknowledgments
First and foremost, I would like to thank my advisors Prof. Dr. Eni S. Becker and Dr. habil. Mike Rinck for initially rather incidentally running into me, familiarizing me with a remarkably enthralling research field and smoothing the way for me to contribute to that research. It was a pleasure to work with you; I was enriched by your expertise and support, both professionally and personally. I am deeply indebted to my irreplaceable research assistants, Kristin Grundl and Kira Marschner, whose extraordinary dedication and responsibility significantly contributed to the quality of my work. Thank you for your round-the-clock commitment, impressive endurance, for all the laughs we shared and for feeding the snake. I owe thanks to Prof. Dr. Thomas Goschke, Prof. Dr. Jürgen Hoyer, Prof. Dr. Hans-Ulrich Wittchen, and Prof. Dr. Winfried Hacker for their logistic support, such as placing offices and laboratories at my disposal. Thank you, Mrs. Wobst, for all your patience and help. Thank you, colleagues of the Experimental Psychology research colloquium, for your helpful comments and suggestions on my work. Sincere thanks are due to Jeremy M. Wolfe for giving the impulse for this work, to Heidi Knüpfer and Robert Münster for making dreams come true through their support in programming the experiments; to Christian Soltau, for standing in as underpaid spider-anxiety therapist, potentiating one of the studies presented here; and to Daniel Fitzgerald for his endurance in proof-reading. Thanks go to Mathias Köhler for providing the most handsome tarantulas and snakes, for all his altruistic support, for all the knowledge he provided about spiders and for making me petting one when necessary. My special thanks go to Dr. Heike Raddatz for being so supportive in paving my way with a scholarship to the Dresden Technical University. Thanks to all the students who were involved in data collection: Carolin Hesse, Felix Kapp, Anita Klein, Constanze Meier, Angela Mittring, Silvana Müller, Miriam Rexroth, and Susanne Richter. Thank you so much, Dr. Ingo Melcher, for bringing me back on track. I owe my deepest thanks to my partner Robert Münster and my family, Ilona and Udo Reinecke, Stefanie, Sabine, and Paul, and Irmtraud Marzinkowski, who remind me of the more important parts of life – the life beyond work.
II
Statement
The presented work is a cumulative dissertation. In accordance with § 8 (1) of the doctorate regularity from March 20th 2000 of the Department of Mathematics and Natural Sciences of Dresden University of Technology, it has been prepared as a self-contained work. All chapters were composed specifically for this dissertation. In addition to the papers, the theoretical background of the work is thoroughly reflected in the Introduction. In the General Discussion, a conjoint appreciation of all studies and results, a critical consideration of the work, and a discussion of theoretical and clinical implications are provided.
Reinecke, A., Rinck, M., & Becker E.S. (2006). Spiders crawl easily through the bottleneck: Visual working memory for negative stimuli. Emotion, 6, 438-449. Reinecke, A., Becker, E.S., & Rinck, M. (submitted). Selective visual working memory in fear of spiders: The role of automaticity and disorder-specificity. Reinecke, A., Soltau, C., Hoyer, J., Rinck, M., & Becker, E.S. (submitted). Treatment sensitivity of attention, visual working memory, and implicit associations in spider anxiety. Reinecke, A., Becker, E.S., & Rinck, M. (submitted). Visual working memory for threat: Spider fearfuls show disorder-specific change detection. Reinecke, A., Rinck, M., & Becker E.S. (accepted for publication). How preferential is the preferential encoding of threatening stimuli? Working memory biases in specific anxiety and the Attentional Blink. Journal of Anxiety Disorders. Reinecke, A., Becker E.S., & Rinck, M. (submitted). Two short-screenings measuring fear of snakes: reliability and validity by contrast with the SNAQ.
III
Contents Contents I
IV
Introduction
1
Specific Anxiety and Specific Phobia . . . . . . . . . . . . . . . . . . . . . . . .
3
Attention and Memory . . . . . . . . . . . . . . . . . . . . . . . . . . . . . . .
7
Models of Working Memory . . . . . . . . . . . . . . . . . . . . . . . . .
9
Empirical Research on Visual Working Memory . . . . . . . . . . . . . . .
11
Attention, Memory and Anxiety . . . . . . . . . . . . . . . . . . . . . . . . . .
14
Status of Research . . . . . . . . . . . . . . . . . . . . . . . . . . . . . . .
15
Cognitive Theories of Anxiety . . . . . . . . . . . . . . . . . . . . . . . .
19
Limitations and Open Questions . . . . . . . . . . . . . . . . . . . . . . .
24
The Objectives of this work . . . . . . . . . . . . . . . . . . . . . . . . . . . . .
29
II Paper 1: Spiders crawl easily through the bottleneck: Visual working memory for negative stimuli
37
Introduction . . . . . . . . . . . . . . . . . . . . . . . . . . . . . . . . . .
37
Methods . . . . . . . . . . . . . . . . . . . . . . . . . . . . . . . . . . . .
41
Results . . . . . . . . . . . . . . . . . . . . . . . . . . . . . . . . . . . . .
45
Discussion . . . . . . . . . . . . . . . . . . . . . . . . . . . . . . . . . . .
54
III Paper 2: Selective Visual Working Memory in Fear of Spiders: the Role of Automaticity and Disorder-Specificity
60
Introduction . . . . . . . . . . . . . . . . . . . . . . . . . . . . . . . . . . . . .
60
Experiment 1: VWM for spiders in spider fearfuls . . . . . . . . . . . . . . . . .
64
Introduction . . . . . . . . . . . . . . . . . . . . . . . . . . . . . . . . . .
64
Methods . . . . . . . . . . . . . . . . . . . . . . . . . . . . . . . . . . . .
65
Results . . . . . . . . . . . . . . . . . . . . . . . . . . . . . . . . . . . . .
68
Discussion . . . . . . . . . . . . . . . . . . . . . . . . . . . . . . . . . . .
74
Experiment 2: VWM for snakes in spider fearfuls . . . . . . . . . . . . . . . . .
75
Introduction . . . . . . . . . . . . . . . . . . . . . . . . . . . . . . . . . .
75
Methods . . . . . . . . . . . . . . . . . . . . . . . . . . . . . . . . . . . .
76
Results . . . . . . . . . . . . . . . . . . . . . . . . . . . . . . . . . . . . .
76
IV
Contents
V Discussion . . . . . . . . . . . . . . . . . . . . . . . . . . . . . . . . . . .
81
General discussion . . . . . . . . . . . . . . . . . . . . . . . . . . . . . . . . .
81
IV Paper 3: Treatment Sensitivity of Strategic vs. Automatic Visual Working Memory Biases in Fear of Spiders
86
Introduction . . . . . . . . . . . . . . . . . . . . . . . . . . . . . . . . . .
86
Methods . . . . . . . . . . . . . . . . . . . . . . . . . . . . . . . . . . . .
89
Results . . . . . . . . . . . . . . . . . . . . . . . . . . . . . . . . . . . . .
92
Discussion . . . . . . . . . . . . . . . . . . . . . . . . . . . . . . . . . . .
96
V Paper 4: Visual Working Memory for Threat: Spider Fearfuls Show Disorder-Specific Change Detection
100
Introduction . . . . . . . . . . . . . . . . . . . . . . . . . . . . . . . . . . . . .
100
Experiment 1: Applying a Classical VWM Task to Fear of Spiders . . . . . . . .
104
Introduction . . . . . . . . . . . . . . . . . . . . . . . . . . . . . . . . . .
104
Methods . . . . . . . . . . . . . . . . . . . . . . . . . . . . . . . . . . . .
105
Results . . . . . . . . . . . . . . . . . . . . . . . . . . . . . . . . . . . . .
109
Discussion . . . . . . . . . . . . . . . . . . . . . . . . . . . . . . . . . . .
116
Experiment 2: VWM for Spiders and Snakes in Spider Fearfuls . . . . . . . . . .
117
Introduction . . . . . . . . . . . . . . . . . . . . . . . . . . . . . . . . . .
117
Methods . . . . . . . . . . . . . . . . . . . . . . . . . . . . . . . . . . . .
117
Results . . . . . . . . . . . . . . . . . . . . . . . . . . . . . . . . . . . . .
119
Discussion . . . . . . . . . . . . . . . . . . . . . . . . . . . . . . . . . . .
122
General Discussion . . . . . . . . . . . . . . . . . . . . . . . . . . . . . . . . .
122
VI Paper 5: How preferential is the preferential encoding of threatening stimuli? Working memory biases in specific anxiety and the Attentional Blink
127
Introduction . . . . . . . . . . . . . . . . . . . . . . . . . . . . . . . . . . . . .
127
Experiment 1: The Attentional Blink For Emotional Pictures in a Random Sample 131 Introduction . . . . . . . . . . . . . . . . . . . . . . . . . . . . . . . . . .
131
Methods . . . . . . . . . . . . . . . . . . . . . . . . . . . . . . . . . . . .
132
Results . . . . . . . . . . . . . . . . . . . . . . . . . . . . . . . . . . . . .
135
Discussion . . . . . . . . . . . . . . . . . . . . . . . . . . . . . . . . . . .
138
Experiment 2: The Attentional Blink for Spiders and Snakes in Spider Fearfuls vs. Non-Anxious Controls Without Snake Anxiety . . . . . . . . . . . . . . .
139
Introduction . . . . . . . . . . . . . . . . . . . . . . . . . . . . . . . . . .
139
Methods . . . . . . . . . . . . . . . . . . . . . . . . . . . . . . . . . . . .
139
Results . . . . . . . . . . . . . . . . . . . . . . . . . . . . . . . . . . . . .
142
Discussion . . . . . . . . . . . . . . . . . . . . . . . . . . . . . . . . . . .
145
Contents
VI
General Discussion . . . . . . . . . . . . . . . . . . . . . . . . . . . . . . . . .
146
VII Paper 6: Two Short Screenings Measuring Fear of Snakes: Reliability and Validity in Contrast With the SNAQ Einleitung . . . . . . . . . . . . . . . . . . . . . . . . . . . . . . . . . . . Methode . . . . . . . . . . . . . . . . . . . . . . . . . . . . . . . . . . . .
150 150 154
Ergebnisse . . . . . . . . . . . . . . . . . . . . . . . . . . . . . . . . . . . Diskussion . . . . . . . . . . . . . . . . . . . . . . . . . . . . . . . . . . .
158 161
VIII General Discussion Summary of the Results . . . . . . . . . . . . . . . . . . . . . . . . . . . . . . .
165 166
Theoretical Implications . . . . . . . . . . . . . . . . . . . . . . . . . . . . . . Clinical Implications . . . . . . . . . . . . . . . . . . . . . . . . . . . . . . . .
174 182
Discussion and Limitations of Empirical Findings . . . . . . . . . . . . . . . . . Final Conclusions . . . . . . . . . . . . . . . . . . . . . . . . . . . . . . . . . .
183 187
IX References
189
X Appendix
218
Summary
227
I. Introduction
Vignette 1: ”As far as I can remember, I have had an extreme fear of spiders. A slight smudge on the wall or a classmate rolling a wadded note towards me would scare me to death, as I would take it for a spider at first sight. Funny that I of all people have an eye for spiders, although I do not wish to see them. [...] In the waiting room of my dentist I immediately noticed the small spider coming through the window. I didn’t have the heart to ask someone to get rid of it, but I would notice every time it moved, even after leaving the room for a while. [...] On the first day at a new school, I found cob webs and several longleg spiders beneath my desk. I was ashamed to have my ”coming out” on the first day, but I was so terrified that all I could do was cry and ask for someone to remove these beasts. I was no longer able to follow the subject matter and was checking for more spiders instead.” (report of an 18-year old female spider phobic patient, translated from German by the author) Vignette 2: ”Expensive spider phobia. For fear of a spider, a woman [...] temporary lost control over her car. She snatched the steering wheel and crashed into an oncoming truck. Both vehicles sustained damage amounting to about 2.000 euros. According to police, the 43-year-old reported having panicked when an ”oversized” spider spun its way from the sunshade to her legs.” (Mitteldeutsche Zeitung, 09/06/06; translated from German by the author) The two case vignettes outlined above are impressive demonstrations of how drastic the response to a confrontation with a feared stimulus in an anxiety disorder can be. The young patient in the first example accepts the risk of humiliation in front of her new classmates by crying when faced with harmless spiders and the woman described in the newspaper article risks a hazardous traffic accident by the same token. Implied in these strong reactions is an impressive phenomenon: anxiety disorders seem to be associated with hypervigilance to the feared object, with a tendency to interpret ambiguous stimuli such as a smudge on the wall as threatening, with extensive distraction in the presence of feared stimuli. In sum, anxious individuals are very quick in detecting the presence of their personal threat, such as a spider phobic immediately noticing a tiny spider entering through the window, a panic patient perceiving each extrasystole, or an obsessive washer instantly detecting a small wound on the hand of his companion. Interestingly, a piece of wadded paper rolling along a desk might
1
I. INTRODUCTION
2
be mistaken as a spider; ink from a red felt-tip pen might be regarded as blood. In both cases, during either real or supposed presence of threat, an anxious person’s attention can be absorbed by the threat stimulus, leading to difficulty in following their teacher’s instructions or on keeping a watchful eye on the road. What are the processes underlying these phenomena? Numerous theoretical approaches aim at providing a framework explaining the etiology, maintenance and phenomenology of anxiety disorders. One group of theories is classified as cognitive models of anxiety. These approaches assume distortions in specific levels of information-processing are relevant for the onset and maintenance of the disorder. A detailed knowledge about the nature of these distortions would have important implications for the therapy of anxiety, as the implementation of confrontative or cognitive elements precisely fitting the distortions might enhance efficacy. Still, these models and related empirical evidence provide conflicting assumptions about the nature of disorder-linked processing distortions. Many cognitive models of anxiety (e.g., Fox, Russo, & Dutton, 2002; Mathews & Mackintosh, 1998; Williams, Watts, MacLeod, & Mathews, 1997) postulate that anxiety-linked biases of attention imply hypervigilance to threat and distractibility from other stimuli in the presence of feared materials. This is convincingly confirmed by various experimental-clinical studies assessing attention for threat in anxious participants compared to non-anxious controls (for a review, see Mathews & MacLeod, 2005). In contrast, theories concerning anxiety-linked biased memory for threat are less discrete; based on the shared tendency for avoidance of deeper elaboration in anxiety disorders, some models predict memory biases only for implicit memory tasks (Williams et al., 1997) or even disclaim the relevance of memory in anxiety at all (e.g., Mogg, Bradley, Miles, & Dixon, 2004). Other theories restrict the possibility of measuring disorder-specific memory biases to tasks that merely require perceptual encoding of the materials instead of verbal-conceptual memory (e.g., Fox et al., 2002; Mathews & Mackintosh, 1998). On the one hand, none of these models have integrated all the inconsistencies in empirical data on the topic. On the other hand, the numerous empirical studies on memory in anxiety that have been conducted with varying materials, anxiety disorders, encoding and retrieval conditions do not allow final conclusions about the prerequisites for finding memory biases (for a review, see MacLeod & Mathews, 2004). There indeed seems to be a tendency towards finding memory biases with implicit memory tasks and rarely with explicit memory tasks. In contrast, other well-designed and methodologically sound studies either report explicit memory biases or fail in determining distortions of implicit memory. A more detailed investigation of the complete spectrum of memory for threat utilizing carefully controlled variation for depth of encoding and materials is needed.
I. INTRODUCTION
3
In view of these schematic inconsistencies, it is all the more surprising that one important part of this spectrum has so far remained completely uninvestigated: visual working memory (VWM). No study has ever differentially addressed VWM for threat in anxious vs. non-anxious participants and none of the cognitive models of anxiety provides any predictions concerning this stage of information processing. Research on cognitive biases in anxiety has thus far only addressed the two extremes in the processing continuum: attention and longer-term memory. In between, a gap remains, the bridging of which might bring us closer to defining the prerequisites of memory biases in anxiety. As empirical research has provided substantial and coherent knowledge concerning attention in anxiety, and as attention and VWM are so closely linked (see, for instance, Cowan, 1995), the thorough investigation of the information-processing spectrum from this point may provide important clues for models of anxiety. Is anxiety related to VWM biases, or does the avoidance presumed by cognitive models of anxiety already begin at this stage? The aim of the presented work is to bridge this gap in research on cognitive biases in anxiety by implementing several visual working memory paradigms in anxious vs. non-anxious participants. As specific anxiety and specific phobia (more precisely: spider anxiety and phobia) were initially investigated, the first chapter of this dissertation starts with a review of the nosology, prevalence, and impairments associated with a specific phobia. Subsequently, an important discourse on information-processing theory is provided to prime the reader’s consciousness for the missing link in research addressing biases in anxiety, namely visual working memory. Further, the most important theoretical approaches to working memory are reviewed, along with relevant empirical results to provide a foundation for the design of paradigms assessing VWM in anxiety. Afterwards, the most accepted cognitive models of anxiety and the status of research determining anxiety-linked biases with cognitive paradigms are presented, illustrating existant gaps and limitations. At the end of this chapter, a detailed description of the aims and methods of the dissertation is delivered. In chapters 2 through 7, the implemented paradigms and results are presented. Chapter 8 delivers a conclusive review of the work.
Specific Anxiety and Specific Phobia ”There were all kind of things of which I was afraid at first, from grizzly bears to ’mean horses’ and gun fighters; but by acting as if I was not afraid I gradually ceased to be afraid.” (Theodore Roosevelt) Being powerful and famous does not protect against the development of a specific anxiety or even a specific phobia. The famous politician cited above is joined by numerous historical heads of state, such as Augustus Caesar and Napoleon Bonaparte, both reported
I. INTRODUCTION
4
to having ailurophobia, a fear of cats, or the Roman hero Germanicus who suffered a fear of birds. Edgar Allan Poe supposedly was claustrophobic, Sigmund Freud may have had agoraphobia, von Goethe feared heights, and even Muhammad Ali, known as one of the best boxers of all time, is rumored to have had a flight phobia. What characterizes these fears, and how often do they occur when even mighty men are not resistant to them? Following Marks (1987), many fears are expedient and evolutionary beneficial, as they allow the organism to react to threat in support of their own survival. However, in some cases, fears have lost their usefulness, for instance, when a person is threatened by something harmless as a house spider. Both DSM-IV (American Psychiatric Association, 1994; Sass, Wittchen, & Zaudig, 2003) and ICD-10 (Dilling, Mombour, & Schmidt, 2004) characterize a phobia as an arbitrary pronounced anxiety response to an objectively innocuous specific object or situation, which is associated with avoidance of the anxiety trigger or conspicuous discomfort and anxiety reactions when confronted with the feared stimulus. This is colorfully illustrated by the vignettes outlined above, which show how an inherently harmless spider can make a young woman cry in front of her new classmates, or force another one to risk her life by swerving off the road. Although these phobias might seem a trivial problem, the phobic reaction can be extreme, leading to gross inconsistencies between actual danger and intensity of response: ”A spider-phobic woman screamed when she found a spider at home, ran away to find a neighbor to remove it, trembled in fear, and had to keep the neighbor at her side for two hours before she could remain alone at home again; another spider-phobic found herself on top of the refrigerator in the kitchen with no recollection of getting there; a third threw herself from a galloping horse when an arachnid fell on her from a treebranch. Yet another, who could not swim, jumped out of a boat into the sea to escape a spider.” (Marks, 1987, p. 375). The classification system further requires that a phobic person be aware of the exaggerated nature of their symptoms and avoidance behavior, and that the disorder causes pronounced emotional strain or impairment in everyday life, examples of which include phobics alienating their fellow men by crying, jumping on a refrigerator, or into the sea when faced with a spider. In the field of specific phobias, the subtypes animal phobia, blood-injury-phobia, situational phobia (e.g., height phobia, flight phobia), and the phobia regarding natural phenomena (e.g., water, darkness, or thunderstorms) are differentiated. Along with the depressive disorders, specific phobias belong to the most common mental disorders. Following epidemiological studies, estimations of the life-time prevalence of specific phobias range from 4-7% (e.g., Bland, Newman, & Orn, 1988; ESEMeD/ MHEDEA 2000 Investigators, 2004; Kringlen, Torgersen, & Cramer, 2006; Weissman, 1985) to 10-15% (e.g., Kessler, McGonagle, Zhao, Nelson, Hughes, Eshleman, Wittchen, & Kendle, 1994) or even 20% (Kendler, Neale, Kessler, Heath, & Eaves 1992) of the adult
I. INTRODUCTION
5
population. Estimations of the 12-month prevalence of specific phobia provided by recent studies vary between 5% (Kringlen et al., 2006) and 7-8% (Wells, Browne, Scott, McGee, Baxter, & Kokaua, 2006; Wittchen & Jacobi, 2005). The fear of animals is one of the most common specific phobias with a life-time prevalence of 5% (Becker, Tuerke, Neumer, Soeder, Krause, & Margraf, 2000; Marks, 1987; Oest, 1987). Spiders and snakes are most often feared (e.g., Agras, Sylvester, & Oliveau, 1969; Bourdon, Boyd, Rae, Burns, Thompson, & Locke, 1988; Fredrikson, Annas, Fischer, & Wik, 1996). These animal phobias tend to start early (Craske et al., 1996; Oest, 1987). Most animal phobics remember an onset of the disorder between ages 8 and 10 (Hughdal & Oest, 1985; Marks & Gelder, 1966; McNally & Steketee, 1985). While in children animal phobias are common in both sexes, they become rarer at age 8 to 9 in boys (Lichtenstein & Annas, 2000), a trend which increases with age. Women more often fulfill the criteria for a specific phobia. In general, the proportion of women with specific phobia is about twice as high as the proportion in men (Fredrikson et al., 1996). Regarding animal phobias alone, 75-90% of patients are female (Fredrikson et al., 1996). As it is rather easy to avoid threatening animals in Northern Europe, impairments in everyday life by animal anxiety concerning, for instance, spiders, snakes, or cockroaches, are relatively low. Therefore, the criterion for impairment and emotional strain is often not fulfilled and the diagnosis ”specific phobia” not legitimized. However, the label specific anxiety became accepted as an adequate description. As the concerned person often experiences similarly high anxiety levels compared with phobics when confronted with the feared stimulus, this group should be considered when investigating and modelling specific phobia. After all, a non-negligible life-time proportion of 11% to 28% of adults (e.g., Curtis, Magee, Eaton, Wittchen, & Kessler, 1998; Essau, Conradt, & Petermann, 2000) fulfils the criteria for a specific anxiety regarding animals. However, the high prevalence of phobias is not reflected in the proportion of phobics seeking treatment. Wittchen, Hand & Hecht (1989) report that only half of their participants fulfilling criteria for a specific phobia were in treatment. Fifteen percent of Boyd and colleagues’ (Boyd, Rae, Thompson, Burns, Bourdon, Locke, & Regier, 1990) phobics received therapy, and none of Marks’ (1987) patients diagnosed with a specific phobia in general practitioners practices had entered treatment. Phobics deciding in favor of a treatment are mainly women (Marks, 1987). Despite these low help seeking rates, the judgement of specific phobia as harmless and temporarily would equate an underestimation of the disorder. Spontaneous remissions occur rarely (e.g., Agras et al., 1969), and without treatment, the course of the disease is rather chronic (e.g., Wittchen, Essau, & Krieg, 1991). Interestingly, low frequencies of treatment in specific phobia seem to be related to a lack of knowledge that the disorder is actually worth treatment and treatable, as a high proportion
I. INTRODUCTION
6
of patients enter therapy after having been informed for the first time that treatment is available (Marks, 1987). Although relevant stimuli in specific phobias might be clear cut and, therefore controllable (Reinecker, 1993), and despite the earlier, rather understated DSM-III label ”simple phobia” (American Psychiatric Association, 1980), consequences of phobias can be very drastic. Patients resigning from jobs that require regular flights, or risking the loss of social contacts due to avoiding garden parties or camping with their friends as these situations might put them in contact with the feared spiders make for impressive examples of the consequences of a specific phobia. Numerous studies have confirmed the comparatively high strain caused by the disorder (e.g., Borden, 1992; Craske & Sipsas, 1992; McNally & Steketee, 1985; Wittchen, Nelson, & Lachner, 1998). In addition, the burden is reflected in the societal costs which amount to about 800 euros per case in Germany, and the indirect costs reflected in sick-leave are even higher than the direct costs (Andlin-Sobocki & Wittchen, 2005). Given the high prevalence rates, the economic burden of specific phobias is extensive. More importantly, broad research supports the assumption of specific phobia being a risk factor for the development of comorbid disorders, such as depression (Essau et al., 2000; Kessler, Nelson, McGonagle, Liu, Swartz, & Blazer, 1996), alcoholism (Kessler, Crum, Warner, Nelson, Schulenberg, & Anthony, 1997) or social phobia (Lewinsohn, Zinbarg, Seeley, Lewinsohn, & Sack, 1997). Wittchen and Vossen (1996) reported that 83% of all patients diagnosed with a specific phobia develop at least one additional mental disorder during lifetime. In the National Comorbidity Survery, Kessler et al. (1994) determined a two to fourfold heightened risk of developing a secondary depression, eating disorder, or substance addicition disorder in persons diagnosed with a specific phobia compared to persons without that diagnosis. In short, specific phobias occur often, start rather early and cause far-reaching strain, making the development of valid models of the etiology, maintenance and therapy of specific phobias essential. Presumably, numerous factors contribute to the etiology of specific phobias (see, for instance, Rachman, 1998), but the discussion of how these factors contribute to the development of a phobia is not complete. Conditioning factors (e.g., Eysenck, 1982; Mowrer, 1939; Poulton & Menzies, 2002), evolutionary aspects (e.g., Guentuerkuen, 2000; Oehman, Erixon, & Lofberg, 1975; Seligman, 1971), genetic factors (e.g., Gelernter, Page, Bonvicini, Woods, Pauls, & Kruger, 2003; Torgersen, 1988), and neurophysiological causes (e.g., LeDoux, 1996; Panksepp, 1998; Rolls, 1999) are all thought to be relevant in the onset of a specific phobia. Furthermore, cognitive models of anxiety focus on the relevance of information processing for the development of fear. As not every threatening situation is followed by the onset of a specific phobia (e.g., Eysenck, 1982), as persistent anxiety can also occur via the observation of learning processes (e.g., Bandura, 1977; Gerull & Rapee, 2002; Mineka, 1985; Rachman, 1978) and as fear is not always related to avoidance (e.g., Craske, Sanderson, & Barlow, 1987), cognitive factors seem to play a significant role
I. INTRODUCTION
7
in the etiology and maintenance of anxiety disorders (e.g., Barlow, 1988; Beck & Clark, 1997; Salkovskis, 1996). Those theories do not question the anxiety acquisition through learning processes. However, these approaches attribute the stability of anxiety disorders to maladjusted, distorted cognition, such as biased interpretation of or distorted memory for a situation or stimulus. However, it is still not completely clear at which stage of information processing the anxiety-linked biases occur. The present work focuses on the role of biased cognitive processing in the development of anxiety disorders. As indicated at the beginning of this work, cognitive theories of anxiety assume disorder-specific attentional biases, but strongly differ with respect to predictions concerning memory biases. Therefore, an important gap exists in both theory and empirical evidence: visual working memory is neither considered in theoretical approaches nor ever addressed in research on anxiety-related biases. The following section provides a short outline of information-processing theory to enhance the understanding of currently available data on cognitive biases and the astonishing gap in cognitive-clinical research. A review of the most relevant theoretical approaches and empirical studies of VWM in general psychological research is provided to prepare the development of aims, methods, and results of the work at hand, which aims at integrating this missing link.
Attention and Memory ”The greatest sightseeing available is the world – take a look at it.” (Kurt Tucholsky) If one were to ask of either the average layperson or an experienced attention researcher how much of their environment they are able to visually capture at one single moment, most of them – maybe all of them – would report the impression of seeing a rich, complete world. However, this sensation strongly conflicts with change blindness studies demonstrating the failure of experimental participants to notice the change in identity of a main figure from a movie they are watching (Simons & Levin, 1998), the appearance of a gorilla during a basketball game they are attending (Simons & Chabris, 1999), or the replacement of a bottle by a box (Simons, 1996) in 50% of cases. It seems humans perceive only a fraction of the amount they believe they see at any one moment. The core of this phenomenon is the failure of seeing significant changes made during a saccade (Grimes, 1996) or comparable interruptions of attention like image flickering or alternating (O’Regan, Rensink, & Clark, 1999; Rensink, 1997; Rensink, O’Regan, & Clark, 1995). Several authors postulate that processing bottlenecks, that is, capacity limitations at the level of attention (e.g., Broadbent, 1958; Mack & Rock, 1998a; Pashler, 1993; Rensink et al., 1997) and working memory (e.g., Jolicoeur, 1999; Jolicoeur & Dell’Acqua, 1998; Luck & Vogel, 1997; Wolfe, Reinecke, & Brawn, 2006) are relevant for the reported failures in these tasks and in addition, suggest
I. INTRODUCTION
8
long-term memory as relevant for these deficiencies in change detection (e.g., O’Regan, 1992). Regarding focused attention, it is currently broadly accepted that it is a limited resource which requires a selection of objects within a rich environment for attention (e.g., Kahnemann, Treisman, Burkell, 1983). Some authors even suggest that attention can be drawn to only one or two objects (e.g., Baylis & Driver, 1995a, 1995b; Broadbent, 1958; Horowitz & Wolfe, 1998; Oliva, Wolfe, & Arsenio, 2001; Tipper & Weaver, 1996; Treisman & Gelade, 1980; Wolfe, 1999; Wolfe & Bennett, 1997; Wolfe et al., 2006), while the remaining scene is represented in a preattentive state (e.g., Treisman, 1996; Treisman & Gelade, 1980; Wolfe, 1999; Wolfe & Bennett, 1997). Following these approaches, features defining the contents of a scene are - prior to attention - only loosely bundled to preattentive objects. Attention allows the construction of reliable object representations in memory and thus, object recognition. The deployment of attention elsewhere causes a quick decay in the representation of recently attended objects to their preattentive state, conceptualized as ”postattentive vision” (Wolfe, 1997; Wolfe, Klempen, & Dahlen, 2000). Research supports the assumption that even unattended objects are somehow represented in a preattentive state. For instance, words presented during the attentional blink are not completely attended and thus not recallable, but nevertheless they cause a N400 component in EEG curves, indicating semantic processing (Luck, Vogel, & Shapiro, 1996). Presumably, the attentional selection consists of three separate components: the shift of attention towards an object within the visual field, the engagement of attention to that object, and the disengagement of attention from that object to move to another stimulus (Posner & Peterson, 1990). Thereby, two types of stimulus processing are differentiated, automatic vs. controlled processing (e.g., Posner & Snyder, 1975; Schneider & Shiffrin, 1977; Yonelinas & Jacoby, 1995). Controlled processes are defined as capacity-limited as they require attentional resources, and they are endogenuously (see e.g., Jonides, 1981; Mueller & Rabbitt, 1989) activated under voluntary control of the individual. For instance, when we drive a new route or listen to someone speaking at a loud party, our direction of attention is intentionally and in a top-down manner controlled by the observer. Automatic processing, on the other hand, is assumed to be very quick and unlimited in capacity, as it is not attention-consuming, and inevitable; that is, the process involuntary takes place whenever a specific stimulus occurs. It can be caused exogenously by unexpected events, for instance a big spider jumping across the windshield or crawling across the party buffet. How are attention, working memory, and long-term memory related? Currently three main memory processes are postulated: a sensory register, a short-term storage, and a longterm memory (Atkinson & Shiffrin, 1968). The distinction between short-term storage and
I. INTRODUCTION
9
long-term memory of theoretically unlimited capacity and duration is widely accepted (e.g., Cowan, 1995; Hintzman, 1978) and well supported by empirical data (e.g., Baddeley & Warrington, 1970; Milner, 1958; Parkin, 1999). Furthermore, the distinction between the two types of short-term storage, the sensory register and the working memory, is broadly confirmed (e.g., Phillips, 1974; Sperling, 1967). The sensory register is conceptualized as a high-capacity but crude storage for sensory impressions over several milliseconds (Phillips, 1974; Sperling, 1967; van der Hejden, 1981) following the stimulus presentation. Information can then enter the next module, the short-term or working memory via attention (e.g., Palmer & Ames, 1992; Scott-Brown & Orbach, 1998). Bundesen’s (1990, 1998) theory of visual attention and short-term memory acts on the assumption that the strong capacity limitations of attention lead to competition between numerous objects in the visual field for attention and identification. Identification and reportability of an item is assumed to involve storage in visual working memory. As attention is a capacity-limited resource, a selection between objects is required. Following this theory, this would occur on the basis of attentional weighting of each item within the visual field, which takes place at the first processing stage. Objects of high relevance are preferentially weighted and processed, including their storage in visual working memory. Originally, Bundesen’s theory addressed processes that occurred during visual search tasks and suggested that weighting is most favourable for the target stimulus and that objects sharing features with this target would also get a high weighting. Could individually threatening stimuli – for instance spiders for spider phobics – be considered as ”targets of the mind” and, thus, be weighted so that they are favorably stored in visual working memory? As this memory system is most relevant to the work at hand, the most prominent concepts of working memory are outlined below in more detail. Models of Working Memory While Atkinson & Shiffrin (1971) postulated one unitary short-term storage for information from all sensory modalities, several studies contradict that conclusion (e.g., Frick, 1984; Jonides, Smith, Koeppe, Awh, Minoshima, & Mintun, 1993; Smith & Jonides, 1997) and indicate multiple, modality-specific subsystems within short-term memory (e.g., Baddelely, 2000; Baddeley & Hitch, 1974; Baddeley & Logie, 1999; Cowan, 1995). Some concepts of working memory have tried to define it with respect to its structure (e.g., Baddeley, 1986; Baddeley & Logie, 1999), that is, they address working memory as a module distinct from long-term memory. One of the most famous and empirically best-supported working memory concepts is that of Baddeley and colleagues. In their original framework, Baddeley & Hitch (1974) postulated a multi-component short-term memory model assuming separated memory systems for visual and verbal data controlled by a central executive, which has subsequently been upgraded via a fourth component: the episodic buffer (Baddeley, 2000). The central executive controls the phonological loop, the visuospatial sketchpad and the episodic buffer. It has been described as a limited-capacity attentional controller and thus,
I. INTRODUCTION
10
can determine processing priority within the subsystems. If required, it causes the disruption of routine processing in order to monitor non-routine processes. Moreover, it is required for rehearsal. The phonological loop is capable of short-term storage of verbal information, and the visuo-spatial sketchpad is responsible for temporary maintenance and manipulation of visuospatial information. In addition, the visuospatial sketchpad itself is considered as a multi-component system involving structures for spatial vs. visual information, which is evidenced by functional imaging (Smith, Jonides, & Koeppe, 1996). Finally, the episodic buffer provides a capacity-limited interface between the subsystems and long-term memory, as it is capable of working with multimodal code. Thus, it can integrate information from long-term memory and information currently extracted from the visual or acoustical world. Postulations about its function are supported by fMRI evidence (Prabhakaran, Narayanan, Zhao, & Gabrielli, 2000). Presumably, there are explicit bidirectional links between the visual and verbal subsystems and long-term memory. For instance, implicit long-term knowledge of the visuo-spatial world is able to influence visuo-spatial sketchpad mechanisms, and the visuo-spatial sketchpad information can directly be fed towards long-term memory. Are threat-evoking stimuli especially well represented in long-term memory and thereby influence the direction of attention and contents of visual working memory in a top-down manner? In contrast to Baddeley’s concept, the model of Cowan (1995) accentuates the function instead of the structure in defining working memory. Here, the term working memory refers to currently activated and, therefore more easily accessible elements within long-term memory. Only a subset of these activated elements becomes the core of focal attention. Thus, working memory according to Cowan involves both activated elements within and beyond attention. Altogether, the author assumes a short-term storage capacity of about 4 items (Cowan, 2001) of which representations are quickly lost within 10 to 20 seconds without rehearsal. The author postulates a process similar to Baddeley’s (e.g., Baddeley & Hitch, 1974) central executive as being relevant in the activation of these elements. Thereby, this model explicitly emphasizes that attention can be guided exogenously and thus activate elements in long-term memory through orientation mechanisms. In addition, different neural structures for verbal vs. visual information are assumed, but there is no explicit modularisation postulated. In a rather functional, dynamic-competitive working memory concept (Schneider, 1999) it is also proposed that storage in working memory (either a verbal or a visuospatial subcomponent) requires higher-level processing or attention. In this model, it has been conceptualized that only one object at a time can be put into the short-term storage, as this requires attention. Only when isolated in working memory are all features of an object including its spatial position bound to a reliable object representation. This state is postulated to be restricted to
I. INTRODUCTION
11
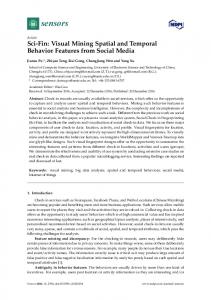
about 4 items. However, only one of these objects is linked to the external, real stimulus via attention. This object is labeled an online-object, as each change in the external object can cause an update of the representation in memory. The remaining three objects are called offline-objects. They are not in contact to their external correspondent anymore and reside in the state of retention. The quality of the memory representation depends on the activation of that stored object. A newly stored item is represented with the highest activity and as only a constant, limited amount of activation is available, the activation state of older items within working memory sinks with every newly stored object. When the working space is filled but a new item is brought into storage, the object with the lowest activation is removed and thus forgotten. The author emphasizes the possibility of top-down influences: if, for instance, a task requires reporting red words, those words can be provided with extra activation. The provision of extra activation to one object means, at the same time, a reduction of activation for other, older items. Empirical Research on Visual Working Memory Studies on visual working memory (VWM) have been able to widely support the concept of a VWM storage capacity of about 4 items (e.g., Cowan, 2001; Irwin & Andrews, 1996; Luck & Vogel, 1997; Miller, 1956; Pashler, 1988; Wheeler & Treisman, 2002; Wolfe et al., 2006). Important research on the topic was, for instance, done by Luck and Vogel (1997), who successively presented two displays including a set of colored dots in a change-detection paradigm (see Figure I.1). The second display depicted either exactly the same dot pattern as the first display, or with a change in color of a single dot. Participants had to decide whether a change had occurred or not. By varying the set size, the authors were able to estimate the working memory capacity from participants through report accuracy, which seems to amount to approximately 4 items.
STUDY DISPLAY 100 ms vs. 500 ms
WHOLEWHOLE-TEST DISPLAY
MAIN RESULTS
same or different?
% CORRECT
100
2
4
6
8
10
12
set size
Figure I.1: Schematic depiction of the methods and results of the VWM-paradigm presented by Luck and Vogel (1997)
I. INTRODUCTION
12
However, this paradigm allows no insights into position effects in working memory, as all stimuli are simultaneously presented and available for attention. From verbal memory research it has been shown that primary and recently attended items are preferably memorized (e.g., Murdock, 1962). Is the same true for visual working memory? In a serial cueing paradigm, Wolfe et al. (2006) presented 20 dots in five different colors on the display, a subset of which was cued, one after another by an increment in luminance and size, at the rate of covert attention (see Figure I.2). This cueing procedure was implemented to externally guide attention through the display. After the cueing, one of the dots was hidden and probed for a memory test. Report accuracy was calculated in dependence of an items position within the cue string. The authors report higher accuracy for cued than for uncued dots, and memory for earlier attended dots was lower than for recently cued dots. Thus, a recency effect was observed in visual working memory, implying a fast decay of visual working memory representations. Similar results are reported by Irwin and Zelinsky (2002), who controlled the direction of attention to real objects with eye movement tracking and tested the memory for a specific item after a specific number of fixations.
CUEING PROCEDURE SOA = 150 ms
PROBING
MAIN RESULTS
What was the color? color?
% CORRECT
100
1
2
3
4
5
6
CUE
Figure I.2: Schematic depiction of the sequential cueing VWM-task introduced by Wolfe et al. (2006)
While the research by Luck and Vogel (1997) aimed at identifying the degree of capacity limitations concerning the storage size of VWM, another important topic of research is in addressing questions regarding capacity limitations during encoding of items into VWM. For instance, Shapiro, Raymond, and Arnell (1994) asked their participants to attend to a stream of black letters and to identify the first target, indicated by a white color and decide whether a second target, a black-printed ”X”, was present or absent (see Figure I.3). Each item was presented for 100 ms. Observers showed a reduction in report accuracy for the second target within the fast string of stimuli when it was preceded by another attended target within a temporal distance of 100 to 400 ms. This phenomenon of disturbed
I. INTRODUCTION
13
information processing is called the Attentional Blink (AB). It is confirmed for a wide variety of materials (e.g., Broadbent & Broadbent, 1987; Raymond, Shapiro, & Arnell, 1992; Reeves & Sperling, 1986). Most authors ascribe the reduced performance during the AB to resource limitations in working memory consolidation (e.g., Chun, 1997; Chun & Potter, 1995; Jolicoeur & Dell’Acqua, 2000; Olson, Chun, & Anderson, 2001; Vogel, Luck, & Shapiro, 1998). It is assumed that VWM consolidation works slowly and in a serial fashion (e.g., Chun & Potter, 1995). Consolidation of the second target can only occur after the processing of the first target is complete. Prior to this, the target is represented in a very sparse and vulnerable state. The longer an item is preserved in this stage, the higher the probability of losing its representation, causing a lower report probability.
PRESENTATION PROCEDURE
MAIN RESULTS
What was the first target , was there a second target? target?
G R
100
T1
% CORRECT T2
D P X S T2
…
Y
1 2 3 4 5 6 7 8
target distance
Figure I.3: Simplified depiction of methods and results of the Attentional Blink task reported by Shapiro, Raymond & Arnell (1994)
In sum, information processing approaches assume capacity limitations in processing which are reflected in human experience, experimentally supported, for instance, by change-blindness studies as described at the beginning of the section. Amongst others, the bottleneck in processing resources can be located at the level of selective attention (e.g., Kahnemann & Treisman, 1984; Pashler, 1993; Shiffrin, 1976), or at the level of working memory (e.g., Jolicoeur, 1999; Jolicoeur & Dell’Acqua, 1998). It seems that we are only able to attend one or two objects within the visual scene (e.g., Wolfe & Bennett, 1997), and are only able to hold about four items in visual working memory for representing our external world (e.g., Luck & Vogel, 1997). In addition, the possibility of an item being encoded into VWM seems to be limited to one item at a time (e.g., Chun & Potter, 1995). Attention and VWM are assumed to be closely linked, as attention to an object is prerequisite for putting the object into VWM (e.g., Cowan, 1995; Schneider, 1999). While attention allows detection and identification of objects, VWM is needed for short-term retention of this information, even when attention has to be directed elsewhere. Thus, VWM
I. INTRODUCTION
14
allows a monitoring of changes to alterable objects, as for instance in the color changes of traffic lights or in the movements of spiders without attention to these objects at all time. As our external world supplies a great deal of stimuli simultaneously, object selection is required for attention and thus encoded and stored in VWM. The models of VWM described above consistently postulate that external stimuli are preferably attended, encoded and stored in VWM when they are of greatest relevance. In phobics for instance, the feared stimuli are of extraordinary importance, as their presence is associated with strong anxiety symptoms and avoidance behavior. Cognitive models of anxiety (e.g., Mathews & Mackintosh, 1998; Williams et al., 1997) even assume that preferences in processing are relevant in the pathogenesis of the disorders. At which stages of the information-processing described above do disorder-specific distortions occur? The following section provides an outline of cognitive-clinical research concerning specific phobias and other anxiety disorders, and surveys related cognitive theories aiming at integrating these results.
Attention, Memory and Anxiety ”An emotion is a tendency to feel, and an instinct is a tendency to act, characteristically, when in presence of a certain object in the environment [...]. In both instinct and emotion the mere memory or imagination of the object may suffice to liberate the excitement.” (James, 1892; p. 373) Our natural environment confronts us with an extraordinary variety of stimuli. As outlined in the previous section, our attentional system allows the conscious processing of only a few stimuli at any moment, which necessitates attentional selection of small cut-outs of our rich surroundings. Evolution enabled us to preferrentially attend danger signals such as spiders or threatening faces allowing rapid detection of threat and reactive behaviour, which presumably increased an individual’s survivability. In this manner, a hypervigilance to evolutionary relevant stimuli that might have endangered survival would be adaptive. On the other hand, the danger detection system seems to be overcautious in clinical-relevant anxiety disorders. It is dysfunctional and maladaptive to be so strongly distracted by a spider as to risk a car accident or humiliation in front of new classmates. As had been mentioned earlier, cognitive theories of emotional disorders (e.g., Beck, Emery, & Greenberg, 1985; Mathews & Mackintosh, 1998; Wells & Matthews, 1994; Williams et al., 1997) assume certain cognitive processing styles as vulnerability factors for the development of emotional disorders. Thereby, disorder-specific processing biases are postulated, which imply privileged processing of anxiety-related stimuli. To verify this as-
I. INTRODUCTION
15
sumption and to determine at exactly which processing stages distortions occur, paradigms from experimental psychology have been adapted with emotional materials and tested with anxious participants. This research addresses biased attention towards threat, biased memory, biased interpretation of ambiguous stimuli as threatening (e.g., Calvo, Eysenck, & Castillo, 1997; Mathews, Richards, & Eysenck, 1989), and biased associations (e.g., Teachman & Woody, 2003). The current section reviews the status and methodology of research on attentional and memory-relevant processing distortion in anxiety and associated cognitive frameworks for explaining the relationship between such processes and anxiety. Afterwards, missing links and limitations in empirical and theoretical approaches are discussed. Status of Research Research on attentional biases in specific phobia There are a breadth of studies that show attentional biases in non-clinical populations with heightened trait anxiety and clinical-relevant anxiety disorders. As an attentional bias implies the preferable attentional selection of threatening or disorder-related stimuli, this research is focused in two directions. One: on the ability of anxious participants to quickly detect the presence and location of threatening stimuli and two: on the debilitated performance of participants for non-threatening stimuli in the presence of threatening stimuli. ”Patients search for the feared animal wherever they go. The slightest hint of its presence will disturb them where the average person would not notice it.” (Marks, 1987, p. 375). Both tendencies - enhancement effects for threatening stimuli and distraction effects by threat are experimentally confirmed for anxiety disorders such as specific phobia. The preferred methods for research in attentional biases are the emotional Stroop task, the dot-probe paradigm, visual search tasks, and eye movement registration. In the classical emotional stroop paradigm, delayed response time in naming colors for words when the word is threatening compared to neutral or positive reflects an attention bias, as the threatening content automatically distracts the observer’s attention. This effect is has been shown in specific phobia using mainly verbal materials (e.g., spider phobia: Barker & Robertson, 1997; Kindt & Brosschot 1997, 1998; Thorpe & Salkovskis, 1998a; van den Hout, Tenney, Huygens, & deJong, 1997; Watts, McKenna, Sharrock, Tresize, 1986; snake phobia: Mathews & Sebastian, 1993; Wikstroem, Lundh, Westerlund, Hoegman, 2004), but also with pictorial materials (Constantine, McNally, & Hornig, 2001). Remarkably, emotional stroop effects seem to be very specific for concern- or anxiety-relevant materials, but not negative materials in general. In addition, threat effects can already be measured with an emotional stroop task in children (e.g., Kindt & Brosschot, 1999; Martin, Horder & Jones, 1992) and seem to be very stable over time (Kindt and Brosschot, 1998). These effects are also reliably observed in other anxiety disorders, such as generalized anxiety disorder (e.g., Martin, Williams & Clark, 1991; Mathews & MacLeod, 1985; Mogg,
I. INTRODUCTION
16
Mathews, & Weinman; 1989), post-traumatic stress disorder (e.g., Harvey, Bryant, & Rapee, 1996; McNally, English, & Lipke, 1993; McNally, Kaspi, Riemann, & Zeitlin, 1990), panic disorder (e.g., Ehlers, Margraf, Davis, & Roth, 1988; Lavy, van Oppen, & van den Hout, 1994; Lundh, Wikstroem„ Westerlund, & Oest, 1999; McNally, Riemann, & Kim, 1990), obessive-compulsive disorder (e.g., Foa, Ilai, McCarthy, Shoyer, & Murdock, 1993), and social phobia (e.g., Hope, Rapee, Heimberg, & Dombeck, 1990; Mattia, Heimberg & Hope, 1993). In the visual-dot probe task, a word or picture pair containing a threatening and a non-threatening word or image one upon the other is presented. Subsequently, the words or pictures vanish and at the location of one of the two a dot is presented. Participants are asked to report it as soon as possible. An attentional bias is reflected in a facilitated probe detection task when the probe appears at the same location as the threat stimulus (enhancement effect) and a delayed reaction when it appears at the other location (distraction effect). Thus, this paradigm allows the separate investigation of both effects associated to attentional biases. Using a pictorial dot-probe paradigm, disorder-related attentional biases have been reliably demonstrated for specific phobia of spiders (e.g., Lipp & Derakshan, 2005; Mogg & Bradley, 2006). In addition, this task has succeeded in finding attentional biases in heightened trait anxiety (e.g., Derryberry & Reed, 2002; Wilson & MacLeod, 2003) and in further anxiety disorders such as generalized anxiety disorder (e.g., MacLeod, Mathews & Tata, 1986). In visual-search or odd-one-out paradigms, participants are required to decide whether or not a defined target is visible within a stimulus array, and whether or not a presented stimulus display contains a deviant item. Research suggests reduced reaction times in phobic individuals when the target is threat-related and increased reation times when the distractors are threatening words or pictures (e.g., Oehman, Flykt, & Esteves, 2001; Oehman, Lundquist, Esteves, 2001; Rinck, Reinecke, Ellwart, Heuer, & Becker, 2005). In addition, fear-related attentional biases have been detected with event-related potential investigations (Carretie, Mercado, Hinojosa, Martin-Loeches, & Sotillo, 2004) and eye movement registration studies (e.g., Hermans, Vansteenwegen, Eelen, 1999; Mogg, Millar, & Bradley, 2000; Pflugshaupt, Mosimann, von Wartburg, Schmitt, Nyffeler, & Muri, 2005; Rinck & Becker, 2006; Rinck et al., 2005). Eye tracking studies very coherently report a vigilance-avoidance pattern for phobics, involving faster fixation of the threatening picture in the fearful group compared to controls, but a very short gaze duration and quick deployment of attention and eye gaze away from the threat. From this pattern it is concluded that phobics reveal an early reflexive attentional bias towards, followed by avoidance of threatening stimuli.
I. INTRODUCTION
17
In sum, it is widely evidenced that anxious individuals quickly detect threatening stimuli, but are also distracted from other stimuli visible within the visual field by doing so. However, it is not yet clear-cut whether those effects trace back to attention selectively shifted towards a threatening stimulus in the environment, or to difficulties in disengaging attention from threat. Recent research suggests that both processes might take place (e.g., Mathews, Fox, Yiend, & Calder, 2003). In addition, it remains unclear whether the avoidance tendency revealed, for instance, in eye tracking studies as described above also results in reduced memory for threatening stimuli. Research on memory biases in specific phobia James’ (1892) words at the beginning of this section suggested that the mere memory of a threatening stimulus might activate anxiety. Nevertheless, in contrast to the well-evidenced existence of attentional biases, it remains unclear whether anxiety disorders are related to disorder-specific memory biases. Some studies find anxiety-associated memory biases, some do not. An important differentiation in memory bias research has occured between explicit and implicit memory (e.g., Graf & Schachter, 1985; Hamann, & Squire, 1996; Jacoby & Witherspoon, 1982). In explicit learning, definite strategies for encoding of materials are necessary; a person experiences the explicit memorization as a result of their strategic and effortful search in memory. In implicit memory tasks, participants are not aware of a learning process. Learning merely occurs incidentally, as the person processes the study materials only indirectly. Thus, memorization occurs without reference to a learning situation. Paradigms that are used to investigate explicit memory include free recall (where, for instance a person is asked to reproduce as many words as possible from an earlier list) in addition to free recognition (where a person decides whether or not a word or picture presented in the test phase was learned previously in the study phase). Implicit memory has been investigated through methods such as the word stem completion task, where the influence of earlier words is determined by the degree to which a person unintentionally completes later-seen word stems. Another favorite method for the investigation of implicit memory is the identification method, where two stimuli are presented with suboptimal recognition terms; it is presupposed that implicitly familiar stimuli are nonetheless more easily detected. Concerning the investigation of explicit memory bias, there is currently little evidence for biased recall in specific phobia. Studies presenting word lists including phobia-related words to high and low fearfuls to test the probability for free recall dependent on the word valence failed to detect an enhanced recall for threat-related words in spider phobia (e.g., Kulas, Conger, and Smolin, 2003; Watts, 1986; Watts & Dalgleish, 1991). Other studies succeeded in finding memory biases for better recall of phobia-related words (e.g., Kindt & Brosschot, 1998; Rusted & Dighton, 1991). Even the use of ecologically valid materials
I. INTRODUCTION
18
such as pictures, real spiders, or video clips has lead to conflicting reports. Wessel and Merckelbach (1998) presented threat-relevant (e.g., dead spider, picture of a spider) and threat-irrelevant (e.g., baby doll, picture of a baby) objects pinned on a bulletin board to spider fearfuls and non-anxious controls, and determined enhanced recall of identity and board position of disorder-related items. However, other studies testing recall memory for video-clips including spiders (Thorpe & Salkovskis, 2000) or recall of an earlier experienced spider confrontation situation (Wessel & Merckelbach, 1997) reported no enhanced recall of disorder-related details. Studies assessing biased recognition of threat-relevant materials also fail in providing a coherent story for memory bias in specific phobia. While some studies report enhanced recognition of spider-related words (Watts, 1986) or enhanced recognition of real spiders or pictures (Wessel & Merckelbach, 1998) in fearfuls compared to controls, other studies have failed in detecting enhanced recall of real spiders (Watts, Tresize, & Sharrock, 1986) or details of spider video-clips (Thorpe & Salkovskis, 2000). There are only few studies assessing implicit memory in specific phobia, but mainly the results are in favor of enhanced implicit memory for phobia-related materials (e.g., Sawchuk, Lohr, Lee, & Tolin, 1999). Regarding other anxiety disorders, research results are similar. Most studies testing for word memory were unable to reveal disorder-specific recall biases (e.g., generalized anxiety disorder: Becker, Roth, Andrich, & Margraf, 1999; Mathews, Mogg, May, & Eysenck, 1989; social phobia: Amir, Coles, Brigidi, & Foa, 2001; Cloitre, Cancienne, Heimberg, Holt, & Liebowitz, 1995) or biases for recognition (e.g., generalized anxiety disorder: MacLeod & McLaughlin, 1995; Mogg et al., 1989; social phobia: Cloitre et al., 1995; Mansell, Clark, Ehlers, & Chen, 1999; post-traumatic stress disorder: Vrana, Roodman, & Beckham, 1995; obsessive-compulsive disorder: Foa, Amir, Gershuny, Molnar, & Kozak, 1997; panic disorder: Ehlers et al., 1988). However, a few studies using more ecologically relevant materials such as pictures or real objects report enhanced recall (e.g., obsessive-compulsive disorder: Constans, Foa, Franklin, & Mathews, 1995; Radomsky & Rachman, 1999) and enhanced recognition (e.g., social phobia: Lundh and Oest, 1996; panic disorder: Lundh, Thulin, Czyzykow, & Oest, 1998) for threat. Evidence for disorder-specific implicit memory biases is rather strong (e.g., generalized anxiety disorder: MacLeod & McLaughlin, 1995; Mathews et al., 1989; social phobia: Amir, Foa, & Coles, 2000; post-traumatic stress disorder: Amir, McNally, & Wiegartz, 1996; and panic disorder: Amir, McNally, Riemann, & Clements, 1996), but there are also studies that failed to find implicit memory biases (e.g., Bradley, Mogg, & Williams, 1995; Lundh et al., 1999; Rapee, McCallum, Melville, Ravenscroft, & Rodney, 1994). To summarize, research to date coherently suggests attentional biases in specific phobia and in other anxiety disorders, implying increased detection of threatening stimuli and
I. INTRODUCTION
19
related distractibility from other materials. In contrast, there exists little evidence for explicit memory bias in phobia or for most other anxiety disorders (as an exception, there is a multitude of evidence for explicit memory bias in panic disorder, e.g., Becker, Rinck, & Margraf, 1999; Lundh et al., 1998). Implicit memory tests reveal stronger evidence for anxiety-associated memory biases, but nevertheless, the data remains incoherent. Cognitive theories of anxiety (e.g., Beck et al., 1985; Mathews & Mackintosh, 1998; Williams et al., 1997) provide a theoretical framework to improve comprehension of the circumstances under which cognitive biases occur and offer a rationale as to why they occur in a specific manner, helping us answer the question of how cognitive factors cause or maintain anxiety, and how cognitive therapeutic methods might be improved. An outline of the most relevant cognitive theories of anxiety is provided in the following section. Cognitive Theories of Anxiety Cognitive theories of anxiety (e.g., Armfield, 2006; Barlow, 1988; Clark, 1997; Clark & Wells, 1995; Eysenck, 1992; Foa & Kozak, 1986; Hermans & van Honk, 2006; Johnson & Hirst, 1993; Matthews & Wells, 2000; Mogg & Bradley, 1998; Oehman, 1993; Power & Dalgleish, 1997; Salkovskis, 1985; Wells & Matthews, 1994; Williams et al., 1997) assume that cognitive processes play a crucial role in the etiology and maintenance of anxiety disorders. Earlier models focused on explaining fear against a background of associative fear networks (e.g., Bower, 1981; Bower, 1987) and high-level cognitive schemata (e.g Beck et al., 1985; Lang, 1993), which propose a disorder-specific cognitive structure, influencing a person’s perception, interpretation and memory: ”When a threat is perceived the relevant cognitive schemas are activated; these are used to evaluate and assign meaning to the event [...]; there occur a series of adjustments to ’fit’ appropriate schemas to a specific threat. One’s final interpretation is the results of interaction between the event and the schemas.” (Beck et al., 1985, p. 56). These models suggest that mental disorders are reflected in disorder-specific dysfunctional schemata and predict that patients will show mood-congruent biases in cognitive processing. Anxious patients should preferably attend to and remember anxiety-related events. However, these early models soon proved to be insufficient in explaining newer data that showed differences between biases in different emotional disorders, such as the incoherent data for memory biases in anxiety disorders. Recent information-processing models are more complex and try to integrate schema theoretical approaches, information processing theory and empirical evidence (e.g., Beck & Clark, 1997; Wells & Mathews, 1994; Williams et al., 1997) allowing a wider variety of predictions. Below, some of the currently influential models and hypotheses are outlined in more detail. The Integrative Cognitive Model of Emotional Disorders of Williams et al. (1988, 1997) aimed at explaining the dissonance between the well-evidenced attention bias and the
I. INTRODUCTION
20
incoherent evidence of a memory bias in anxiety disorders. As an explanation, the authors emphasized the relevance of two distinct cognitive processes underlying attentional and memory bias: automatic priming vs. strategic elaboration. The automatic processes are thought to be most relevant in anxiety disorders, while strategic components of processing are considered rather irrelevant. Two different appraisal pathways are proposed – one automatic, one strategic. As depicted in Figure I.4, a preattentively working affective decision mechanism evaluates the affective valence of external stimuli. Based on this decision, attentional resources are allocated within the stimulus field. During subsequent elaborative processing, the resource allocation mechanism assesses the affective valence of the stimuli. When this mechanism directs additional resources to a specific stimulus, it is encoded more firmly and with increased detail. The initial automatic processing can explain attentional biases, while the subsequent strategic processing might explain memory biases. According to the authors, anxious individuals detect threat automatically at the preattentive processing stage, and subsequently focus attention on the threat. At the following stage of elaboration, however, phobics tend to remove resources from the threat, favouring anxiety-reducing avoidance. This might result in reduced encoding and thus, lower reproduction.
STIMULUS INPUT
AUTOMATIC PRIMING
ELABORATION NONNON-MEMORIAL Resource Allocation Mechanism
Affective Decision Mechanism
Attentional Biases
Implicit Memory Biases
high
attention/ vigilance to threat
low
no attention/ vigilance to threat
threat value
MEMORIAL
no explicit Memory Biases
perceptual elaboration of threat
no conceptual elaboration of threat
Figure I.4: The effects of anxiety on the allocation of resources at the priming stage and the perceptual vs. conceptual elaboration stage according to the model of Williams et al. (1997) supplemented by the MEM-concepts of Johnson and Hirst (1993)
Although empirical studies provide coherent support for anxiety-specific attentional biases, there remains conflicting evidence supporting a memory bias. There seems to be a wealth of reliable reports of increased memory for threatening materials in implicit tasks and anxiety; whereas the situation is less coherent in explicit memory. On the other hand, it is problematic that some studies find explicit anxiety-related biases (e.g., Friedman, Thayer, & Borkovec, 2000; Russo et al., 2001), while other studies fail to find implicit memory biases in anxiety disorders (e.g., Rapee et al., 1994; Russo, Fox, Bellinger, & Nguyen-van-Tam,
I. INTRODUCTION
21
1999). Supplementing their original model (Williams et al., 1988) with the Multiple Entry Memory (MEM) model (Johnson & Hirst, 1993), Williams and colleagues therefore suggest additional differentiation types: memorial vs. non-memorial elaborative processes to better explain the inconsistency in memory data. Non-memorial elaboration is defined as emerging from perceptual processes which are initiated from a bottom-up approach and are data-driven, as is the case in implicit memory tests. This elaboration subtype is reflected, for instance, in the discovery of stimuli. Memorial elaboration, however, implies deeper, more strategic elaborative processing than non-memorial elaboration. This subtype involves conceptual top-down processes, which are concept-driven, reflected in the rehearsal or retrieval of a stimulus, for instance, in explicit memory search. Based on this differentiation, the authors predicted implicit but not explicit disorder-specific memory biases in anxiety disorders, as only implicit memory is associated with the automatic processes typical for anxiety disorders. The authors therefore concluded that several subtypes of elaboration would need to be considered in future research testing this theoretical approach. One limitation reported was the exclusive use of verbal stimuli, leaving the question as to whether the model is generalisable at all to visual materials. Indeed, the model lacks an explanation as to why recent studies have reported explicit memory biases in anxiety with pictorial materials (Lundh et al., 1998; Wessel & Merckelbach, 1998). More critically, evidence for recall biases with verbal materials has been shown (e.g., Kindt & Brosschot, 1998; Rusted & Dighton, 1991), which definitely conflicts with the predicitions of the model. In a similar approach, Mogg and colleagues (e.g., Mogg et al., 2004; Mogg, Mathews, & Weinman, 1987) aimed at explaining why the well-evidenced attentional biases in anxiety are not also accompanied by memory biases. The authors’ Vigilance-Avoidance-Hypothesis postulates that anxious individuals show an automatic orientation of attention towards threat-related items, followed by strategically directing attention away from the threat to reduce the triggered fear. Such avoidance strategies conflict with the detailed elaborative processing required for the construction of memory representations. Indeed, specific fear is related to vigilance-avoidance patterns of cognitive biases. Mogg et al. (2004) presented pairs of an aversive threat scene (e.g., death, mutilation) and a non-threatening scene for 500 or 1500 ms in a dot-probe-paradigm to participants with high vs. low blood-injury fear. With shorter picture exposure time, fearfuls showed fast reaction to probes following threat pictures, implying initial vigilance to the feared contents. With longer exposure time, the pattern was reversed and reactions were slower to probes following threat, indicating avoidance. Those patterns were also observed in social phobia (Amir, Foa, & Coles, 1998), specific phobia (e.g., Mogg & Bradley, 2006; Tolin, Lohr, Lee, & Sawchuk, 1999; Pflugshaupt et al., 2005) and spider fear (Hermans et al., 1999). However, contrary to Williams et al. (1997), the vigilance-avoidance concept allows no conclusions as to why numerous studies nonetheless have found memory biases in anxiety disorders.
I. INTRODUCTION
22
In Mathews & Mackintosh’s (1998) model it has been postulated that the threat value of stimuli – both pictorial and verbal – can be determined prior to awareness by a threat evaluation system (TES) very similar to Williams et al.’s (1997) affective decision mechanism. The TES of anxious individuals is proposed as more sensitive than that of non-anxious individuals. When this system senses threat, it directs attention to the according stimulus. Differences between high- and low-anxious individuals are ascribed to this early evaluative system. Thus, the model is consistent with studies reporting anxiety-related attentional biases and preattentive interference effects of threat, for instance in priming tasks. The authors equate their proposed early TES with LeDoux’s (1996) ”low-road”, which supposedly transfers threat information generated with prepared or fear-conditioned stimuli directly from the thalamus to the amygdala. Moreover, it is assumed that this system has evolved in favor of early threat detection before the development of language. In addition, Mathews and Mackintosh (1998) as well as LeDoux (1996) postulate a ”high-road” required for conscious processing of new threat stimuli. The authors propose the possibility of pre-attentive detection of threat values from verbal materials via the TES, conceptualized as a non-verbal system. On this point, the authors admit that while the meaning of a word was once consciously judged as threatening via the ”high-road” evaluation, a perceptual-pictorial match of this word is stored in the TES, allowing quick access to the threat value of the word in future via the ”low-road”. However, in explaining the inconsistent evidence for memory biases, the authors also suggest the importance of the type of encoding and retrieval of information. As it is postulated that the TES evolved prior to language, it is also assumed that threat information is not encoded there in verbally or conceptual accessible form, but in perceptual or pictorial form. Thus, this model predicts disorder-specific memory biases for tasks that emphasize perceptual encoding and retrieval such as implicit memory tasks or some explicit tasks, but not for memory tasks that require verbal or conceptual retrieval. As long as the task does not require a direct report, memory biases might be expected for both pictorial and verbal materials. However, as in previous models, this theoretical approach is not able to explicative integrate all empirical data, such as evidence for explicit memory biases in tasks requiring direct recall after conceptual learning (e.g., Kindt & Brosschot, 1998). Another hypothesis that tries to explain the basis of attentional biases, the EnhancedDwell-Time-Hypothesis (e.g., Fox & Georgiou, 2004; Fox et al., 2002; Georgiou, Bleakley, Hayward, Russo, Dutton, Eliti, & Fox, 2005), states that attentional biases are due less to a fast shift in attention to threat-related stimuli, but rather are caused by difficulty in disengagement of attentional resources from threat (see Posner and Peterson, 1990). In a modified version of the cueing paradigm (Posner, 1980), Fox and colleagues (e.g., Fox, Russo, Bowles, & Dutton, 2001; Fox et al., 2002) used positive, neutral, and threatening schematic faces, photograph faces, or words as cues that predicted the subsequent appearance of a target dot to the right or left of a fixation point. In valid trials, where a face
I. INTRODUCTION
23
appeared in the same box as the target, the authors found no group differences in the time required for reacting to a target. However, high anxious participants were clearly slower in detecting targets that appeared in an invalid location, when a threatening cue appeared in the opposite box. Thus, it indeed might be the case that attentional biases in anxiety rely on delays in the disengagement of attention from threat (see also Derryberry & Reed, 2002; Georgiou et al., 2005; Yiend & Mathews, 2001). This decelerated disengagement would imply that threatening stimuli are studied longer than non-threatening materials. Therefore, Fox & Georgiou (2004) also expect anxiety-related explicit memory biases for threatening materials. This is contrary to the conclusions of Williams et al. (1997) or Mogg & Bradley (1998) that anxiety disorders are not related to explicit threat-related memory biases, which is strongly supported by prior evidence (e.g., Amir et al., 2001; Mansell et al., 1999). However, most of these studies use free-recall tasks that require deep processing; it remains to be seen whether memory tasks associated with lower depth of processing might reveal memory biases (Russo et al., 2001). Indeed, Russo et al.’s (2001) high-trait anxious participants have shown threat-related memory bias for words processed at a perceptual level by counting syllables, but not for words processed at a deeper, conceptual level by judging their valence. This impressive finding clearly indicates the need for further memory research varying the levels of processing and, possibly, a modification of theoretical accounts that completely discount the existence of explicit memory biases in anxiety disorders. In summary, recent anxiety information processing models coherently assume disorderspecific attentional biases in anxiety, which are caused by an automatic attraction of attention by the threat value of a stimulus. While most theoretical approaches postulate a quick automatic shift of attention to threat as causal for attentional biases (e.g., Mathews & Mackintosh, 1998; Mogg & Bradley, 1998; Williams et al., 1997), the model of Fox (e.g., Fox & Georgiou, 2004) considers an enhanced dwell of attention on the threat item as relevant for the occurrence of attentional biases. With respect to memory biases in anxiety, most of the approaches outlined above emphasize the importance of the depth of elaboration of threatening materials for the occurrence of memory biases. The conceptualizations of Williams et al. (1997) and Mathews & Mackintosh (1998) both predict anxiety-related biases of memorization for elaborative processes that are automatic and non-conceptual. While Williams et al. (1997) exclude the existence of anxiety-related explicit memory biases (Williams et al., 1997), Fox & Georgiou (2004) suggest the possibility of finding explicit memory biases in anxiety, as long as the elaboration is perceptual, rather than conceptual. Mathews & Mackintosh (1998) do not exclude this possibility. In contrast, Mogg & Bradley’s (1998) model seems to dispute the existence of memory biases in anxiety at all. Thus, a wealth of prior research and theoretical frameworking has been done to shed light on the question how anxiety disorders and cognitive distortions are associated. There remains a great deal of inconsistency with respect to the specific predictions, especially those concerning mem-
I. INTRODUCTION
24
ory biases between these theoretical approaches; none has thus far been able to completely explain all empirical results. Limitations and Open Questions Imagine a spider phobic who has recently been terribly frightened by a spider quickly spinning from the ceiling to her bed or by a colleague who jokingly puts a spider in her cup. For several days, at least, the experience will make her exhaustively scan the ceiling before going to bed or scrutinize her drinking glass from a safe distance before touching it. It seems contradictory to expect that a phobic avoids the memorization of a feared situation. Rather, it seems very likely that the person remembers explicitly. It is unimaginable that the memory would not be of any further relevance. It is favorable for survival to keep painful or threatening experiences in mind to allow adaptation of behavior. Imagine a spider phobic with whom you are talking at a party has detected a big, unhandsome spider. Do you think she can follow the conversation with the same enthusiasm as she did before the appearance of the spider? Although politely looking at you, she surely knows exactly where the spider was in the last moment she attended to it, she is surely able to tell if it has moved two inches since she last inspected it. The two examples outlined above demonstrate to assume a totally neutral role of explicit memory in anxiety is illogical. Does not selective attention presuppose a memory component, as learned danger signals (e.g., Mathews & Mackintosh, 1998; Williams et al., 1997) are activated to orientate attention? However, as outlined in the prior sections, empirical evidence does not precisely reflect our amateur impression of the relevance of memory in anxiety. Considering the empirical and theoretical approaches described previously, several questions remain that might be important for determining whether anxiety is associated with memory biases or not, and whether the occurrence of memory biases is related to some preconditions. Type of presented materials First, it is surprising that most studies use verbal materials as experimental stimuli. This might be traceable in generalized anxiety disorder where worries play an important role, but imagine the spider phobic that enters a room and detects a real spider, vs. the photograph of a spider, vs. the written word ”spider” on the wall. Although there indeed are patients who are not even able to read spider-related words without experiencing anxiety symptoms, these severe cases of spider phobia are rather rare. Even so, most patients in cognitive-behavioral exposure therapy report that pictures of spiders are more threatening than verbal material. It is also experimentally confirmed that pictures are more likely to elicit phobic anxiety than words (e.g., Kindt & Brosschot, 1997). Moreover, it is broadly hypothesized that the disorder-specific vigilance to threat in anxiety disorders works via the ”low road” of
I. INTRODUCTION
25
information processing, transferring incoming information directly from the thalamus to the amygdala ensuring quick, adaptive reactions (e.g., LeDoux, 1996; Mathews & Mackintosh, 1998; Oehman, 1993). It is further postulated that this channel evolved long before language development (e.g., LeDoux, 1996). If this assumption is true, pictorial materials should be more suitable for investigating this pathway and in determining anxiety-related biases. Indeed, negative emotion seems to be associated with activity in the right hemisphere (Bowers, Bauer, Coslett, & Heilman, 1985; Hellige, 1993) and regions of prefrontal cortex (Davidson, 1992), respectively, which are postulated as being relevant for nonverbal working memory (Smith et al., 1996). Possibly negative emotion has more impact on nonverbal memory. Evidence was first reported by Gray (2001), who observed that negative mood state impaired verbal working memory and enhanced spatial working memory. Other studies using picture stimuli for researching anxiety-linked biases are also promising (e.g., Lundh & Oest, 1996; Lundh et al., 1998; Radomsky & Rachman, 1999). Type of required encoding and visual working memory Additionally, all cognitive-theoretical approaches of anxiety described above postulate that memory biases should not occur in every circumstance. Williams et al. (1997) suggest that anxiety-related memory biases are measurable only when implicit memory is tested, as it requires perceptual, rather than semantic elaboration, and anxious individuals should avoid the latter. However, there is also empirical evidence for explicit memory biases in tests requiring coarse perceptual rather than deep semantic encoding (see Craik & Lockhart, 1972). For instance, Russo et al. (2001) found explicit memory biases for words that were perceptually encoded. Also Wilhelm and colleagues (Wilhelm, McNally, Baer, & Florin, 1996) detected explicit disorder-specific recall biases. He presented neutral, positive and threat-related words to obsessive compulsive disordered patients and to non-anxious controls. Subsequent to the presentation of a word during the study phase, participants were instructed to either memorize or forget the previous word. Thus, as in Russo et al.’s study (2001), this task allowed but did not necessarily require semantic elaboration of the ”forget”-words. Nevertheless, in contrast to the absence of group differences in the ”remember”-condition, anxious participants recalled negative words they were instructed to forget significantly better, implying that they were, compared to the control group, not able to do so. In addition, it seems Mogg et al. (2004) disclaim any form of memory biases, as they observed slower reaction times to probes replacing a threatening scene presented for 1500 ms compared to a faster reaction when negative scenes were displayed for only 500 ms. However, aside from this hypothesis not being able to explain why some studies do find memory biases (e.g., Constans et al., 1995; Lundh & Oest, 1996), the authors themselves did not find an avoidance pattern in a pictorial visual dot-probe task in specific phobia (Mogg & Bradley, 2006).
I. INTRODUCTION
26
There seem to be two important gaps in bias research: further research is needed to clarify whether explicit memory biases can occur in anxiety as long as the required elaboration is perceptual or non-memorial (see Johnson & Hirst, 1993; Williams et al., 1997) rather than conceptual; we do not know anything about visual working memory biases in anxiety. Studies investigating anxiety-linked attentional biases merely require detection of and immediate reaction to a threatening stimulus, they don’t demand any deeper encoding process and studies investigating memory mostly test for word lists after several minutes. This method assessing memory undoubtedly emphasizes strategic memorizing and retrieval. That is, we have detailed investigations of the moment a spider phobic detects a spider on the wall and of the moment when the spider has been removed for several minutes. But we do not know what happens in the meantime, although it sounds adaptive for a spider phobic to monitor the movements of a spider. A spider fearful does not need to elaborate their representation of a spider so intensely that he or she could distinguish one from the other. They are interested in keeping in mind where it is located and being able to judge whether and how fast it has moved. This requires the involvement of visuo-spatial working memory, and this memory representation is explicit. This would contradict Williams et al.’s (1997) and Mogg & Bradley’s (1998) concept of avoidance. However, where does that avoidance of elaboration – if it exists at all - start? Within working memory? Beyond it? Surprisingly, none of the cognitive models of anxiety provide any predictions regarding working memory. When the feared stimulus is attended quickly, is it also more securely kept in working memory? We would expect this, as working memory is directly influenced by attention, and attentional biases for threat have been confirmed rigorously. In addition to the lack of theoretical concepts concerning working memory in anxiety, so far no single study has explicitly addressed working memory biases by comparing immediate memory for threat in a group of anxiety patients compared to a group of non-anxious controls. Only a few studies have focused on the investigation of general selective effects of emotion on short-term memory, but there are promising hints that emotionality of an item influences its encoding and storage in working memory. As one exception, Kensinger & Corkin (2003) failed to find higher working memory accuracy for emotional stimuli in an unselected sample in a self-ordered pointing task. Their participants viewed a set of 15 slides in each block each including the same 15 pictures of same valence in random order. Observers were required to point at one picture in each of the 15 trials without selecting any picture twice. The authors measured the number of errors within a block of 15 slides, that is, how often the participants chose an image that had already been selected. Performance was unaffected by emotional content, implying that emotionality of materials has no influence on their storage in working memory. Obviously, the task presented by the authors involves some methodological problems which might be responsible for the failure to find selective effects of emotion. First, the task encourages verbal encoding,
I. INTRODUCTION
27
as verbal memory is not loaded by an additional task and presentations leave enough time for verbal labeling of stimuli. Potentially existing prioritization effects for visual negative information on short-term memory might be superposed by the influence of verbal memory. An investigation is needed to disentangle the effects of negative information on verbal vs. visual working memory. Second, although presented slides included several pictures, all pictures had the same valence. From attention bias research it is known that the simultaneous presentation of emotional stimuli and neutral stimuli competing for attention is a prerequisite for attentional biases to occur (e.g., Mathews & Mackintosh, 1998; Rinck et al., 2005; Williams et al., 1997). For observers it is irrelevant whether they can differentiate a yellow snake from an orange snake, but to separate a knot from a snake is necessary for adaptive behavior. Possibly, the same is true in visual working memory biases, as attention is prerequisite for storage of stimuli in working memory (e.g., Cowan, 1995). Future research on working memory should consider the result from attentional bias research and present negative and neutral materials in spatial or temporal competing situations. In another study addressing short-term memory for scenes with affective content, Maljkovic & Martini (2005) presented numerous real scenes with neutral, positive or negative emotional content, randomly mixed in a rapid serial visual presentation procedure, with varying picture exposure times. Directly after the presentation phase of each trial, picture recognition was tested. Old and new scenes were presented, and observers had to indicate whether they had seen the picture earlier or not. Compared to neutral and positive pictures, images with negative valence were not as well remembered in the very short exposure conditions (e.g., 13 ms), but then inreasingly better recalled than other pictures at 500 ms exposure. The authors concluded from these results that valence indeed does modulate short-term memory. Negative images are initially encoded more slowly but also more carefully, leading to better memory for these pictures with exposure times of up to 500 ms. Similarly, Anderson (2005) and Keil and Ihssen (2004) demonstrated a preferential selection of aversive stimuli (e.g., the word ’danger’ among neutral words) with an attentional blink paradigm. Participants were asked to report two green-colored target words from the string of otherwise white-printed distractors in a rapid serial visual presentation. With shorter distance between targets, the accuracy in reporting the second was reduced, which is the Attentional Blink phenomenon. Enhancement in the reporting probability of the second target, that is, a reduction of the Attentional Blink, was observed for emotionally salient words. Thus, several studies suggest that emotional materials may be preferably selected to enter working memory.
I. INTRODUCTION
28
Nevertheless, no study has thus far investigated visual working memory biases in clinical-relevant anxiety disorders, though several studies have applied a change detection paradigm (see, for instance, Luck & Vogel, 1997) to clinically relevant participant groups. For instance, Jones, Jones, Smith, and Copley (2003) investigated information processing biases in alcohol and cannabis users by comparing the detection speed of changes applied to scene objects in users vs. non-users in a flicker paradigm. This paradigm implies that a real-world scene including neutral and substance-related objects alternates, where either the neutral or the substance-related item changes forth and back. The authors report faster detection of substance-related changes in users. Similar results are reported for spider phobics (Mayer, Muris, Vogel, Nojoredjo, & Merckelbach, 2005). However, both studies address attentional biases, as participants were allowed to guide their attention through the visual scene as long as necessary to detect a change. In contrast, a change detection task in terms of Luck and Vogel (1997) as described above involves no flickering of scenes, as study and test display are only presented once. Thus, this paradigm requires increased storage and short-term retention of as many scene details as possible into working memory for comparison with a later scene in order to make a decision whether a change had occured. Would we also find preference for threat within such a paradigm? In summary, many studies have addressed the two extremes of processing threatening information in anxiety disorders: attention as our direct contact with the outside world and longer-term memory as the longer-lasting storage of internal representations of the external world. There is wide agreement regarding attentional biases, but less coherence regarding memory biases. Surprisingly, however, very little is known about the processing of emotional stimuli at the link between attention and long-term memory, namely, visual working memory. Type of attentional stage Moreover, research has left the question as to which attentional stage biases occur unsatisfactory answered. While earlier studies explained attentional biases as based on a fast shift of attention to the threatening materials, research by Fox et al. (2001, 2002) suggested that it might be a distortion in the ability to disengage attention from threat items that causes bias patterns. Moreover, Fox and colleagues emphasized that such a prolonged disengagement should result in better memory for these stimuli. However, although Fox and colleagues criticized earlier paradigms for not being able to separately investigate the engagement and disengagement component of attention (see Posner & Peterson, 1990), their own paradigm failed in providing that improvement. As all newly displayed stimuli – independently of their valence – quickly catch attention, very short reaction times were observed in all valence conditions, leading to possible floor effects in the valid trial condition. Therefore, the authors were able to identify slower disengagement from threatening faces, but they were unable
I. INTRODUCTION
29
to conclusively clarify the role of accelerated engagement. Mathews et al. (2003) tested another paradigm which aimed at investigating both the engagement and disengagement of attention to and from threat in parallel. They centrally presented a fearful face and varied its gaze direction, which was directed to the left or the right, and displayed probes on either side. A quicker detection of probes in gaze direction was interpreted as fast engagement to threat, a slowed detection of probes at the opposite side was taken as an indication for slowed disengagement of attention from the threat locus. However, as there was actually no threat visible, this paradigm might not be sufficient to unequivocally translate the results into attention for ”real” threat. Further paradigms including the presentation of real threat and allowing the simultaneous measurement of engagement and disengagement of attention are required. One might argue that eye movement research should be the most suitable and detailed method to clarify this issue. However, an eye movement to a specific location within the visual field does not guarantee attention to that position at the same time. That is, when the eye tracking system registers a quick eye movement to a feared stimulus, but only a short fixation duration (e.g., Hermans et al., 1999), it does not necessarily imply that the threat stimulus is totally out of the observers’ consideration. Behavioral paradigms such as that presented by Wolfe et al. (2006) assessing covert attention might provide a worthwhile expansion of the current knowledge concerning engagement vs. disengagement of attention to and from threat and the influence of these attentional processes on VWM for these items. In sum, we need more research using real pictorial stimulus materials instead of verbal materials, as these might elicit more anxiety and, thus, lead to stronger differences between anxious and healthy participants in memory tasks. Future research on memory biases has to carefully consider and manipulate the type of encoding, as the occurrence of anxietyrelated memory biases might be linked to a specific processing depth, which is suggested by previous empirical studies (e.g., Russo et al., 2001; Wilhelm et al., 1996) and cognitivetheoretical approaches of anxiety (e.g., Williams et al., 1997). First and foremost, however, current research contains a gap that remains uninvestigated: visual working memory. This is especially surprising against the background of very inconsistent data concerning memory in anxiety, and in view of the theoretical approaches emphasizing the need for future research which varies more strongly the type of encoding to shed light on the prerequisites for finding anxiety-associated memory biases.
The Objectives of this work As outlined at the beginning of this chapter, specific phobias belong to the most common mental disorders (e.g., Kendler et al., 1992; Kessler et al., 1994), have a chronic course without treatment (e.g, Wittchen et al., 1991) and often result in the onset of additional, comorbid mental disorders (e.g., Kessler et al., 1994; Wittchen & Vossen, 1996). Therefore,
I. INTRODUCTION
30
the interest in valid models of psychogenesis drawing conclusions about effective therapeutic interventions is high. One group of these models of anxiety are the cognitive approaches, which assume threat-specific distortions of information-processing as relevant in the etiology and maintenance of anxiety disorders (e.g., Fox et al., 2002; Mathews & Mackintosh, 1998; Williams et al., 1997). The currently influential models coherently suggest attentional biases in anxiety disorders, which are widely confirmed by experimental studies (for a review, see Mathews & MacLeod, 2005). In contrast, these models vary strongly with respect to their memory bias predictions as outlined earlier, but none convincingly integrates the state of the empirical data on memory biases in anxiety. Thus both empirical data and theoretical approaches lack any satisfying coherency. Remarkably, both empiricism and theory possess a so far completely unattended gap; in light of these discrepancies, it is all the more surprising that no single study has addressed visual working memory biases in anxiety, and that none of the models outlined earlier involves clear predictions concerning this process. Most of the cognitive models described above assume that the type of encoding is relevant for the occurrence of memory biases in anxiety, and predict memory biases when elaboration is not too extensive, because deeper elaboration is avoided in anxiety. Does this avoidance take place in visual working memory? VWM tasks such as those introduced by Wolfe et al. (2006), Luck & Vogel (1997), or Shapiro et al. (1994) do not allow for verbal strategies and merely require pictorial-perceptual encoding. If we presented threatening stimuli within such tasks to anxious participants, would we find deviations from the general working memory laws found for neutral materials as outlined above? The aim of the presented dissertation is to shed light on the missing link in the research on cognitive biases in specific anxiety - visual working memory. In the review of attention and working memory concepts in section 2 of this introduction it was outlined how VWM is closely linked to attention and thus includes the last attended stimuli from the external world (e.g., Wolfe et al., 2006). It can hold about 4 of these items (e.g., Luck & Vogel, 1997), and stimuli of highest relevance are preferrably stored (e.g., Cowan, 1995; Schneider, 1999). VWM encoding is restricted to about one object at one moment, as it requires attention (e.g., Chun & Potter, 1995). As evidence for anxiety-associated attentional biases is so strong and as attention and working memory are so closely linked, we might expect the occurrence of VWM biases for threat. Or does the widely assumed avoidance of elaboration (e.g., Williams et al., 1997) begin in working memory? As outlined, VWM is not only linked to attention but also involves the short-term retention of content and location information of visual stimuli. Thus, the investigation of VWM in anxiety might exceed the already existing knowledge about threat-related attention. For phobics, it seems logical that they will monitor movements and other changes of a relevant phobic stimulus, even when they
I. INTRODUCTION
31
are otherwise required to attend other stimuli. Therefore, disorder-specific VWM biases would be adaptive. Do phobics indeed keep VWM storage capacity ready for threat more than non-anxious individuals? In eight experiments, this dissertation addressed the following main research questions: • Given the well evidenced postulations that VWM holds the last attended items of most relevance (e.g., Cowan, 1999) and that threat is attended with priority (e.g., Williams et al., 1997) – is threat also preferrably stored in VWM? Or is VWM memory reduced for threatening items, confirming cognitive theories of anxiety assuming a quick avoidance of threat (e.g., Mogg & Bradley, 1998)? • As VWM is only capable of holding about 4 items (e.g., Luck & Vogel, 1997) – does any threat preference occur at the expense of storage for other items, or is extra storage capacity provided? • As it is assumed that VWM encoding is supposed to be a serial, slow process addressing only one object at one moment (e.g., Chun & Potter, 1995) – would the appearance of threat cause interruptions in ongoing encoding processes for non-threatening items? • Does the encoding of threat occur strategically or automatically, that is, controlled by the phobic individual or in a reflexive, stimulus-driven manner? • If disorder-specific VWM bias do occur, are these material-specifically observable only with the feared stimuli or all kind of negative materials? • If any VWM biases can be determined – are these modfiable through cognitivebehavioral therapy that aims at reducing the threat value of feared stimuli? Paper 1 – A first investigation of VWM biases in anxiety with Wolfe’s cueing paradigm (Wolfe et al., 2006) In this paper, the paradigm introduced by Wolfe et al. (2006) as outlined in section 2 was adapted to real-object stimuli of varying valence. Following the authors, the applied rapid cueing procedure allowed the external sequential guidance of attention to specific stimuli within the visual field and the measurement of immediate visuo-spatial memory for these items. In addition, the rapid guidance of attention assured the exclusion of verbal memory. Thus, this task allowed no deep verbal or conceptual elaboration instead emphasizing perceptual-pictorial storage of contents. Following the cognitive-theoretical approaches of Mathews & Mackintosh (1998) or Fox et al. (2002), anxiety-related memory biases for threat might occur when using valenced stimuli, although explicit retrieval is required, as long as the encoding is perceptual. Following Williams et al. (1997) or Mogg et al. (2004),
I. INTRODUCTION
32
no biases should occur when retrieval is explicit. Paper 1 is a first attempt to test whether phobic anxiety is associated with VWM biases in a task that is characterized by perceptual encoding but explicit retrieval. Wolfe et al. (2006) found strong serial position effects reflected in good VWM for the color of the two most recently attended dots and decreasing memory for earlier cued items. Memory for uncued items was very low. Similar results were observed with real-object stimuli. If the paradigm was adapted to real-object stimuli involving one spider and presented to spider fearfuls vs. non-anxious controls, would we observe alterations of the serial position and cueing effects described by Wolfe and colleagues? If so, would we observe group differences in the report accuracy of spiders? In the present experiment, a subset of real-object display items was successively cued in each trial by a sudden change of the picture background for 150 ms each (see Figure I.5). After the cueing, one of the display pictures was hidden and probed for a memory test. In most trials, a cued item was tested, and memory accuracy was determined dependant upon the item’s position within the cue string and its valence. In some cases, memory for an uncued item was tested. There were trials with a spider presented among the cued items, but the spider could also be one of the uncued items or not displayed at all.
CUEING PROCEDURE SOA = 150 ms
TEST PROCEDURE What item was it? it?
Figure I.5: Depiction of the experimental task presented in Papers 1 to 3 of this dissertation, basing on the paradigm reported by Wolfe et al. (2006). After subsequently cueing five display images, one display image is hidden and probed for report.
Addressed research questions: This research was directed at discovering whether spider fearfuls and non-anxious controls would differ with respect to the accuracy in memorizing cued spiders or uncued spiders and, thus, reveal disorder-specifc biases of VWM. Is the retrieval of spider images bound to the same serial position effects that were observed for neutral materials (see Wolfe et al., 2006), implying decreased memory for earlier stored
I. INTRODUCTION
33
items? In addition, the question as to whether the presence of the spider image is related to costs for the memorization of other images was tested: does the presence of an uncued spider negatively influence memory for cued images; does the cueing of a spider image influence memory for the item following it? Answering the latter would shed more light on the question whether attentional biases occur due to slowed disengagement of attention from threat. Paper 2 – The relevance of 500 ms free viewing time before the cueing procedure and materials-specifity of the obsvered effects The experiment presented in Paper 1 was a replication of the paradigm described by Wolfe et al. (2006). Therefore, there was an initial orientation time of 500 ms in each trial before the cueing started. It is unclear which processes take place during this time. Moreover, the results of Paper 1 left unclear whether any observed disorder-specific effects were also materials-specific. Experiment 1 of Paper 2 was nearly identical to the experiment applied in Paper 1, and was presented to spider fearfuls vs. non-anxious controls. The initial orientation time before the beginning of the cueing was reduced to 150 ms. Experiment 2 was nearly identical to Experiment 1, but the critical stimulus here was a snake instead of a spider. Participants were spider fearfuls and non-anxious controls, both without snake anxiety. Addressed research questions: Paper 2 tested whether the preferential encoding of uncued spider images by spider fearfuls and the lack of group differences in the report probability of cued spider images observed in Paper 1 trace back to uncontrolled processing during the 500 ms initial orientation time in one of the groups. Additionally, it was investigated whether spider fearfuls show a memory advantage for any threatening image, or whether this advantage was disorder- and materials-specific. Paper 3 – The malleability of disorder-specific VWM biases through cognitive-behavioral intervention The study described in Paper 3 was run to test whether any disorder-specific cognitive biases found in the earlier experiments of this dissertation were modifiable through cognitive-behavioral treatment. Results would shed more light on the question of which role disorder-specific distortions play into the pathogenesis of the disorder. Recent studies addressing the modifiability of anxiety-related cognitive biases were unable to determine clear evidence for changes of cognitive biases through therapy. This seems contrary to studies even suggesting a malleability of neural and neurochemical correlates of specific phobia (e.g., Gaab, Jucker, Staub, & Ehlert, 2005; Straube, Glauer, Dilger, Mentzel, & Miltner, 2006). Thus, the study described in Paper 3 purposed the circumvention of possible
I. INTRODUCTION
34
methodological limitations of previous research on the malleability of cognitive biases, which is discussed in more detail in Chapter 4. The experimental task was exactly the same as in Experiment 1 of Paper 2. Spider fearfuls were tested three times. Half received a cognitive-behavioral intervention after the first test, the other half only after the second test. Addressed research questions: Is successful cognitive-behavioral treatment of a spider anxiety associated with a reduction of the prioritization of cued spider images compared to cued non-spider images? Does the intervention influence the disorder-specific memory advantage for uncued spider images?
Paper 4 – Do disorder-specific VWM biases trace back to automatic or strategic processing? The main aim of this paper was to clarify whether any disorder-specific effects found in the previous papers were associated with automatic or with strategic selective encoding of threatening materials. The visual-working memory task from Luck and Vogel (1997) was adapted to real-object stimuli including one spider. In Experiment 1 of Paper 4, numerous images were presented simultaneously in a study display for either 100 or 500 milliseconds. After a short interruption, a test display was presented including either the same items as the first one or one changed item. Participants’ accuracy in determining whether displays were the same or different was measured dependent on the valence of the changed item, set size, and presentation time of the display. There were trials with and without any spiders. If a change was made, it could involve either a non-spider or a spider item.
STUDY DISPLAY 100 ms vs. 500 ms
WHOLEWHOLE-TEST DISPLAY same or different?
Figure I.6: The experimental task described in Paper 4, which is an adaption of the paradigm presented by Luck and Vogel (1997) to real stimuli. Participants decide whether two shortly presented stimuli displays were same or different.
I. INTRODUCTION
35
Of specific interest was the condition in which a spider image was presented initially, but not in the test phase, as noticing this specific change would require storage of that image in VWM. Experiment 2 addressed the materials-specificity of any group differences to spiders, but not to snakes. Thus, change detection accuracy for spiders vs. snakes was tested. The participants in both experiments were spider fearfuls vs. controls, but those of Experiment 2 were additionally required to lack snake anxiety. Addressed research questions: Would we observe differences in detecting changes applied to threatening vs. non-threatening images? Would this difference be especially pronounced in spider fearfuls? Would the two groups differ in detecting the disappearance of spider images, reflecting a VWM bias? Would group differences be particularly pronounced in the shorter encoding condition suggesting automatic encoding of threat, or would they occur in the longer encoding condition, suggesting strategic encoding of spiders? Would any of these effects be specific to spiders, but not for snakes? Paper 5 – Does the appearance of threat interrupt the VWM encoding of currently processed non-threatening items? A temporal visual working memory paradigm – an Attentional Blink task - was applied to assess whether a bias for increased encoding of spider images in spider fearfuls would occur at the expense of non-threatening items undergoing concurrent processing. Previous work on the Attentional Blink suggests that when a second target appears during the serial-working encoding process of an initial item into VWM, it is reported with reduced probability (e.g., Shapiro et al., 1994). Is processing of the first target interrupted when the second target depicts a threatening object? In Experiment 1, series of real-object pictures were presented at rates of 80 ms at the display center (see Figure I.7). The observer’s task was to identify and report the two target pictures indicated by a brighter background. The first target always depicted a neutral item; the valence of the second target was varied either negative depicting a spider, positive, or neutral. Participants varied with respect to their spider anxiety. In Experiment 2, spider fearfuls and non-anxious controls, both without snake anxiety, were tested. The experiment was nearly the same as the first one, but two negative target types were tested: disorder-relevant spiders and negative but not feared snakes. Addressed research questions: Is the magnitude of the attentional blink phenomenon reduced with spider targets in spider fearfuls, indicating lower encoding costs for spiders? Does the appearance of a spider target impair the memory for the first target, indicating preferred encoding of disorder-specific materials at the cost of items already entered in the attentional bottleneck? Would disorder-specific threat-preference effects also occur with the unfeared snakes?
I. INTRODUCTION
36
PRESENTATION PROCEDURE What were the both targets? targets?
…
Figure I.7: The Attentional Blink task applied in Paper 5 of this dissertation. Fifteen pictures are successively presented for 80 ms each. Participants have to report the two targets indicated by a brighter background.
Paper 6 – Validity and reliability of three snake anxiety questionnaires The study described in Paper 6 took place in parallel to the research described above and involved the determination of validity and reliability of two questionnaires translated from English, the Snake Anxiety Questionnaire (SNAQ, Klorman, Hastings, Weerts, Melamed, & Lang, 1974) and the Aspects of Snake Anxiety Questionnaire (Suedfeld & Hare, 1977). In addition, psychometric properties of a self-developed short-screening assessing snake anxiety were assessed. This research became necessary as there were no tested German instruments for quantifying snake anxiety available at the beginning of the presented research, but which were required for the efficient screening of participants for our experimental studies.
II. Paper 1: Spiders crawl easily through the bottleneck: Visual working memory for negative stimuli
Abstract The special status of spiders in the attentional bottleneck and visual working memory (VWM) was studied. 23 spider-fearfuls (SF) and 23 non-anxious controls (NACs) participated in a serial VWM-task. Each trial showed a 4x4 matrix of images, and 5 of these were subsequently cued for 150 ms each. Afterwards, one of the 16 displayed images was hidden and probed. The spider image was included in the string of 5 cued images, among the 11 uncued items, or not at all. For both groups, memory was better for cued spiders than for other cued items. SFs also showed improved memory for uncued spiders. The relevance of the results for theories of attention and cognitive models of phobias are discussed. Introduction Numerous experimental investigations suggest that humans consciously perceive only a fraction of the amount of information they believe to see at any single moment. For instance, experimental participants observing videotapes failed to notice the identity changes applied to a main figure (Simons & Levin, 1998) or the appearance of a gorilla in a ball playing scene (Simons & Chabris, 1999). Similar failures occurred when observers were working on a computer task, for instance comparing the length of two line segments. When they were not told that another, task-irrelevant stimulus would shortly appear, about 25% of them failed to even perceive something unusual (Mack & Rock, 1998a; Mack & Rock, 1998b). Wolfe, Reinecke, and Brawn (2006) have argued that these failures are due to the existence of two bottlenecks within the visual processing system: the attentional bottleneck and visual working memory. First, the attentional bottleneck is necessary to selectively attend to an object in order to fully identify and recognize it . Remarkably, the attentional bottleneck seems to limit detailed processing to only a few, maybe even only a single, object at any moment in time (Baylis & Driver, 1995a, 1995b; Tipper & Weaver, 1996). Second, visual working memory (VWM) is thought to hold the items most recently attended to (e.g.
37
II. PAPER 1
38
Hollingworth & Henderson, 2002) for several seconds, and it is limited to 3 or 4 items (Irwin, 1991; Irwin & Andrews, 1996; Luck & Vogel, 1997; Wheeler & Treisman, 2002). In seven experiments, Wolfe et al. (2006) explored observers’ memory for simple and complex scenes, and the results supported the two-bottleneck hypothesis. In one experiment, attention and the input to visual working memory was guided and controlled by a cueing procedure: First, a 4x5 matrix of 20 items (i.e., colored squares) was displayed. Several items (e.g., 6 of the 20 items) contained in the matrix were then cued one after another. For each item, cueing was achieved by a sudden increase in luminance and size for 50, 150, or 300 ms. Subsequently, a single item was hidden by a gray square. Participants had to report the color of the hidden square. With this partial-report technique, the authors measured accuracy as a function of the serial position of the probed item within the cued string of items. Observers could reliably report only the one or two items that had been attended to most recently, and, therefore, had passed the attentional bottleneck. With increasing ”age” in visual working memory, accuracy decreased dramatically, such that items cued earlier in the string could not be reported well. Estimations of the capacity of visual working memory revealed a storage limitation to less than four items 1 . A similar pattern was reported by Irwin and Zelinsky (2002), suggesting generality of the effect. The results described so far only relate to neutral stimuli, and none of the reported studies addressed the processing of emotionally relevant stimuli. This is regrettable because there is reason to suspect that emotional stimuli may be processed differently in the attentional bottleneck and in visual working memory. Indeed, many studies have shown an attentional bias for emotional, particularly threatening, stimuli (e.g., Byrne & Eysenck, 1995). This bias suggests that threatening materials may be preferably selected to pass the attentional bottleneck and be remained in VWM. It is unclear, however, what exactly the nature of this selection is: Does it occur at the expense of other items within the visual field, or does it happen in some parallel form? And how are negative stimuli stored in visual working memory? Are negative stimuli saved preferentially, compared to non-negative materials? And are these processing biases stronger in or even restricted to individuals who suffer from phobic fear of the negative object? The latter question is particularly relevant here because many studies have shown disorder-specific cognitive biases in anxiety disorders, in contrast to non-anxious control participants. Cognitive theories of anxiety postulate that biased cognitive processes play a dominant role in the etiology and maintenance of anxiety disorders (e.g., Beck, Emery, 1
Wolfe et al. (2006) estimated the capacity of visual working memory by making the following assumption for each position of the cue string: (a) Accuracy = P(remembering the item) + (1-P(remembering)) x Empirical chance level, and (b) P(remembering) = capacity / string length. Solving for capacity leads to the formula: Capacity = Sum of [(Acc-Ch)/(1-Ch)] for all items of the cue string, where ”Acc” is the accuracy for each item in the list and ”Ch” is the empirical chance level.
II. PAPER 1
39
& Greenberg, 1985; Clark & Wells, 1995; Mogg & Bradley, 1998; Williams, Watts, MacLeod, & Mathews, 1997). According to these theories, anxiety disorders often involve disorder-specific, selective biases of attention and memory. The specific nature of these biases depends on the anxiety disorder under study (for a review, see Mathews & MacLeod, 2005). With regard to attentional processes in specific phobia, there is evidence that phobic individuals show enhanced detection of threat-related stimuli, greater distractibility by them, and aggravated disengagement of attention from them. For instance, spider phobics should be particularly good at detecting spiders, they should be easily distracted by spiders when trying to concentrate on other stimuli, and they should find it hard to disengage attention from spiders. Indeed, evidence for anxiety-related attentional biases has been provided by a large number of empirical studies employing a variety of experimental tasks (for reviews, see Mathews & MacLeod, 2005; Rinck & Becker, 2005; or Williams et al., 1997). Compared to attention, the empirical basis for phobia-related memory biases is less coherent, and many researchers failed to find disorder-specific memory biases in specific phobias (for reviews, see Becker, Roth, Andrich, & Margraf, 1999; Coles & Heimberg, 2002; Williams et al., 1997). In part, this may be explained by the finding that phobic patients avoid elaborating on threatening materials after they have shown an attentional bias to it (the vigilance-avoidance pattern of attention, e.g., Mogg, Bradley, Miles, & Dixon, 2004; Rinck & Becker, in press). To summarize, many studies have addressed the two ”extremes” of processing negative information: attention as our direct contact with the outside world, and long-term memory as the longer-lasting storage of internal representations of the external world. There is wide agreement regarding attentional biases, but less coherence regarding memory biases. Surprisingly, however, very little is known about the processing of emotional stimuli at the link between attention and long-term memory, namely, the attentional bottleneck and visual working memory. Following Baddeley & Hitch (1974) and Baddeley (1992), working memory (WM) is a capacity-limited system retaining information for a few seconds. Within WM, verbal and visual information can be stored in parallel within the phonological loop and the visuo-spatial sketchpad, respectively. Moreover, the authors assume selective attention to stimuli as a prerequisite for their being selected into working memory. As there is convincing evidence that emotional stimuli draw attention (see above), they should also be more likely to be processed in working memory. Unfortunately, only a few studies focused on the investigation of selective effects of emotion on the attentional bottleneck and short-term memory. On the one hand, Kensinger & Corkin (2003) failed to find higher working memory accuracy for emotional stimuli. This negative finding is compromised, however, by the fact that the emotional stimuli did not compete for attention with neutral stimuli presented simultaneously, a prerequisite for attentional biases to occur (Mathews & Mackintosh, 1998; Rinck & Becker, in press; Rinck et al., 2005). In contrast, Maljkovic & Martini (2005) revealed in a picture recognition task with varying encoding times that
II. PAPER 1
40
compared to neutral and positive pictures, images with negative valence are initially encoded more slowly but then increasingly faster within 500 ms. Similarly, Anderson and Phelps (2001) demonstrated a preferential selection of aversive stimuli (e.g., the word ”rape” among neutral words) with an attentional blink paradigm. Their results suggest that threatening materials may be preferably selected to enter the attentional bottleneck, maybe even by the appropriation of additional resources. Studying the bottlenecks between attention and memory in anxiety disorders may also shed some light on the conflicting results regarding memory biases in phobias. However, investigation of the bottlenecks requires a paradigm that addresses solely immediate memory for external stimuli. For this purpose, the visual working memory paradigm used by Wolfe et al. (2006) seems advantageous in several ways. First, it may employ pictures rather than words as ecologically relevant threat stimuli for participants suffering from animal phobias. Second, it specifically addresses visual storage of information, reducing the effect of verbal information on the attentional bottleneck. Third, the rapid serial presentation technique allows external guidance of attention, and by testing VWM contents directly after presentation, we may conclude which items passed the attentional bottleneck. Moreover, the serial presentation technique allows for measuring the effect of a negative item on the memorization of the items preceding and following it. Therefore, the experiment reported here used a serial visual working memory task that was very similar to the one used by Wolfe et al. (2006). The new feature introduced here was the inclusion of a negative stimulus. On every trial, 16 pictures were displayed simultaneously. Five out of the 16 pictures were cued one after another (yielding a ”cue string” of five items) and, thereby, loaded into working memory. Directly afterwards, one of the 16 displayed items was hidden. The observer’s task was to report the prior identity of the hidden target picture. We measured memory accuracy as a function of the position of the target object within the cue string. Different from Wolfe et al. (2006), we added a variation of image valence: In most of the trials, a single spider image was contained in the display. This negative object was either one of the five objects within the cue string or one of the eleven objects beyond the cue string. Furthermore, the spider image was the tested target object or another object was tested. Also unlike Wolfe et al. (2006), we tested two extreme groups of participants: highly spider fearfuls versus non-anxious controls. The experimental task requires participants to maintain information in memory and to retrieve it at the end of each trial, but they do not have to elaborate on it. In fact, we may assume that the high cueing frequency does not allow for strategic processes such as verbalization or elaboration, thereby equating encoding conditions for all participants. We therefore predict that this memory task should be suitable for revealing enhanced immediate memory for negative materials in fearful participants. As the theoretical and empirical background regarding
II. PAPER 1
41
disorder-specific biases in visual working memory in spider phobia is very sparse, it is not easy to derive explicit hypotheses regarding participants’ performance in this task. However, Baddeley (1992) proposes attention as a prerequisite for the storage of information in working memory, and as attentional biases to negative material were found in specific phobia, the results found in studies of attentional biases may be extended to visual working memory. Thus, we predict the following results: (1) Spider images should be remembered better than non-negative images. (2) Spider images should be remembered well, independently of their position within visual working memory. (3) A spider picture should cause retroactive interference for items preceding it in the cue string and proactive interference for items following it. (4) Spider images should be accurately remembered, even when their memorization is not demanded by the task, that is, when a spider image was presented, but not part of the cued string of items. (5) The presence of a spider beyond the cued string should lead to lower memory accuracy to the cued non-spider items. (6) These effects should be disorder-specific, that is, they should occur mainly or even exclusively in the spider fearful group.
Methods Participants Twenty-three spider fearfuls (SFs) and 23 non-anxious controls (NACs) without any animal oriented fears participated in the experiment. Potential participants were recruited after screenings in classes at several departments of Dresden University of Technology, using the German ”Spider Anxiety Screening” (SAS; Rinck et al., 2002). Students with scores lower than 5 or higher than 14 (maximum 18) were invited for further interviews and testing. The SAS study by Rinck et al. (2002) had revealed a normative mean of 9.5 and a normative standard deviation of 6.9. Thus, both the NAC sample and the SF group were extreme groups (see Table II.1). Before the experiment, these potential participants completed the German version of the ”Fear of Spiders Questionnaire” (FSQ; Szymanski & O’Donohue, 1995; see Rinck et al., 2002) as well as the German FDD-DSM-IV inventory (Kuehner, 1997), which is a translation of the ”Questionnaire for Depression Diagnosis” (Zimmermann, Coryell, Wilson, & Corenthal, 1986). Moreover, interviewers trained in the use of the DSM-IV checked the DSM-IV criteria for specific phobia concerning spiders. The interview was based on the International Diagnosis Checklist for DSM-IV (ICDL; Hiller, Zaudig, & Mombour, 1997) including the eight-stage assessment scales of the F-DIPS (Margraf, Schneider, Soeder, Neumer, & Becker, 1996), which is the German version of the ADIS (DiNardo, Brown, & Barlow, 1994). For interviewers as skilled as the ones of this study, diagnoses based on this screening correspond well with diagnoses based on a structured interview (Janca, Robins, Buchholz, Early, & Shayka, 1992).
II. PAPER 1
42
Table II.1: Questionnaire scores (means, standard deviations, t-tests)
Spider Fearfuls
Non-Anxious Significance of Controls t-Test (df=44) 21.0 n.s. (1.9)
Age
21.2 (2.7)
SAS
18.8 (4.2)
1.7 (1.4)
.001
FSQ
60.7 (20.2)
2.3 (2.3)
.001
FDD
8.3 (4.5)
7.1 (5.2)
n.s.
STAI-T
42.1 (8.3)
38.8 (7.1)
n.s.
STAI-S pre exp.
37.6 (7.6)
34.2 (5.4)
n.s.
STAI-S post exp.
44.6 (9.6)
34.8 (5.7)
.001
Depression (assessed with the FDD), alcohol abuse or drug abuse, and psychosis (assessed with screening questions) and specific phobia regarding other animals depicted during the experiment (assessed via ICDL) were exclusion criteria for participation in the study. Beyond that, no comorbidity was assessed. Only candidates reaching a minimum F-DIPS ”fear score” of 4 and a minimum ”avoidance score” of 3 regarding spiders qualified for the SF group. Moreover, they had to have a minimum score of 30 in the FSQ. Four of the 23 SFs fulfilled all DSM-IV criteria for a specific phobia of spiders. The remaining ones met all criteria except criterion E, which requires significant impairment in everyday life. Considering the relative ease of avoiding threatening spiders in Northern Europe, the lack of fulfilling this criterion is comprehensible and does not affect the questions of interest. The SF group and the NAC group were matched with regard to age, gender, and educational level. All candidates had a high school degree and were students of Dresden University of Technology. On average, the 21 female and 2 male members of the NAC group were 21.0 years old (SD = 1.9), the 21 female and 2 male SF participants had a mean age of 21.2 years (SD = 2.7). All of the final 46 volunteers were without history of any psychiatric disorder and had normal or corrected-to-normal vision. All of them were informed of their rights as experimental participants and gave their consent. In return for their participation, they received course credit or a payment equivalent to $5 per hour. After the diagnostics, all of the fearful participants were informed about behavioral therapy as a promising treatment for
II. PAPER 1
43
spider phobia. Those who were interested were given contact data of the Dresden University outpatient department for psychotherapy. Materials and apparatus The experiment was controlled by MATLAB software using the Psychophysics Toolbox extensions (Pelli, 1997; Brainard, 1997). Stimuli were presented on a gray background on 17” monitors with a resolution of 1024 x 768 pixels. Responses were recorded via mouse clicks. The displayed elements were 36 color images of a side length of 115 pixels: 1 spider image and 35 pleasant and neutral images, which were recommended by a team of experienced experts. The valence and arousal judgments given by our two groups subsequently to the experimental task yielded the following main results: Regarding valence, most stimuli were classified as pleasant (e.g., blossom, apple, basketball) or neutral (e.g., backpack, carton) without significant group differences. The one and only group difference was found for the spider image, which was judged as negative by the SF group (M = 1.5, SD = 0.8), but as neutral by the NAC group (M = 4.6, SD = 1.4). Regarding arousal, most images were judged as neutral (e.g., hat, pan), and some as mildly arousing (e.g., tree, candle). Only the spider image was judged as highly arousing by the SFs (M = 7.7, SD = 2.3), but as neutral by the NACs (M = 5.4, SD = 1.0), yielding a significant group difference. During the cueing phase of each trial, stimuli were presented in ”matrices” made up of 16 images each: For each trial, 16 of the 36 images were randomly chosen and randomly allocated to the 16 locations of an invisible 4x4 grid. Within this invisible grid, the centers of the images were horizontally and vertically separated by 120 pixels. A sample matrix containing a spider image is shown in Figure II.1B. During the response phase of each trial, the ”response menu” was presented to the participants (see Figure II.1D). It contained all 36 images at fixed locations that did not change during the experiment. Procedure Prior to the experimental session, participants were informed about the general procedure of the experiment, and they completed the State form of the German State-Trait Anxiety Inventory (STAI-S; Laux, Glanzmann, Schaffner, & Spielberger, 1981). After that, written instructions regarding the experimental task and a picture of the response menu were shown to familiarize participants with the materials. They were instructed to attend to the cue string to prepare for a memory test and then make a decision to indicate the target item. The importance of accuracy was emphasized. The computer screen was placed approximately 70 cm away from the participant. A sample trial containing a spider is shown in Figure II.1. Each experimental trial started with the presentation of a black fixation cross on a gray background (see Figure II.1A). After 500 ms, a 4x4 matrix of 16 images replaced the fixation cross. After another 500 ms, the cue sequence started: Five images were cued, one after
II. PAPER 1
44
Figure II.1: Sample trial with a spider image cued and probed. Subsequently to a fixation cross (A) and the appearance of the 4x4 stimulus matrix, five items are cued one after another (for simplicity, shown simultaneously here) by the appearance of a white frame (B). Immediately afterwards, one item is hidden under a gray mask (C). Participants’ task is to specify the identity of the hidden target item in the response menu (D). Note: Actual stimuli were in color.
another, at a fixed SOA of 150 ms. Cueing was achieved by showing a white square frame (side length 130 pixels) around the image for 150 ms. The cueing procedure is illustrated in Figure II.1B (note: Figure II.1B shows the five elements cued simultaneously, although they were cued successively). Immediately after the cue sequence, a single image (the target item) was masked by a dark gray square (side length 130 pixels, see Figure II.1C) for 150 ms. Subsequently, the matrix was replaced by a blank gray screen for 1000 ms. Afterwards, the response menu (see Figure II.1D) was displayed. Participants were asked to indicate the target item by mouse-clicking on the correct image included in the response menu. After the response, but no later than 3000 ms, the response menu vanished 2 . Written feedback was provided on screen after each trial. Participants initiated the next trial with a key press, and thereby could take breaks whenever needed. After the experiment, participants completed the STAI-State questionnaire a second time, as well as the STAI-Trait questionnaire (STAI-T; 2
One might argue that the response procedure itself could be a source of errors due to search difficulty. Several arguments hold against that assumption. First, participants were familiarized with the response matrix before the experiment. Second, the response menu remained the same during the whole experiment and, therefore, allowed for learning. Third, during the development of the task as well as after the experimental sessions, we asked participants if they sometimes knew what the probed item was but were not able to give the right answer due to the temporary limitations. None of the participants ever affirmed this question.
II. PAPER 1
45
Laux et al., 1981). Then they were asked to judge each of the 36 images on a 9-point rating scale with regard to its valence (1= unpleasant, 9= pleasant) and arousal (1= low, 9= high). Finally, the participants were debriefed about the aims of the study. A complete session took about 70 minutes. Design The task followed a 2x7x6 factorial design with the between-subjects factor ”participant group” (SFs vs. NACs) and the within-subjects factors ”spider position” (cue 1, cue 2, cue 3, cue 4, cue 5, uncued, none) and ”test position” (cue 1, cue 2, cue 3, cue 4, cue 5, uncued). ”Spider position” refers to the location of the spider image: it could be one of the 5 cued images (with ”cue 1” being the first cued image and ”cue 5” the last one), it could be one of the remaining 11 uncued items, and ”none” describes trials without any spiders. Similarly, ”test position” refers to the probed target item, which could be one of the 5 cued images or any other, uncued image of the matrix. We assumed the cued images to be the ”attended items”, and uncued items were probed to test the effectiveness of the cueing procedure in directing attention. For each trial, spider position and test position were randomly chosen by the MATLAB experimental program. Each of the 42 possible combinations of spider position and test position was presented 10 times to each participant. Thus, they completed in total 420 experimental trials, preceded by 6 practice trials. For each factorial combination, the participants’ mean accuracy in identifying the probed item served as the dependent variable. In the analyses of this variable, interactions involving the factor ”group” were of main interest, because they would suggest disorder-specific effects. In contrast, main effects of spider position and test position would suggest general effects of negative materials on the attentional bottleneck. Results Questionnaires
The mean questionnaire scores for the two groups of participants are shown in Table II.1. Depression scores on the FDD, trait anxiety scores on the STAIT-Trait, and state anxiety scores on the pre-experimental STAI-S fell within the normal range and did not differ between the two groups. The SFs’ state anxiety rose slightly during the experiment, yielding a significant difference between the two groups after the experiment. None of these results compromises interpretation of the results reported below. Experimental Task
Prior to the statistical data analyses, practice trials were discarded from the data set. Table II.2 shows the mean accuracy values in identifying the probed target object, separately for
II. PAPER 1
46
Table II.2: Mean memory accuracy (percent correct) and standard deviations (in parentheses) for each experimental combination of participant group, spider position, and test position. Combinations in which the spider picture was tested are indicated by bold face
Group and Spider Position Spider Cue 1 Fearfuls
[a]
Cue 1 [A] .82 (.19)
Test Position of Target Item Cue 2 Cue 3 Cue 4 Cue 5 Uncued [B] [C] [D] [E] [F] .37 .41 .66 .78 .26 (.24) (.23) (.18) (.16) (.29)
Cue 2
[b]
.43 (.24)
.79 (.20)
.47 (.25)
.64 (.22)
.73 (.21)
.24 (.19)
Cue 3
[c]
.45 (.25)
.35 (.21)
.80 (.20)
.62 (.21)
.80 (.17)
.26 (.24)
Cue 4
[d]
.42 (.21)
.36 (.18)
.44 (.21)
.89 (.16)
.74 (.20)
.26 (.25)
Cue 5
[e]
.38 (.27)
.38 (.22)
.43 (.24)
.70 (.18)
.91 (.14)
.27 (.24)
Uncued
[f]
.45 (.20)
.36 (.20)
.42 (.18)
.70 (.17)
.76 (.14)
.62 (.27)
None
[g]
Non-Anxious Cue 1 Controls
[a]
.43 (.24) .71 (.26)
.42 (.22) .37 (.21)
.47 (.24) .40 (.22)
.69 (.18) .60 (.27)
.83 (.11) .70 (.22)
.28 (.23) .18 (.18)
Cue 2
[b]
.48 (.27)
.62 (.24)
.34 (.23)
.62 (.23)
.74 (.18)
.19 (.14)
Cue 3
[c]
.44 (.23)
.36 (.22)
.69 (22.)
.62 (.20)
.74 (.16)
.22 (.22)
Cue 4
[d]
.47 (.27)
.33 (.23)
.40 (.23)
.78 (.21)
.68 (.22)
.17 (.15)
Cue 5
[e]
.48 (.25)
.34 (.20)
.40 (.22)
.62 (.20)
.86 (.18)
.20 (.21)
Uncued
[f]
.45 (.30)
.33 (.22)
.43 (.23)
.59 (.20)
.73 (.20)
.38 (.26)
None
[g]
.45 (.26)
.31 (.21)
.41 (.26)
.68 (.20)
.70 (.19)
.22 (.22)
II. PAPER 1
47
Table II.3: Mean capacity estimates from memory accuracy for objects within spider-free cue strings vs. spider–strings, for both participant groups
String type and chance level type Emperical chance level
Group NAC SF spider-free strings 1.4 1.4 spider strings 1.8 1.6
theoretical chance level spider-free strings spider strings
2.4 2.6
2.7 2.8
each experimental combination of spider position, test position, and participant group. The cells of Table II.2 are labeled with letter combinations for ease of communication: Separately for each group, the lines are labeled a to n, and the columns A to F. We computed several specific analyses of the relevant experimental conditions, in order to separately test our specific hypotheses for varying subsets of the data. Hypothesis 6 regarding disorder-specific group differences was tested together with each of the hypotheses 1 to 5. We used an alpha-level of .05 for all statistical tests. To avoid inflation of alpha error in these analyses, Bonferroni corrections were used where necessary. Effect sizes are reported below as eta2 values for ANOVAs and as Cohen’s (1988) d values for t-tests. Hypothesis 1: Spider images should be remembered better than non-spider images Following Wolfe et al. (2006) and Pashler (1988), we estimated VWM capacity values by subtracting a chance level of memory from the mean accuracy for conditions of interest (here: spider-free cue strings vs. strings containing a spider 3 ), and afterwards multiplying the result by the cue string length of 5 items. As suggested by Wolfe et al. (2006) we estimated VWM capacity twice, once using an empirical chance level, once using the theoretical chance level. The individual empirical chance level is represented by each participant’s accuracy for uncued items in the specific condition of interest (non-spider vs. spider), the theoretical chance level equals 1/36 because the response menu contained 36 possible answers to choose from. We computed two 2x2 ANOVAs on the capacity values in Table II.3, once for the values based on the empirical chance level (ECL), once for the values based on the theoretical chance level (TCL). In both analyses, the factors were ”cue string type” (spider-free strings vs. spider strings) and ”group” (SFs vs. NACs). Similar to the results reported by Wolfe et 3
VWM capacity values for items from spider-free cue strings were averaged across the 5 cells gA, gB, gC, gD, gE for spider fearfuls and the same 5 cells for non-anxious controls. Values for cue strings containing a spider were averaged across the 25 cells aA-aE, bA-bE, cA-cE, dA-dE, and eA-eE for spider fearfuls, and the same 25 cells for non-anxious controls.
II. PAPER 1
48
al. (2006), the estimated capacity values ranged from 1 to 3 items. Regardless of the type of chance level used, VWM capacity was larger when a spider was among the items to be stored, ECL: F (1, 44) = 8.92, p = .005, eta2 = .20; TCL: F (1, 44) = 5.35, p = .025, eta2 = .11. This effect occurred to a similar degree in both groups, as there was neither a main effect of group, ECL: F (1, 44) < 1, eta2 = .003; TCL: F (1, 44) = 1.49, p = .229, eta2 = .03, nor an interaction, both F (1, 44) < 1, both eta2 < .02. The finding of increased VWM capacity for cue strings containing a spider raises a question: Does the presence of a spider enhance memory for all items of the cue string? Or is the beneficial effect limited due to superior memory for the spider item itself? To answer this question, the following additional analyses were computed. Hypothesis 1 and 2: Spider images should be remembered better than non-spider images and should be remembered well independently of their position within the cue strings To more specifically test whether negative items have a favored role in visual working memory, we compared accuracy in spider-target trials (in which a spider was cued and also tested) to accuracy in spider-free trials (without a spider in the matrix) 4 . For this relevant subset of the data, we computed a 2x2x5 ANOVA of the mean accuracy values, including the between-subjects factor ”group” (SF, NAC) and the within-subjects factors ”spider presence” (non-spider trials vs. spider trials) and ”test position” (Cue 1, 2, 3, 4, 5). The results are depicted in Figure II.2. The ANOVA revealed significant main effects for all factors: in total, SFs showed more accurate memory than NACs, F (1, 44) = 5.92, p = .019, eta2 = .12, and items shown just prior to the test were memorized better than items processed earlier, F (4, 176) = 46.21, p < .001, eta2 = .51. Moreover, spiders were memorized better than non-negative images, F (1, 44) = 79.32, p < .001, eta2 = .64, and this was true for each of the five test positions, all F (1, 44) > 14.46, all p < .001, all , eta2 > .25. The interaction of test position and group was not significant, F (4, 176) < 1, eta2 = .02, indicating that both groups showed similar serial position effects. The interaction of spider presence and group was not significant either, F (1, 44) < 1, eta2 = .02, suggesting that the two groups handled spider images in similar ways. The three-way interaction of group, spider presence, and test position was not significant either, F (4, 176) = 1.55, p = .189, eta2 = .03. In contrast, the interaction of spider presence and test position was highly significant, F (4, 176) = 11.48, p < .001, eta2 = .21, suggesting that the general serial position effect found in earlier experiments was 4
The relevant spider-target trials are given in the 10 cells for which test position equals spider position (cells aA, bB, cC, dD, eE for each group), shown in bold face in Table II.2. The corresponding spider-free trials are shown in the 10 cells defined by the 2 lines labeled ”Spider Position None” and the 5 columns labeled ”Cue 1” to ”Cue 5” (cells gA, gB, gC, gD, gE for each group).
II. PAPER 1
49
weakened when negative rather than non-negative materials were involved. They were not completely erased, however, as they were still significant in one-way analyses of variance, both for SFs, F (4, 88) = 5.37, p = .001, eta2 = .20, and NACs, F (4, 88) = 7.0, p < .001, eta2 = .24. To test whether the significant main effect of ”group” was due to a general memory advantage of the spider fearful group, we computed additional two-way analyses of variance involving the factors ”test position” and ”group”, separately for spider-free trials and spider-target trials. For spider-free trials, there was no significant difference between SFs and NACs, F (1, 44) = 1.89, p = .176, eta2 = .04, whereas the analysis of the spider-target trials revealed higher accuracy values for the SFs, F (1, 44) = 5.62, p = .022, eta2 = .11. However, as mentioned above, this did not yield a statistically significant interaction of group and spider presence. 1 0,9 0,8 mean accuracy
0,7 0,6
spider trials
0,5 0,4 0,3
non-spider trials
0,2
SF
0,1
NAC
0 Cue 1
Cue 2
Cue 3
Cue 4
Cue 5
cue string
Figure II.2: Serial position effects: Mean memory accuracy for spider targets vs. non-spider targets, depending on group and position within the cue string.
Hypothesis 3: A spider picture causes retroactive interference for items preceding it and proactive interference for items following it To test whether the presence of a spider image affects processing of neighboring items, we compared the mean accuracy in identifying non-spider images shown directly after or directly before a spider to non-negative images from corresponding trials without spiders. For analyses of items following a spider image, we used all trials that included a spider image in the cue string and in which the item directly after the spider was tested; yielding the
II. PAPER 1
50
”after spider image” condition. The corresponding cells of the spider-free trials were used as the baseline condition ”after non-spider image”5 . For these conditions, we computed a 2x2x4 ANOVA of the mean accuracy values, including the between-subjects factor ”group” (SF, NAC) and the within-subjects factors ”item type” (after spider, after non-spider) and ”test position” (cue 2, 3, 4, 5). Memory accuracy for the probed non-negative item was significantly lower when it had been preceded by a spider item (NAC: M = 0.51; SF: M = 0.55) rather than a non-spider image (NAC: M = 0.53; SF: M = 0.60), F (1, 44) = 4.98, p = .031, eta2 = .10. Moreover, as already shown, the target item’s position within the VWM also affected memory accuracy, F (3, 132) = 73.10, p < .001, eta2 = .62. We failed to find a significant main effect of group, F (1, 44) = 2.0, p = .165, eta2 = .04, an interaction of item type and group, F (1, 44) < 1, eta2 = .02, or a three-way interaction of group, item type, and test position, F (3, 132) = 2.06, p = .109, eta2 = .05, suggesting that spider images interfered with memorization of the immediately following item to a similar degree in both groups. Moreover, the observed proactive interference effect was short-lasted: For the second item following a spider image, the main effect of item type was not significant, F (1, 44) = 2.02, p = .163, eta2 = .04. This suggests that the distractive effect of the spider image on memory accuracy for following images vanished within 150 ms. Similar analyses were computed for the non-negative item preceding the spider image and the corresponding control items. Again, a 2x2x4 analysis of variance with the factors ”group”, ”item type” (preceding spider, preceding non-spider) and ”test position” (cue 1, 2, 3, 4) was computed. This analysis did not yield significant effects, except for the already known main effect of ”test position”, F (3, 132) = 46.94, p < .001, eta2 = .52, suggesting that the spider image did not cause retroactive interference. Hypotheses 4 and 5: Spider images should be accurately remembered, even when they are not cued. The presence of a spider beyond the cued set should lead to lower memory accuracy for the cued non-spider items (A) Memory for uncued spiders vs. non-spiders. To find out whether there is any memory advantage for spiders outside the cue string, even though these are not cued, and whether this advantage is specific to spider fearfuls, we compared the mean accuracy in reporting (a) the probed spider beyond the cue string to (b) the probed item beyond the cue string in non-spider trials 6 . These values were subjected to a 2x2 ANOVA involving the betweensubjects factor ”group” and the within-subjects factor ”test item” (spider, non-spider). The resulting means are depicted in Table II.4A. There was a significant main effect of ”negativity”, F (1, 44) = 40.0, p < .001, eta2 = .48, indicating that uncued spider items 5
For the ”after spider image” condition, we included the cells aB, bC, cD, and dE for each group. The corresponding cells of the spider-free trials were gB, gC, gD, and gE for each group. 6 For (a), the values of the two cells labeled fF are relevant, for (b), the two cells labeled gF are of interest.
II. PAPER 1
51
Table II.4: A) Mean memory accuracy and standard deviation for uncued no-spider items vs. uncued spider items. B) Mean memory accuracy and standard deviation for cued no-spider items vs. uncued spider items. C) Mean memory accuracy and standard deviation for cued vs. uncued spider items. D) Mean memory accuracy and standard deviation for cued non-spider items, depending on the absence or presence of a spider item among the non-cued items
A)
B)
C)
D)
Experimental conditions uncued no-spider items
Group NACs SFs .22 .29 (.22) (.23)
uncued spider items
.38 (.26)
.62 (.27)
cued no-spider items
.51 (.14)
.57 (.15)
uncued spider items
.38 (.26)
.62 (.27)
cued spider items
.73 (.17)
.84 (.15)
uncued spider items
.38 (.26)
.62 (.27)
absence of an uncued spider item
.51 (.14)
.57 (.15)
presence of an uncued spider item
.51 (.16)
.54 (.13)
were memorized better than uncued non-negative items. Additional t-tests confirmed this result for both groups, NAC: t(22) = 3.26, p = .004, d = .67; SF; t(22) = 5.49, p < .001, d = 1.32. Moreover, we found a significant main effect of ”group”, F (1, 44) = 6.09, p = .018, eta2 = .12, and a significant ”group” x ”negativity” interaction, F (1, 44) = 5.08, p = .029, eta2 = .10. This interaction was based on significantly better performance of SFs than NACs for spider items, t(44) = 3.05, p = .004, d = .91, compared to a non-significant difference between the two groups for non-negative items, t(44) < 1, d = .31. Thus, compared to NACs, SFs showed a pronounced memory advantage when uncued spider items were tested. (B) Memory for uncued spiders vs. cued non-spiders. Is the SFs’ memory advantage for uncued spider items strong enough to outweigh the effect of cueing for non-negative items? That is, are uncued spiders reproduced as well as cued non-negative items, or maybe even better, although they were not exogenously cued? The answer to this question would yield
II. PAPER 1
52
interesting information about the relative size of the memory advantage for spiders, over and above its mere statistical significance. To answer this question, we compared mean accuracy in remembering uncued spider items to mean accuracy in remembering cued items in non-spider trials 7 . For this subset of the data, we computed a 2x2 ANOVA of the mean accuracy values, including the between-subjects factor ”group” and the within-subjects factor ”probe” (cued non-spider item, uncued spider item). The results are depicted in Table II.4(B). The ANOVA did not reveal a main effect of ”probe”, F (1, 44) = 1.05, p = .311, eta2 = .02, suggesting that on average, neither uncued spiders nor cued non-spider items were better reproduced. In contrast, there was a highly significant main effect of ”group”, F (1, 44) = 8.77, p = .005, eta2 = .17, and a significant ”group” x ”probe” interaction, F (1, 44) = 5.57, p = .023, eta2 = .11. Subsequent t-tests revealed the nature of this interaction: NACs’ memory performance was better for cued non-negative items, t(22) = 2.55, p = .018, d = .65, whereas SFs showed a minor and non-significant advantage for uncued spider items, t(22) < 1, p = .382, d = .24. (C) Memory for cued spiders vs. uncued spiders The latter result suggests that for SFs, the negative value of spiders produces effects that are at least as strong as the cueing effects for non-spider items. Therefore, one may wonder whether cueing has an effect for spider items at all: Are uncued spider images remembered just as well as cued ones? To answer this question, we computed a 2x2 ANOVA involving the between-subjects factor ”group” and the within-subject factor ”cueing status” (cued spider, uncued spider). For this analysis, we determined mean accuracy for cued-and-probed spiders and mean accuracy for uncuedand-probed spiders 8 . The resulting means are depicted in Table II.4C. Significant main effects were found for both factors, indicating that cued spiders were better memorized than uncued spiders, F (1, 44) = 91.23, p < .001, eta2 = .68. Subsequent t-tests showed that this cueing effect occurred both for NACs, t(22) = 7.91, p < .001, d = 1.63; and SFs, t(22) = 5.50, p < .001, d = 1.05. A significant main effect of ”group” indicated that SFs showed better memory performance than NACs for spiders images, F (1, 44) = 9.41, p = .004, eta2 = .18. This difference in favor of the SFs occurred both for uncued spiders, t(44) = 3.05, p = .004, d = .91; and for cued ones, t(44) = 2.37, p = .022, d = .69. The advantage was larger for uncued ones, however, yielding a significant ”group” x ”cueing status” interaction, F (1, 44) = 4.53, p = .039, eta2 = .09. This result suggests that in addition to paying attention to the cued items, spider fearfuls also paid attention to a spider that occurred beyond the cue string. 7
The mean accuracy in remembering uncued spider items is depicted in the two cells labeled fF, the 10 relevant cells for calculating the mean accuracy in remembering cued items in non-threatening trials are labeled gA, gB, gC, gD, and gE for each group. 8 The 10 relevant cells for the mean accuracy for cued spiders are those at the diagonals: aA, bB, cC, dD, and eE for each group. The mean accuracy for probed spiders beyond the cue string is depicted in the 2 cells labeled fF.
II. PAPER 1
53
(D) Distraction caused by uncued spiders. The previous analysis revealed improved memory for uncued spiders in SFs. This raises the question whether this improvement comes at the cost of memory for cued items, or whether SFs somehow manage to remember the uncued spider in addition to the cued items. To answer this question, an additional analysis was computed to find out whether the presence of a spider image beyond the cue string affected memory accuracy for non-negative items within the cue string. Here, we compared mean accuracy for non-negative cued items when there was a spider beyond the cued string to mean accuracy for the same items when there was no spider beyond the cued string 9 . The results of the 2x2 ANOVA involving the between-subjects factor ”group” and the within-subjects factor ”presence of uncued spider” (present, absent) are depicted in Table II.4D. This analysis did not reveal any significant effects, neither for the main effects, both F (1, 44) < 1.27, nor for the interaction, F (1, 44) = 0.77, p = .384, eta2 = .02, suggesting that memory for cued items was not impaired by the presence of a spider image outside the cue string. The latter was true for both groups, NACs: t(22) < 1, d = .0; SFs: t(22) = 1.39, p = .179, d = .21. Alternative explanation 1: A response bias for spider images in spider fearfuls. An alternative account of the findings described above states that the observed group differences were due to a general response bias in the spider fearful group, rather than a disorderspecific memory bias. To test this hypothesis, we intended to calculate the signal detection parameters d’ and β. To this end, we determined hit rates (uncued item is correctly reported as a spider) and false alarm rates (uncued item is wrongly reported as a spider for both groups in two conditions: when a) there was a cued spider within the display, and b) when there was no spider within the display. Unfortunately, a formal signal detection analysis was not possible because the requirements were not fulfilled: False alarm rates were very low and even at zero for over one third of participants. However, an informal inspection of the mean hit rates and mean false alarm rates suggested that SFs did not have a response bias in favor of spiders: They achieved much higher hit rates than NACs (62% vs. 38%), but had the same low false alarm rates (a) 8% vs. 9% and b) 3% vs. 2%). Alternative explanation 2: Psychophysical uniqueness of the spider image. An alternative explanation of the memory enhancement that both groups showed for spiders refers to psychophysical features of the spider picture, rather than its emotional valence. The spider picture is one of the most salient ones, due to its dark color and the very distinctive star-like pattern, and it depicts an animal. To test this explanation, we compared the hit rate for the spider image to the hit rate for the butterfly image, because the butterfly image used in this 9
For the condition ”spider beyond the cued string”, the cells fA, fB, fC, fD, and fE from each group were relevant. For the condition ”no spider beyond the cued string”, we used cells gA, gB, gC, gD, and gE from each group.
II. PAPER 1
54
task was also dark and characteristic in shape. Moreover, it also depicted an animal, but a positively valenced one. The 2 (picture) x 2 (group) ANOVA of these hit rates revealed a significant main effect of the picture in favor of the spider image [hit rates spider: NAC M = 0.64/ SF M = 0.80; hit rates butterfly: NAC M = 0.48/ SF M = 0.51], suggesting that the memory enhancement for spiders is not solely attributable to psychophysical characteristics. Discussion In the experiment reported here, we used an experimental task introduced by Wolfe et al. (2006), in order to study how negative items affect the attentional bottleneck and visual working memory. In this task, a matrix of images is shown simultaneously, a rapid serial cueing technique is used to externally guide attention to some images, and VWM content is probed directly after cueing. The effect of emotionally valenced materials, particularly negative materials, was tested by including a spider image in the matrix, either among the cued items or outside the cue string. In order to vary the threat value of the spider image while holding the image constant, a group of highly spider fearful participants (SFs) was compared to a group of non-anxious controls (NACs). The observed results extend earlier ones reported for emotionally neutral materials to the processing of negative materials. At the same time, they extend the literature on cognitive biases in specific phobias to processes affecting the attentional bottleneck and visual working memory. In summary, the experiment yielded a number of noteworthy results regarding visual working memory for cued and uncued items. Regarding cued items, we found that negativity widened the attentional bottleneck and increased visual working memory capacity: Capacity values, as computed by conventional formulas, were larger for cue strings containing a spider than for strings without a spider. This was true both for SFs and NACs. This result is compatible with many earlier ones that showed a general processing advantage for evolutionary relevant stimuli which signal danger or used to do so, for instance spiders, snakes, crocodiles, or heights (for an overview of studies, see Oehman & Mineka, 2001, 2003). It has been argued that humans are predisposed to be alert of situations and animals that, during early stages of evolution, endangered survival. In fact, in conditioning experiments, these evolutionary ”old” threat stimuli are more easily associated with fear (Oehman & Mineka, 2001, 2003) than modern stimuli (e.g., cars, weapons), and they are more often at the core of phobic fears (McNally, 1987). Second, we found that the participants’ increased VWM capacity for spider strings was due to improved memory for the spider image itself, whereas the item following the spider was remembered worse than other items. Thus, the spider image caused proactive interference, and this interference was also found for SFs and NACs alike. Moreover, the
II. PAPER 1
55
two groups were also comparable in that retroactive interference occurred in neither group, that is, memory for the item preceding the cued spider image did not suffer compared to other items. The lack of retroactive interference in the presence of proactive interference suggests that participants found it difficult to disengage their attention from the spider image, and that prolonged processing of the spider image interfered with attention to the subsequently cued image. Difficulties in disengagement of attention have recently been suggested as a major cause of attentional biases toward threat in high trait anxiety and anxiety disorders (Fox, Russo, Bowles, & Dutton, 2001). In our study, however, it occurred to a similar degree in both SFs and NACs. Third, we replicated the central results of Wolfe et al. (2006), by finding strong serial position effects for non-negative items in spider-free trials. For these materials, observers were solely able to maintain the identity of recently attended items. As depicted in the serial position curves, there was high memory accuracy for the two latest items stored in visual working memory, and declining accuracy for earlier items, while accuracy was generally poor for uncued items. Thus, in neutral picture displays, response accuracy seems to be severely limited by the two bottlenecks suggested by Wolfe et al. (2006): the bottleneck in selective attention restricts the ability to report the identity of items to the recently attended ones. Additionally, the VWM bottleneck limits these to a maximum of 3 items. As one would expect, this was true for both NACs and SFs because the cue strings did not involve any spiders. In contrast, the serial position effect was much weaker for cue strings containing a spider image, suggesting that the effect was attenuated by negative emotional valence. The attenuation was due to improved memory for the serial position which contained the spider image. Therefore, when a negative item is cued, the two bottlenecks do not seem to function in the familiar manner. Instead, they seem to be widened: spider images are better memorized than non-negative images, and the position of the spider image within VWM is less important than it is for non-spider items. In fact, we found that for each position of the cue string, accuracy for the spider image was higher than for non-negative items at the same position. Therefore, whenever a spider image was included in the string of five cues, the serial position curve would show a clear peak at the position of the spider, reminiscent of the Restorff effect (von Restorff, 1933). The resulting curves looked quite different from the serial position curve found in earlier experiments with neutral materials (Wolfe et al., 2006; Irwin & Zelinsky, 2002). Averaging over the five possible positions of the cued spider then yielded the high and flat curves shown in Figure II.2. The widening of the bottlenecks and the attenuation of position effects by the spider occurred for both SFs and NACs. In contrast to the cued items, the negativity effects for uncued items varied with fear of spiders, yielding several reliable group differences. First, uncued spiders were better recalled than other uncued items, and this bias toward uncued spiders was stronger in
II. PAPER 1
56
SFs. Indeed, for SFs, the advantageous negativity effect for uncued spiders was not only statistically significant, it was also just as strong as the cueing effect for neutral items. This was not the case for NACs. The beneficial negativity effect did not erase cueing effects for spiders, however, such that even SFs recalled cued spiders better than uncued ones. Finally, the SFs’ memory advantage for uncued spiders did not come at the cost of the cued non-spider items. Instead, they managed to remember the cued items just as well as NACs did, while simultaneously showing improved recall of uncued spiders. The observed pattern of results suggests general effects which occur in highly fearful participants and non-anxious ones, as well as disorder-specific effects, which occur in fearfuls only. Interestingly, the boundary between general and specific effects is defined by the cueing procedure: For cued items, we found that both SFs and NACs showed improved memory for the spider image, whereas only SFs showed improved visual working memory for uncued spider images. The lack of reliable differences between SFs and NACs with regard to cued items is quite plausible in light of earlier research. Several studies have shown that anxiety patients show hardly any processing advantage for threat stimuli when – as in the present cueing procedure – attention is voluntarily focused on specific items. This pattern of results is in accordance with theoretical predictions (most clearly formulated by Mathews & Mackintosh, 1998), and it was found in a variety of experimental tasks, for instance, signal detection tasks (e.g., Becker & Rinck, 2004; Windmann & Krueger, 1998), visual search tasks (Rinck et al., 2005), and in free viewing situations (Hermans et al., 1999, Rinck & Becker, in press). The same applies to the visual working memory task used here: Participants were asked to focus their attention on the cued items, which were cued one by one, and as a result, no disorder-specific processing advantage for SFs occurred. Whatever advantage the negative value of the spider image may have had for SFs, the NACs were able to compensate for it by voluntary allocation of attention. One might also wonder why the NACs behaved in this way and showed improved memory for the cued spider image, although they did not rate it as significantly negative. Does this mean that stimulus features of the spider other than negativity caused the effects observed for NACs? Or does this cast doubt on subjective ratings and other direct estimates of emotional valence? Most likely, the latter is true, because recent findings suggest that indirect effects of negative stimuli are likely to be observed even when participants’ direct ratings do not reflect the negativity (Greenwald, McGhee, & Schwartz, 1998; Ellwart, Rinck, & Becker, in press). These dissociations between direct measures (e.g., evaluations) and indirect ones (e.g., reaction times and memory performance scores) have recently become a topic of considerable interest. For instance, Greenwald et al. (1998) demonstrated that white participants may show negative associations toward black faces although they deny racial prejudices when asked directly. And more closely related to the present study, Ellwart et al. (in press) found that even participants who reported no fear of spiders at all showed significant spider-fear associations which were only slightly weaker than those of
II. PAPER 1
57
spider phobics. In conclusion, the memory advantage for spiders observed in NACs fits in well with these previous findings, it extends them to a working memory task, and it points to the importance of dissociations between direct and indirect measures of emotional valence. In contrast to the cued items, no attention had to be paid to the uncued ones, thereby directing voluntary attention away from them. Moreover, there were 11 uncued items presented simultaneously. In this situation, there is strong competition for attention, which has been identified as a prerequisite for finding attentional biases toward threat in anxiety patients (e.g., Mathews & Mackintosh, 1998; Rinck & Becker, 2006). In this situation, uncued negative items function similarly to threatening distractor items in a visual search task, for which an attentional biases has been shown repeatedly (see Rinck et al., 2005): Stimuli that are threatening to anxiety patients capture their reflexive attention (for detailed accounts of attentional processes including voluntary vs. reflexive processes, see Posner, 1980; Posner & Peterson, 1990). Anxiety patients may show this reflexive attentional bias toward threatening stimuli because of their increased experience with the feared objects. Following Cave and Betty (2006), mere practice allows for the construction of stronger connections between high-level representations of objects and the specific combination of its visual features. Similarly, the authors assume that anxiety representations are more highly activated in anxious participants, therefore the perception of threat items is improved by the individual’s numerous experiences of searching for the feared object. Similarly, Oehman et al. (2001) also suggest that individual fears and attitudes influence attentional processes. Although the SFs’ improved memory for uncued spider images is quite plausible for theoretical and empirical reasons, a puzzle remains: Why does it not come at the cost of memory for the cued items? This seems to suggest that in some mysterious way, SFs were able to recruit additional attentional resources in order to process uncued spider images, over and above the cued items. However, the accuracy rates shown in Figure II.2 suggest something different: For non-negative cue strings (the ”non-spider trials” of Figure II.2), both SFs and NACs showed fairly low accuracy rates. Even for the most recently cued item, accuracy rates were only between 70% and 80%. This suggests that the participants did not spend 100% of their attention on the cued items, but also paid some attention to other aspects of the task, the materials, or the environment. This could happen during the 750 ms of the cueing procedure as well as during the preceding 500 ms. It does not seem unlikely to assume that NACs distributed their attention more evenly among the non-cued items than SFs, whose attention – for the reasons outlined above – tended to be captured by uncued spiders. As a consequence, they outperformed the NACs when an uncued spider was probed. Thus, we would like to argue that there is no need to assume some mysterious additional attentional resource for the processing of negative stimuli, over and above the widening of the attentional bottleneck and visual working memory that was observed for
II. PAPER 1
58
cued items. Several limitations of the current experimental design should also be noted. First, there were no other images with negative valence in addition to the spider image. Thus, one has to be cautious in attributing the observed effects to the fact that the critical picture depicted a spider. Given this limitation, we cannot rule out the possibility that similar effects would be observed with other stimuli of negative emotional valence. Therefore, we have deliberately denoted the observed effects as due to negative valence, rather than due to the specific spider features of the image, and additional research is needed to determine the boundary conditions of the effects. For instance, would those memory advantages which were observed in both groups occur for NACs who rate the stimuli as negative as well as for NACs who do not? And would they be observed for other negative stimuli? Previous research on attentional biases suggests that this might be the case (Hansen & Hansen, 1988; Oehman et al., 2001). Moreover, would the effects which were specific to the spider fearfuls also occur for other negative items, particularly other animals? Previous research indicates that this might be true for highly similar animals (e.g., beetles; see Becker & Rinck, 2004), but not for other animals such as snakes (Oehman et al., 2001). Thus, we expect that future research will show that the memory advantage for uncued spiders observed solely in spider fearfuls is indeed due to the particular threat value that spider fearfuls ascribe to spiders. Second, although our findings are compatible with claims that fears and phobias in modern humans are strongly affected by evolutionary processes (e.g., see the ”evolved fear module” proposed by Oehman & Mineka, 2001), the design of the current experiment is too limited to confirm this claim. In order to test this hypothesis with regard to the two attentional bottlenecks, future experiments need to employ ”modern” threats (e.g., weapons) in addition to evolutionary ”old” ones such as spiders and snakes. If the effects observed here do not occur for modern threats, stronger evidence for an evolutionary basis of the observed memory advantages could be supplied. Third, as we aimed to replicate the experimental design used by Wolfe et al. (2006), on each trial participants were allowed to view the 4x4 matrix of images for 500 ms before the cueing procedure started. Possibly, some of the preferential processing of uncued spiders observed in the spider fearfuls occurred during this initial phase, given the initial attentional bias toward threatening stimuli observed in spider fearfuls (Rinck & Becker, 2006). Therefore, future research should determine the relative role of this initial phase compared to the cueing phase itself. Finally, as it is often the case, it would be advantageous to replicate the current study with a larger sample size and better statistical power. This would be helpful not only to test
II. PAPER 1
59
whether the current results may be replicated, but also to determine whether some of the weak interactions found here would either disappear or become statistically significant with more statistical power. To summarize, the modified visual working memory paradigm employed here was successful in extending earlier experiments with emotionally neutral materials to the processing of negative materials. Moreover, the results add to the growing literature on cognitive biases in specific phobias, and they direct our attention to the ”missing link” between attention and memory, namely, to the attentional bottleneck and to visual working memory. We expect that further research along these lines will prove to be a worthwhile enterprise.
III. Paper 2: Selective Visual Working Memory in Fear of Spiders: the Role of Automaticity and Disorder-Specificity
Abstract Visual working memory for negative stimuli was studied by comparing spider fearfuls to non-anxious controls. On each trial, 16 images were displayed and five of them were cued one after another for 150 ms each. Afterwards, one of the 16 items was hidden and had to be recalled. We measured memory accuracy depending on the probed item’s valence and its position within the cue string. The negative item was a spider in Experiment 1 and a snake in Experiment 2. It was included in the string of 5 cued images, among the 11 uncued items, or not at all. Both groups showed enhanced memory for negative items, and spider fearfuls revealed a disorder-specific additional advantage for spiders only.
Introduction Following cognitive theories of anxiety (e.g., Beck, Emery, & Greenberg, 1985; Clark & Wells, 1995; Eysenck, 1992; Williams, Watts, MacLeod, & Mathews, 1997), biased cognitive processes play a significant role in the etiology and maintenance of anxiety disorders. To test these theories, methods borrowed from experimental psychology investigating attention and memory are applied against the background of an individual’s anxiety. Regarding attentional biases in anxiety disorders, there is ample evidence that attention is quickly shifted to threatening stimuli and at the same time removed from other stimuli (for a recent review, see Mathews & MacLeod, 2005). In contrast, the conditions for the occurrence of memory biases in anxiety and anxiety disorders are less clear. While some studies found stable memory biases in some anxiety disorders (e.g., panic disorder, post-traumatic stress disorder), others failed to find improved memory for threat (Mathews & MacLeod, 2005). When considering spider fearful individuals in particular, results are also controversial. On the one hand, Watts (1986) found enhanced recognition for spider words in spider phobics, and Rusted and Dighton (1991) reported enhanced recall of spider-related words. Other studies, however, indicated lower recall (Watts, 1986) and lower recognition memory for
60
III. PAPER 2
61
spider-related materials (Watts, Tresize, & Sharrock, 1986). To summarize, there is wide agreement regarding the existence of attentional biases in anxiety, whereas the empirical basis for anxiety-specific memory biases is less coherent. This raises the question why it is difficult to find anxiety-related memory biases for threatening materials. First, one potential answer may be related to the stimulus materials employed: Some memory studies used verbal materials, others used pictures. With regard to spider phobia, however, it is obvious that pictures of spiders are more threatening than written words such as ”spider”. Thus, presenting visual materials should lead to more reliable results. Second, we argue for a more detailed consideration of memory and, thus, the depth of elaboration. In experimental psychology, there is wide agreement about understanding memory as divided into at least three systems: sensory storage, working memory, and long-term memory (e.g., Atkinson & Shiffrin, 1968; Baddeley, 1992; Luck & Vogel, 1997). This division is also important with respect to clinical theories of anxiety disorders. For instance, Williams et al. (1997) postulate that phobics show a fast attentional orientation to threatening stimuli, but then avoid deeper elaboration of these stimuli, which might lead to the observed lack of biases in explicit long-term memory. It is quite unclear, however, where this avoidance starts. Already at the stage of working memory, or only later? To the best of our knowledge, the existing studies of memory biases addressed some sort of long-term memory, with retention intervals of one hour or more. If phobics do indeed avoid deeper elaboration of threatening stimuli one might not be surprised to find that most of these studies fail to find explicit memory enhancement effects in phobics. Given the many studies of attentional processes and long-term memory, it is surprising that there remains a ”missing link” between them: Only a handful of studies addressed the gap between attention and long-term memory, namely, the attentional bottleneck and working memory. Imagine a spider phobic entering a crowded room and immediately detecting a spider somewhere on a wall, thereby revealing an attentional bias. Soon, he may be distracted by someone willing to make conversation, but he is still aware of the spider on the wall. And when the conversation partner leaves, he is instantly able to move his attention back to the spider and tell whether it moved or not. Basically, this is an example of high performance in a working memory task, being so good because of the threat value of the stimulus. And indeed, the few existing studies on working memory performance in anxiety yielded promising results. For instance, Anderson and Phelps (2001) demonstrated preferential selection of aversive words, using an attentional blink paradigm. Consolidation models of the attentional blink phenomenon (e.g., Chun & Potter, 1995; Vogel & Luck; 2002) postulate that the effect reflects limitations in working memory consolidation, thus, aversive words seem to be consolidated more efficiently.
III. PAPER 2
62
Moreover, Reinecke, Rinck, and Becker (2006) adapted a visual working memory task introduced by Wolfe, Reinecke, & Brawn (2006) to threatening materials in spider anxiety. Reinecke et al. (2006) tested a group of highly spider fearful individuals (SFs) and a group of non-anxious controls (NACs). In this visual working memory (VWM) task, each trial began with the presentation of a display containing images of 16 different objects (see Figure III.1B). After a delay of 500 ms, 5 of the 16 images were cued, one after another, each one for 150 ms. The cueing was achieved by enhancing the brightness of the background of the image from gray to white (see Figure III.1B). Directly after the cueing sequence, one of the 16 display items was hidden by a gray square and thereby probed in an immediate memory test (see Figure III.1C). The observers’ task was to report the identity of the now hidden object. The critical feature of this experiment was that one of the images depicted a spider, the remaining images showed neutral and positive objects. On each trial, the spider image could be one of the five cued ones, one of the remaining eleven uncued images within the display, or it was not presented at all on this trial. Moreover, the spider image or any of the other images could be the probed item. Accuracy of memory for the probed items was measured, and analyzed depending on their position within the cue string and their emotional valence (spider vs. non-spider). This task proved to be very versatile for several reasons: First, the use of pictorial rather than verbal materials enhances the ecological validity of the experiment. Second, the rapid cueing procedure allows to control VWM contents without influences of verbal working memory. Third, the task allows to test immediate VWM with little interference from long-term memory because only one item is probed directly after the cueing sequence. Fourth, the task enables us to test whether the serial position effects found for threatening items (e.g., Irwin & Zelinsky, 2002; Wolfe et al., 2006) occur in the same way for threatening items, or whether these items are preferably memorized. Fifth, it is possible to assess the impact of a threatening item on memorization of the items cued directly before or afterwards, determining retroactive and proactive interference by threat. Sixth, the task allows to investigate how participants process threatening items that are task-irrelevant (because they are not cued), but which compete for attention with the task-relevant images of the cue string. The latter aspect, competition for attention by multiple stimuli, has been identified as an important prerequisite for the occurrence of attentional biases in anxiety disorders (e.g., Mathews & Mackintosh, 1998; Rinck, Reinecke, Ellwart, Heuer, & Becker, 2005). Finally, the task might also shed some light on the debate whether attentional biases in anxiety disorders are based on faster engagement of attention to feared stimuli (e.g., Williams et al., 1997) or on slower disengagement of attention from threat (Fox, Russo, Bowles, & Dutton, 2001). Any group differences regarding memory for uncued spider images would support the assumption of spontaneous engagement; any group differences in proactive interference with memorizing images following a spider image would support the
III. PAPER 2
63
notion of slower disengagement from threat. To the best of our knowledge, the experiment by Reinecke et al. (2006) is the only one which applied the task of Wolfe et al. (2006) to the study of VWM biases in specific fears and phobias. In this study, we did indeed find enhanced VWM for cued spider images, and the temporal position of the spider image within VWM was nearly irrelevant: For spiders, accuracy was constantly high at all cue positions, yielding a flat serial position curve. Moreover, this was true for both SFs and NACs. Similarly, we observed that a spider image in the cue string interfered with encoding of the following item, again in both groups. On the other hand, only spider fearfuls showed a memory advantage for uncued spiders, that is, spider images that were actually not relevant to the task. Surprisingly, this advantage for uncued spiders was ”free of charge”, that is, it was not accompanied by any memory disadvantage for cued items. In sum, the study by Reinecke et al. (2006) revealed VWM advantages for cued spiders in both groups, and a disorder-specific advantage for uncued spiders in spider fearfuls. Although the results of this study were clear-cut, there are several limitations to their interpretation. First, we attempted to replicate the procedure used by Wolfe et al. (2006) as closely as possible. Therefore, on each trial the matrix of 16 objects was already visible during an initial orientation time of 500 ms, prior to the begin of the cueing sequence. However, phobic participants tend to show a quick, involuntary allocation of attention to threatening stimuli (see Mathews & MacLeod, 2005; Rinck & Becker, 2005; or Williams et al., 1997). Possibly, the ”gratis” memory enhancement for uncued spiders in SFs occurred because SFs detected the spider during this initial interval already, instead of during the time needed for cueing. Moreover, the lack of group differences in memory for cued spiders may also be due to this long initial orientation time, because NACs may have used specific encoding strategies during this time to make up for any advantage that SFs might have. In any case, it is obvious that the initial interval of 500 ms leaves room for uncontrolled pre-processing of the items contained in the matrix of 16 objects. Second, it could be argued that SFs might show a memory preference for any threatening image, not only for spiders. In the experiment by Reinecke et al. (2006), only spider images were presented, and not any other type of negative stimuli. Therefore, it can not be determined whether the observed effects are disorder-specific and limited to the combination of spider images and spider fearfuls, or whether they would be found for any type of negative item. In fact, there is reason to expect that effects found for spiders by Reinecke et al. (2006) might also occur for other negative items, particularly for other threatening animals. For instance, Becker and Rinck (2004) found that spider phobics showed comparable effects for spiders and similar animals such as beetles. Surprisingly,
III. PAPER 2
64
this interpretational problem has been largely neglected in studies of attentional biases in spider phobia, as most experiments employed only one type of negative stimulus. An exception is the study of attentional biases by Oehman, Flykt, and Esteves (2001) which indeed revealed that all participants showed faster detection of evolutionary relevant materials such as snakes and spiders. Moreover, this effect was enhanced when the objects were particularly threatening, that is, spiders for spider phobics and snakes for snake phobics. To test the weight of these alternative explanations and potential limitations, we conducted two experiments based on the methodology introduced by Wolfe et al. (2006). Experiment 1 was a nearly exact replication of Reinecke et al. (2006), except that the initial orientation time was shortened to 150 ms. For Experiment 2, we adopted the temporal parameters of Experiment 1, but the negative stimulus was a snake instead of a spider. In both experiments, we tested SFs and NACs, and in addition, the participants of Experiment 2 were not afraid of snakes. This way, we were able to address the following questions: Are the VWM effects found by Reinecke et al. (2006) indeed related to visual working memory biases? Or are they due to an artefact emerging from the 500 ms initial orientation time? Are the VWM effects material-specific and disorder-specific, and therefore occur only for feared stimuli? Or would other negative stimuli lead to the same pattern of results, and therefore reflect some evolutionary relevance or psychophysical salience effect?
Experiment 1: VWM for Spiders in Spider Fearfuls Introduction Given the evidence suggesting a quick attentional shift towards threatening stimuli (e.g., Oehman et al., 2001; Rinck & Becker, 2006), we have to assume that in the experiment by Reinecke et al. (2006), several uncontrolled attentional processes occurred within the initial 500 ms initial orientation time. Therefore, we replicated the experiment, but shortened the initial orientation time from 500 ms to 150 ms. Pilot tests had shown that this was the shortest possible time at which participants did not miss the first item of the cueing sequence. If the seemingly cost-free memory advantage of uncued spiders in SFs was indeed based on processing of the spider image during the initial 500 ms, the advantage should be greatly reduced in Experiment 1. Consequently, SFs and NACs should not differ regarding their memory accuracy for uncued items anymore, and a memory advantage for uncued spiders should not be ”for free” anymore, that is, it should be accompanied by reduced accuracy for other items. Moreover, the fact that the two groups showed comparable effects for cued items should remain unchanged. In sum, this alternative reasoning predicts that SFs and NACs will behave more similarly in Experiment 1 than in the experiment by Reinecke et al. (2006). In contrast, if the NACs instead of the SFs used the initial 500 ms interval to strategically process the spider image, the change to a 150 ms interval should
III. PAPER 2
65
selectively deteriorate performance of the NACs. In this case, Experiment 1 should yield higher memory accuracy in SFs than NACs even for cued spider items, for which Reinecke et al. (2006) had not found any difference between SFs and NACs. Thus, this line of reasoning leads to the prediction that the differences between SFs and NACs will increase in Experiment 1 compared to the experiment of Reinecke et al. (2006). In order to test these alternative lines of reasoning, the following predictions were tested in Experiment 1: (1) Spider images are remembered better than other images, independently of their position within the visual working memory string. (2) A spider image in the cue string causes proactive interference for the item following it. (3) Spider images are accurately remembered, even when they have not been cued. (4) Presence of an uncued spider image leads to lower memory accuracy for the cued non-spider items. (5) The most critical hypothesis was that these effects are disorder-specific effects that are enhanced in the SF group, as opposed to general effects that both groups show to a similar degree.
Methods Participants
23 spider fearfuls (SFs) and 24 non-anxious controls (NACs) without any animal oriented fears participated in the experiment. A preselection of participants took place in classes at several departments of the Dresden University of Technology, using the German ”Spider Anxiety Screening” (SAS; Rinck, Bundschuh, Engler, Mueller, Wissmann, Ellwart, & Becker, 2002). Students with scores lower than 5 or higher than 14 on the first three items (max. 18) were invited for further interviews and testing. These potential participants then completed the German version of the ”Fear of Spiders Questionnaire” (FSQ; Szymanski & O’Donohue, 1995; see Rinck et al., 2002) as well as the German FDD-DSM-IV inventory (Kuehner, 1997), which is a translation of the ”Questionnaire for Depression Diagnosis” (Zimmermann, Coryell, Wilson, & Corenthal, 1986). Moreover, trained interviewers assessed the fulfillment of the DSM-IV criteria for specific phobia concerning spiders, using the International Diagnosis Checklist for DSM-IV (ICDL; Hiller, Zaudig, & Mombour, 1997) complemented by the eight-stage assessment scales of the F-DIPS (Margraf, Schneider, Soeder, Neumer, & Becker, 1996), which is the German version of the ADIS (DiNardo, Brown, & Barlow, 1994). To qualify for the SF group, candidates had to reach a minimum F-DIPS ”fear” score of 4 and a minimum ”avoidance” score of 3, as well as a minimum score of 30 in the FSQ. Eleven of the 23 SFs fulfilled all DSM-IV criteria for a specific phobia of spiders. The remaining ones met all criteria except criterion E, which requires significant impairment in everyday life. Considering the relative ease of avoiding threatening spiders in Northern Europe, not
III. PAPER 2
66
Table III.1: Questionnaire scores (means, standard deviations, t-tests) of participants in Experiment 1
Spider Fearfuls
Non-Anxious Significance of Controls t-Test (df = 45) 1.3 .001 (1.7)
SAS
17.4 (3.5)
FSQ
61.1 (17.7)
2.1 (2.9)
.001
FDD
9.0 (5.2)
7.8 (4.5)
n.s.
STAI-T
40.4 (6.9)
42.0 (7.5)
n.s.
STAI-S pre exp.
36.4 (6.3)
37.0 (4.6)
n.s.
STAI-S post exp.
37.9 (6.5)
38.1 (6.0)
n.s.
reaching this criterion is comprehensible and does not affect the questions of interest. The NAC participants were matched to the SF group with regard to age and gender. All candidates had a high school degree and were students of Dresden University of Technology. On average, the 21 female and 3 male members of the NAC group were 21.5 years old (SD = 2.0), the 20 female and 3 male SF participants had a mean age of 21.0 (SD = 1.4). All of the final 46 volunteers were without history of any psychiatric disorder and had normal or corrected-to-normal vision. All of them gave their consent after being informed of their rights as participants in experimental studies. They received course credit or a payment equivalent to EUR 5 per hour in return for their participation. Materials and apparatus
The experiment was controlled by MATLAB software using the Psychophysics Toolbox extensions (Pelli, 1997; Brainard, 1997), and presented on a gray background on 17” monitors with a 1024x768 resolution. The computer screen was placed approximately 70 cm away from the participant. Stimuli were 36 color images (side length 115 pixels) chosen by a team of experienced experts. Valence and arousal ratings of all these images were assessed with the participants of Experiment 2. They judged the valence of each image on a scale reaching from unpleasant (1) to pleasant (9), and the arousal of each image ranging from low (1) to high (9). Only the spider image was rated as at least mildly arousing. This was true for both of the groups, and significantly more so for the SFs (SF: M = 8.2, SD = 0.9; NAC: M = 5.5, SD = 0.8). The valence of the spider image was rated as neutral by NACs
III. PAPER 2
67
(M = 5.0, SD = 1.5), and as negative by SFs (M = 1.9, SD = 1.7), yielding a significant group difference. The remaining 35 non-critical images were all judged as neutral or positive and not arousing. Procedure
After completion of the State form of the German State-Trait Anxiety Inventory (STAI-S; Laux, Glanzmann, Schaffner, & Spielberger, 1981), volunteers were given written instructions regarding the experimental task. They were asked to attend to each cue string to prepare for a memory test and then make a decision to indicate the target item on a response menu. They studied a picture of the response menu including the 36 possible images for several minutes to get used to the object positions. An example trial is given in Figure III.1. Each trial started with a black fixation cross presented for 500 ms (see Figure III.1A). Afterwards, 16 images randomly chosen out of the pool of 36 images were randomly placed at the 16 positions of an invisible 4x4 grid. Within these matrices, center to center distances of the images were 120 pixels. A sample matrix with a spider is shown in Figure III.1B. After an initial orientation time of 150 ms, 5 images were cued one after another with a SOA of 150 ms (see Figure III.1B). Shortly changing the background of the object from gray to white served as the cue. Immediately after the cue sequence, a single item was masked and probed for response by a dark gray square for 150 ms (see Figure III.1C). Immediately afterwards, the stimuli matrix was replaced by a gray blank screen for 1000 ms. Then the response menu including all 36 possible objects was displayed (see Figure III.1D). Participants’ task was to report the identity of the probed object by mouse-clicking on the correct image. After the response, but not later than 3000 ms, the response menu vanished. Written feedback was provided on screen after each trial. Breaks were possible whenever needed. After the experiment participants completed the STAI-State form a second time as well as the Trait form of the German State-Trait Anxiety Inventory (STAI-T; Laux, Glanzmann, Schaffner, & Spielberger, 1981). Afterwards, all participants were debriefed regarding the study aims. Supplementary, SFs were informed about treatment possibilities for spider phobia. A complete session lasted for about 70 minutes. Design
The task is based on a 2x7x6 factorial design with the between-subjects factor ”participant group” (SFs vs. NACs) and the within-subjects factors ”spider position” (cue 1, cue 2, cue 3, cue 4, cue 5, uncued, none) and ”test position” (cue 1, cue 2, cue 3, cue 4, cue 5, uncued). ”Spider position” describes the location of the spider image: it could be one of the 5 cued images (with ”cue 1” being the first cued image and ”cue 5” the last one), it could be one of the remaining 11 uncued items in the display (”uncued”), and there were trials without any spider among the 16 images (described by the condition ”none”). Similarly,
III. PAPER 2
68
Figure III.1: Sample trial with a spider image cued and probed. Subsequently to a fixation cross (A) and the appearance of the 4x4 stimulus matrix, five items are cued one after another (for simplicity, shown simultaneously here) by the appearance of a white frame (B). Immediately afterwards, one item is hidden under a gray mask (C). Participants’ task is to specify the identity of the hidden target item in the response menu (D). Note: Actual stimuli were in color.
”test position” refers to the probed target item, which could be one of the 5 cued images or one of the 11 uncued images of the matrix. For each trial, spider position and test position were randomly chosen by the MATLAB experimental program. Each of the 42 possible combinations of spider position and test position was presented 10 times to each participant, yielding a total of 420 experimental trials, preceded by 6 practice trials. For each data point, the participants’ mean accuracy (percent correct) in identifying the probed item served as the dependent variable. In the analyses of this variable, interactions involving the factor ”group” were of main interest, because they would suggest disorder-specific effects. In contrast, main effects of spider position and test position would suggest more general effects on the attentional bottleneck.
Results Questionnaires
The mean questionnaire scores, standard deviations, and t-tests for the two participant groups are shown in Table III.1. As expected, the two groups differed only with respect to fear of
III. PAPER 2
69
spiders (see SAS and FSQ scores). Moreover, the remaining questionnaire scores fell within the normal range, giving no indication of depression, heightened trait anxiety, or heightened state anxiety. Experimental Task
Prior to the statistical data analyses, practice trials were discarded from the data set. Mean accuracy values in reporting the probed target object are shown in Table III.2 for each experimental combination of spider position and test position in both groups. According to our specific hypotheses stated above, we computed several specific analyses of the relevant experimental conditions. To avoid inflation of alpha error in these analyses, Bonferroni corrections were used where necessary. For ease of traceability of the specific analyses, the cells of Table III.2 are labeled with letter combinations (lines a to n, columns A to F). Hypotheses 1 and 5: Spider images are remembered better than other images, independently of their position within the cue string.This effect should be enhanced in SFs. To test whether the spider item received a favored role in VWM, and whether that was the case in both groups or only in SFs, we compared the two groups’ accuracy rates for spider-free trials (no spider within the display) to those for spider target trials (a spider image was cued and tested), at each test position 1 . For the accuracy scores of the relevant data points, we computed a 2x2x5 ANOVA including the between-subjects factor ”group” (SFs vs. NACs) and the within-subjects factors ”spider presence” (spider target trials vs. no-spider trials) and ”test position” (Cue 1, 2, 3, 4, 5). The results are shown in Figure III.2. All main effects reached significance, indicating that on average, SFs” memory accuracy was higher than that of NACs, F (1, 45) = 27.0, p < .001, and that images perceived just prior to the memory test were remembered better than items shown earlier in the cue string, F (4, 180) = 53.4, p < .001 (see Figure III.2). Beyond that, participants revealed better memory for spiders than for non-spider images, F (1, 45) = 97.4, p < .001. This was true for each of the five test positions, all F (1, 45) > 27.68, all p < .001. It was also true for both groups: Spiders were remembered better than non-spiders, both by SFs, F (1, 22) = 62.1, p < .001, and by NACs, F (1, 23) = 35.56, p < .001. However, this enhancement effect tended to be stronger in SFs, F (1, 45) = 3.8, p = .057. Moreover, we found that the serial position effects were weakened in spider strings compared to non-spider strings F (4, 180) = 4.40, p = .002; and this flattening of the spider 1
The spider target trials are given in the 10 cells for which test position equals spider position in Table III.2, shown in bold face (aA, bB, cC, dD, eE for each group), implying that a spider was cued and tested. The corresponding spider-free trials are those depicted in the line ”spider position = none” (cells gA, gB, gC, gD, gE for each group), implying that displays contained no spiders.
III. PAPER 2
70
Table III.2: Mean memory accuracy (percent correct) and standard deviations (in parentheses) for each experimental combination of participant group, spider position, and test position in Experiment 1. Combinations in which the spider image was probed are highlighted by boldface values
Group and Spider Position Spider Cue 1 Fearfuls
[a]
Cue1 [A] .84 (.16)
Cue2 [B] .41 (.24)
Test Position Cue3 Cue4 [C] [D] .49 .65 (.26) (.26)
Cue5 [E] .77 (.18)
Uncued [F] .37 (.34)
Cue 2
[b]
.52 (.25)
.83 (.24)
.50 (.26)
.70 (.15)
.78 (.16)
.37 (.34)
Cue 3
[c]
.50 (.29)
.39 (.28)
.80 (.24)
.61 (.21)
.81 (.15)
.38 (.35)
Cue 4
[d]
.47 (.28)
.43 (.25)
.51 (.24)
.89 (.15)
.75 (.15)
.42 (.37)
Cue 5
[e]
.46 (.26)
.46 (.26)
.50 (.24)
.66 (.16)
.97 (.06)
.37 (.34)
Uncued
[f]
.51 (.24)
.43 (.29)
.46 (.26)
.62 (.23)
.78 (.17)
.62 (.33)
None
[g]
Non-Anxious Cue 1 Controls
[a]
.50 (.25) .58 (.22)
.42 (.23) .31 (.22)
.49 (.28) .37 (.19)
.73 (.20) .66 (.16)
.82 (.17) .71 (.18)
.37 (.32) .18 (.19)
Cue 2
[b]
.45 (.24)
.46 (.22)
.34 (.19)
.61 (.23)
.74 (.17)
.18 (.20)
Cue 3
[c]
.49 (.24)
.27 (.16)
.60 (.22)
.64 (.21)
.77 (.17)
.18 (.17)
Cue 4
[d]
.43 (.24)
.29 (.17)
.38 (.14)
.73 (.17)
.73 (.15)
.15 (.16)
Cue 5
[e]
.47 (.25)
.19 (.12)
.40 (.19)
.76 (.17)
.84 (.13)
.18 (.21)
Uncued
[f]
.40 (.26)
.26 (.15)
.38 (.21)
.62 (.19)
.76 (.14)
.24 (.22)
None
[g]
.49 (.29)
.27 (.16)
.34 (.18)
.56 (.17)
.66 (.17)
.21 (.22)
III. PAPER 2
71
1 0,9 0,8 mean accuracy
0,7
spider trials
0,6 0,5 0,4 0,3
non-spider trials
0,2
SF
0,1
NAC
0 Cue 1
Cue 2
Cue 3
Cue 4
Cue 5
cue string
Figure III.2: Serial position effects: Mean memory accuracy for spider targets vs. non-spider targets, depending on group and position within the cue string.
serial position curve was particularly obvious in SFs, F (4, 180) = 26.98, p < .001 (see Figure III.2). The serial position effects shown by SFs and NACs were comparably large for non-spider trials, F (4, 180) = 1.55, p = .189, but SFs exhibited significantly smaller serial position effects than NACs for spiders, F (4, 180) = 5.51, p < .001 (see Figure III.2). However, even SFs did not memorize spiders completely independently of their position within VWM: The serial position effects were significant for all of the four curves depicted in Figure III.2, even for spiders remembered by SFs, F (4, 88) = 6.12, p < .001. In sum, we found that spider images were indeed remembered better than other images, particularly by SFs, and that the serial position effects were indeed smallest for spiders remembered by SFs. They did not disappear altogether, though. Hypothesis 2 and 5: A cued spider image causes proactive interference for the item following it, especially in SFs. To test whether enhanced memory for a cued spider image is correlated with ”costs” regarding the item following it, we compared trials where the item following a spider had to be reported with the corresponding test positions in neutral trials 2 . These data were subjected to a 2x2x4 ANOVA including the between subjects-factor ”group” (NACs, SFs) and the within-subjects factors ”item type” (item after spider, item after non-spider) and ”test 2
For the ”item after spider” condition, cells aB, bC, cD, and dE of Table III.2 were for each group. The corresponding cells of the ”item after non-spider” condition were gB, gC, gD, and gE for each group.
III. PAPER 2
72
position” (cue 2, 3, 4, 5). Accuracy averaged across the four test positions was M = 0.46 for NACs and M = 0.62 for SFs in the ”after non-spider” condition, and M = 0.50 for NACs and M = 0.57 for SFs in the ”after spider” condition. Most importantly, the significant interaction of ”item type” and ”group”, F (1, 45) = 12.7, p = .001, implied that the cued spider image affected memory for the following item differently in SFs and NACs. In SFs, the spider image lead to decreased recall of the following item, F (1, 22) = 5.83, p = .025, whereas it caused improved recall in NACs, F (1, 23) = 6.92, p = .015. To summarize, the expected proactive interference was observed in SFs, while we surprisingly found the opposite effect in NACs. Hypotheses 3, 4, and 5: Spiders are accurately remembered by SFs, even when they have not been cued, and the presence of an uncued spider leads to lower memory for the cued non-spider items. These hypotheses were tested in a set of related analyses. (A) Memory for uncued non-spiders vs. uncued spiders. We first analyzed memory accuracy for a) uncued spider items vs. b) uncued non-spider items in non-spider trials in both groups 3 . These data (see Table III.3A) were subjected to a 2x2 ANOVA, containing the factors ”group” and ”test item” (spider, non-spider). The analysis revealed that spiders were recalled better than non-spiders, F (1, 45) = 13.96, p = .001, and that SFs showed better memory than NACs, F (1, 45) = 14.14, p < .001. These effects were qualified by a significant interaction, however, F (1, 45) = 7.97, p = .007, because they were due to SFs remembering uncued spiders especially well. To supplement this interpretation, additional t-tests were calculated. Regarding uncued non-spiders, there was no difference between the two groups, t(45) = 1.91, p = .062, while SFs recalled uncued spiders better than NACs, t(45) = 4.58, p < .001. In the NAC group, memory for uncued spiders and non-spiders did not differ, t(23) < 1. In the SF group, however, there was a memory advantage for uncued spiders compared to uncued non-spiders, t(22) = 3.94, p = .001. (B) Memory to cued non-spiders vs.
uncued spiders. As mean memory accuracy
for uncued spiders was very high in the SF group (M = 0.62), we tested whether the mere content of spider images was strong enough to outweigh the effect of cueing for non-threatening items (see Table III.3B). Therefore, we compared mean accuracy for the uncued spiders to mean accuracy for cued items in non-spider trials 4 . For the relevant subset of the data, a 2x2 ANOVA was computed, involving the between-subjects factor ”group” 3 4
For a), both cells fF of Table III.2 were relevant, for b), cells gF were included. The mean accuracy in remembering uncued spider items is depicted in cell fF of Table III.2, the relevant cells for calculating the mean accuracy in remembering cued items in non-spider trials are gA, gB, gC, gD, and gE for each group.
III. PAPER 2
73
Table III.3: Memory accuracy for uncued items in Experiment 1. A) Mean memory accuracy for uncued non-spider items vs. uncued spider items. B) Mean memory accuracy for cued no-spider items vs. uncued spider items. C) Mean memory accuracy to cued vs. uncued spider items. D) Mean memory accuracy for cued non-threatening items, depending on the presence of a spider item among the non-cued items
A)
B)
C)
D)
Experimental Conditions uncued non-spider items
Group NACs SFs .21 .37 (.22) (.32)
uncued spider items
.24 (.22)
.62 (.33)
cued non-spider items
.46 (.12)
.59 (.16)
uncued spider items
.24 (.22)
.62 (.33)
cued spider items
.65 (.13)
.86 (.15)
uncued spider items
.24 (.22)
.62 (.33)
absence of an uncued spider item
.46 (.12)
.59 (.16)
presence of an uncued spider item
.48 (.10)
.56 (.19)
and the within-subjects-factor ”probe” (cued non-spider item, uncued spider item). This analysis yielded a significant interaction of both factors, F (1, 45) = 10.31, p = .002, and additional t-tests confirmed a cueing effect for NACs, who remembered cued non-spiders better than uncued spiders, t(23) = 4.62, p < .001. For SFs, however, uncued spiders were remembered just as well as cued non-spiders, t(22) = 0.40, p = .692. Thus, in SFs the threat value of the spider did indeed outweigh the effect of cueing for other items. (C) Memory for cued spiders versus uncued spiders. Analysis (B) suggests that for SFs, the threat value of the spider itself served as an exogenous cue that was as strong as the effects of the cueing procedure on non-spider images. Therefore, one might wonder whether the cueing procedure had any effect on spider images at all. To answer this question, we compared accuracy for the uncued spiders to accuracy for cued ones 5 (see 5
The mean accuracy in remembering uncued spider items is depicted in cell fF of Table III.2, the relevant cells for calculating the mean accuracy in remembering cued spider items are aA, bB, cC, dD, and eE for each group.
III. PAPER 2
74
Table III.3C), computing a 2x2 ANOVA with the factors ”group” and ”cueing status” (cued spider, uncued spider). Overall, cued spiders were remembered better than uncued ones, F (1, 45) = 113.11, p < .001. This cueing effect was stronger in NACs than in SFs (.41 vs. .24), F (1, 45) = 6.50, p = .014, but significant both for NACs, t(23) = 10.45, p < .001, and for SFs, t(22) = 5.17, p < .001. Thus, the cueing procedure had the intended effect on memory accuracy, even for spider images in SFs. (D) Distraction caused by uncued spiders. The previous analyses revealed a memory enhancement for uncued spiders in SFs. This raises the question whether this enhancement comes at the expense of cued non-spider images, or whether SFs show this advantage for uncued spiders in addition to remembering the cued items. To answer this question, we analyzed accuracy for cued non-spider items, depending on whether a spider was present among the 11 uncued items or not 6 . The relevant data (see Table III.3D) were subjected to a 2x2 ANOVA with the factors ”group” and ”presence of uncued spider” (present, not present). This analysis revealed neither an effect of ”spider presence”, F (1, 45) = 0.19, p = .666, nor an interaction, F (1, 45) = 3.24, p = .078, indicating that in both groups, accuracy for cued non-spiders was unaffected by the presence of an uncued spider. This conclusion was confirmed by t-tests, computed separately for each group (NACs: t(23) < 1; SFs: t(22) = 1.62, p = .119). Thus, we have to conclude that the improved memory of SFs for uncued spiders did not come at the expense of the cued items. Discussion In our earlier study (Reinecke et al., 2006) we found that both SFs and NACs remembered cued spider images better than cued non-negative images. This memory advantage seemed to be independent of the spider item’s serial position within VWM, as images of spiders were remembered almost equally well at all test positions. Furthermore, in both groups we observed lower memory for items following a spider image compared to items after a non-spider image and only SF showed enhanced memory to uncued spiders. The current experiment was designed to find out whether these findings might have been artefacts of the long initial orientation time of 500 ms, by shortening it to a mere 150 ms. Surprisingly, this manipulation did not decrease memory effects in the SF group. Instead, we observed changes in the effects exhibited by the NAC group. We still found memory advantages for cued spiders in both groups, however, this advantage was stronger in SFs. While memory for cued spiders was still almost independent of test position in SFs, NACs now showed clear serial position effects for both spider and non-spider items. Only SFs re6
For the condition ”presence of uncued spider”, the cells fA, fB, fC, fD, and fE of Table III.2 were relevant for each group. For the condition ”no spider presence”, we calculated with cells gA, gB, gC, gD, gE for each group.
III. PAPER 2
75
membered cued spider items with nearly constant, high accuracy. Interestingly, we now also observed changes regarding proactive interference of the cued spider image with encoding of the following item: NACs did not show interference anymore. Finally, we replicated the most important result reported by Reinecke et al. (2006): Even with the short initial orientation time of 150 ms, SFs exhibited an impressive memory advantage for uncued spiders. To summarize, we have to conclude that NACs, rather than SFs, used strategic processes during the 500 ms interval of Reinecke et al. (2006). For them, the change to 150 ms yielded differences in memory accuracy, while performance of the SFs remained largely unaffected. The latter finding suggests that the effects observed in SFs are mainly based on automatic processes rather than strategic processes or artefacts of the procedure.
Experiment 2: VWM for snakes in spider fearfuls Introduction Experiment 1 revealed that the VWM advantage of spiders in spider fearfuls is not due to the 500 ms initial orientation time. It is still unclear, however, whether the advantage is disorder-specific, or whether SFs would show a VWM advantage for any kind of negative materials. If the latter was true, it is most likely that the advantage would also occur with other evolutionary relevant animals such as snakes (see Oehman et al., 2001). Experiment 2 was designed to answer this question. It was identical to Experiment 1, except that the spider image was replaced by an image of a snake. As in Experiment 1, the position of this image within the cue string was manipulated, and a group of SFs was compared to a group of NACs. In addition, both groups consisted of participants who lacked any fear of snakes. As in the previous experiment, the snake image is special in many ways compared to the remaining items, for instance in evolutionary relevance and color. However, we may assume that it is comparably special to both groups, as it is not related to a phobic disorder of the participants. Therefore, we may expect that general VWM advantages for the snake will occur in Experiment 2, while the group differences observed earlier will disappear. In particular, we tested the following hypotheses in Experiment 2: (1) Snake images will be remembered better than non-negative images in both groups, but without attenuation of serial position effects. (2) The snake image should not cause proactive interference for the item following it. (3) Memory for uncued snake images outside the cue string should not be enhanced. (4) Therefore, the presence of a snake beyond the cued set should not lead to lower memory accuracy for the cued non-snake items. (5) In general, there should not be any differences between the two groups.
III. PAPER 2
76
Methods Participants
Eighteen SFs and 19 NACs without any animal oriented fears who had not participated in Experiment 1 were tested. The prescreening, interviewing, and diagnosis was identical to the first experiment, except that the ”Snake Anxiety Screening” questionnaire (SCANS; Reinecke, Becker, & Rinck, submitted-b) was added to the questionnaires. Only individuals with scores lower than 5 or higher than 14 on the SAS, and scores lower than 5 on the SCANS participated in the experiment. On average, the 17 female and 2 male members of the NACs group were 21.1 years old (SD = 2.7), the 16 female and 2 male participants of the SFs group had a mean age of 20.7 (SD = 1.8). All of the final 37 volunteers were without history of any psychiatric disorder and had normal or corrected-to-normal vision. All of them gave their consent after being informed of their rights as participants in experimental studies. They received course credit or a payment of EUR 5 per hour in return for participation. Materials, apparatus, design, and procedure
These were identical to those of Experiment 1, except that the spider image used in Experiment 1 was replaced by an image of a snake with the same high contrast. The experiment was based on the same 2x7x6 factorial design as the first experiment, except that ”spider” was replaced by ”snake”. Where appropriate, the present data of the SF group were also analyzed together with the corresponding data of Experiment 1, in order to test whether the factors of interest would interact with the type of threat stimulus (Exp.1: spider, Exp.2: snake). This would indicate that the corresponding effects differ significantly between experiments, and therefore between spiders and snakes. Moreover, after Experiment 2, the participants rated all images from Experiments 1 and 2, including the spider image and the snake image, regarding valence and arousal. Both groups judged the snake image to be neutrally valenced (SF: M = 4.9, SD = 1.6; NAC: M = 5.2, SD = 2.1) and mildly arousing (SF: M = 6.1, SD = 0.9; NAC: M = 5.5, SD = 0.9). Regarding the snake image, there were no rating differences between the two groups.
Results Questionnaires
The mean questionnaire scores, standard deviations, and t-tests for the two participant groups are shown in Table III.4. As expected, SFs and NACs differed only with respect to fear of spiders (see SAS and FSQ scores), and neither of them showed fear of snakes (SCANS). Moreover, the remaining questionnaire scores fell within the normal range, giving no indication of depression, heightened trait anxiety, or heightened state anxiety.
III. PAPER 2
77
Table III.4: Questionnaire scores (means, standard deviations, t-tests) of participants in Experiment 2
Spider Fearfuls
Non-Anxious Significance of Controls t-Test (df = 35) 0.5 .001 (0.7)
SAS Spider
19.1 (3.8)
SCANS Snake
2.4 (2.8)
1.3 (2.0)
n.s.
FSQ
69.1 (21.2)
1.8 (2.3)
.001
FDD
8.2 (4.1)
5.5 (4.0)
n.s.
STAI-T
39.7 (7.9)
35.5 (8.2)
n.s.
STAI-S pre exp.
36.1 (6.7)
32.4 (5.8)
n.s.
STAI-S post exp.
35.9 (5.6)
31.3 (7.7)
n.s.
Experimental Task
Data aggregation and analysis were identical to the experiment described before. Table III.5 shows the mean accuracy in memorizing the probed target object, separately for each experimental combination of snake position, test position, and participant group. Hypotheses 1 and 5: Snake images are remembered better than other images by both groups, without differences between the two groups and without reduction of serial position effects. Similar to Experiment 1, we compared the two groups’ accuracy rates for snake-free trials (no snake within the display) to those for snake target trials (a snake image was cued and tested), at each test position 7 . The relevant subset of the data was analyzed by a 2x2x5 ANOVA, involving the between-subjects factor ”group” (SFs vs. NACs) and the within-subjects factors ”snake presence” (snake target trials vs. no snake trials) and ”test position” (Cue 1, 2, 3, 4, 5). Figure III.3 is depicting the results. The analysis yielded a highly significant main effect of ”test position”, F (4, 140) = 55.87, p < .001, and no significant interaction of ”test position” with ”group”, F (4, 140) < 1, implying that in 7
The snake target trials are given in the 10 cells shown in bold face in Table III.5 (aA, bB, cC, dD, eE for each group). The corresponding snake-free trials are those depicted in cells gA, gB, gC, gD, gE for each group).
III. PAPER 2
78
Table III.5: Mean memory accuracy (percent correct) and standard deviations (in parentheses) for each experimental combination of participant group, snake position, and test position in Experiment 2. Combinations in which the snake image was probed are highlighted by boldface values
Group and Snake Position Spider Cue 1 Fearfuls
[a]
Cue1 [A] .50 (.24)
Cue2 [B] .29 (.18)
Test Position Cue3 Cue4 [C] [D] .38 .62 (.15) (.16)
Cue5 [E] .73 (.16)
Uncued [F] .16 (.10)
Cue 2
[b]
.39 (.23)
.53 (.26)
.42 (.21)
.64 (.17)
.78 (.15)
.14 (.10)
Cue 3
[c]
.45 (.20)
.32 (.14)
.52 (.19)
.63 (.18)
.77 (.17)
.15 (.13)
Cue 4
[d]
.49 (.21)
.30 (.16)
.31 (.10)
.78 (.14)
.79 (.10)
.10 (.19)
Cue 5
[e]
.39 (.16)
.28 (.20)
.42 (.19)
.61 (.21)
.83 (.15)
.11 (.09)
Uncued
[f]
.40 (.21)
.29 (.16)
.39 (.20)
.63 (.20)
.69 (.24)
.21 (.21)
None
[g]
Non-Anxious Cue 1 Controls
[a]
.45 (.16) .56 (.18)
.28 (.19) .30 (.17)
.44 (.14) .40 (.19)
.63 (.23) .61 (.20)
.72 (.21) .71 (.13)
.15 (.11) .16 (.20)
Cue 2
[b]
.41 (.20)
.47 (.24)
.39 (.20)
.66 (.16)
.70 (.14)
.14 (.20)
Cue 3
[c]
.40 (.22)
.37 (.20)
.57 (.20)
.64 (.14)
.68 (.24)
.20 (.20)
Cue 4
[d]
.40 (.21)
.34 (.18)
.41 (.16)
.73 (.17)
.72 (.18)
.15 (.21)
Cue 5
[e]
.43 (.21)
.28 (.23)
.44 (.16)
.65 (.13)
.84 (.15)
.13 (.17)
Uncued
[f]
.37 (.21)
.27 (.17)
.44 (.19)
.64 (.15)
.73 (.16)
.21 (.16)
None
[g]
.41 (.24)
.32 (.14)
.37 (.12)
.62 (.15)
.69 (.19)
.17 (.21)
III. PAPER 2
79
both groups, recently cued items were recalled better than items cued earlier. This was true for both snake strings and non-snake strings in both groups, as there was neither an interaction of the factors ”snake presence” and ”test position”, F (4, 140) = 1.34, p = .257, nor a three-way interaction, F (4, 140) = 1.83, p = .126. Additionally, there was a highly significant main effect of ”snake presence”, F (1, 35) = 37.13, p < .001, but neither a main effect of ”group”, F (1, 35) < 1, nor an interaction of both factors, F (1, 35) < 1, indicating that both groups remembered snakes better than non-snake images. This was true for all of the five test positions, all F (1, 35) > 6.42, all p < .05. To summarize, snakes were indeed memorized better than non-snake items, and this advantage was a constant amount at all cue positions, such that serial position effects within the snake cue string were very similar to those observed for non-snake strings. These effects occurred similarly in both groups, and neither group showed better memory.
1 0,9 0,8 mean accuracy
0,7 0,6
snake trials
0,5 0,4 0,3
non-snake trials
0,2
SF
0,1
NAC
0 Cue 1
Cue 2
Cue 3
Cue 4
Cue 5
cue string
Figure III.3: Serial position effects in Experiment 2: Mean memory accuracy for snake targets vs. non-snake targets, depending on group and position within the cue string
To test whether the effects found here for snakes differ from those found for spiders in Experiment 1, an additional joint analysis was computed. In this analysis, only trials in which a critical item was probed and tested were included. The analysis confirmed that SFs showed better memory for spiders than snakes, F (1, 39) = 26.95, p < .001, while there was no such difference for NACs, F (1, 41) < 1, yielding a significant three-way interaction, F (1, 80) = 12.67, p < .001. Moreover, SFs showed significantly smaller serial position
III. PAPER 2
80
effects for spiders than for snakes, F (4, 156) = 5.42, p < .001, while the position effects were comparable in the NAC group, F (4, 164) < 1, again yielding a significant three-way interaction, F (4, 320) = 2.43, p < .05. Hypotheses 2 and 5: No proactive interference by cued snake images. As in Experiment 1, we compared the memory accuracy for items following a cued snake image to memory accuracy for the corresponding test positions in non-snake trials 8 . These data were subjected to a 2x2x4 ANOVA including the factors ”group”, ”item type” (item after snake, item after non-snake), and ”test position” (cue 2, 3, 4, 5). Accuracy averaged across the four test positions was M = 0.50 for NACs and M = 0.52 for SFs in the ”after non-snake” condition and M = 0.51 for NACs and M = 0.53 for SFs in the ”after snake” condition. As these values indicate, there was not a trace of proactive interference: On average, memory for items following the snake (M = .52) was almost identical to memory for the control items (M = .51), F (1, 35) < 1. Hypotheses 3, 4, and 5: No enhanced memory for uncued snake images in any of the groups. The presence of uncued snakes will not cause lower memory accuracy for the cued non-snake items. These hypotheses were tested in a set of analyses corresponding to the ones of Experiment 1. (A) Memory for uncued snakes vs. uncued non-snakes. To test whether memory for snakes beyond the cued set is improved, and whether there are differences between SFs and NACs, mean memory accuracy for uncued snake items was compared to mean accuracy for non-snake items beyond the cued set 9 . The same 2x2 ANOVA as in the first experiment including the factors ”group” and ”probe” (snake, non-snake) was performed. Regarding uncued no-snake items, NACs’ mean accuracy was M = .17 (SD = .21), SFs reached M = .15 (SD = .11). Uncued snake items were memorized with mean accuracy of M = .21 (SD = .16) by NACs, and M = .21 (SD = .21) by SFs. The analysis revealed that neither a main effect nor the interaction were significant, all F (1, 35) < 2.22, p > .14, suggesting that neither group showed a memory advantage for uncued snakes. A joint analysis of these data with the corresponding ones of Exp. 1 revealed that the strong enhancement in the memorization of uncued spiders in Experiment 1 does indeed reflect disorder-specificity, F (1, 80) = 11.83, p = .001: SFs showed better memory for uncued spiders than for uncued snakes, t(39) = 4.49, p < .001; whereas NACs did not, t(41) < 1. 8
For the ”item after snake” condition, we calculated with cells aB, bC, cD, and dE of Table III.5 in each group. The corresponding cells of the ”item after non-snake” condition were gB, gC, gD, and gE for each group. 9 The mean memory for uncued snake items is depicted in cell fF of Table III.5 for each group. Cell gF of each group was included for uncued non-snake items.
III. PAPER 2
81
(B) Distraction caused by uncued snakes. To test whether a snake item beyond the cue string interferes with memorization of the task-relevant items of the cued set, we compared mean accuracy for cued items in non-snake trials to mean accuracy for cued items in trials with an uncued snake 10 . A 2x2 ANOVA with the factors ”group” and ”presence of uncued snake” (present, not present) was computed, with M = .48 (SD = .10) for NACs and M = .50 (SD = .10) for SFs for trials without a snake present, and M = .49 (SD = .10) for NACs and M = .48 (SD = .11) for SFs for trials with a snake item present. This analysis yielded no significant effect, all F (1, 35) < 1.67, p > .20. Thus, in both groups memory for cued items was unaffected by the presence of an uncued snake image, just as it had been unaffected by the presence of an uncued spider image in Experiment 1, F (1, 80) = 2.23, p = .139. Discussion In Experiment 2, cued snake images were remembered better than cued non-snake images. This was the only effect that replicated the results of the first experiment. Unlike Experiment 1, the memory advantage occurred in both groups, and it was approximately the same at all serial positions within VWM, such that serial position effects did not vanish in strings including snake images. Beyond that, processing of a cued snake image did not interfere with memorization of the following item. In contrast to the cued snake images, uncued ones were not special at all. They were memorized as well as other uncued items, and they did not interfere with memorization of the cued items. Most importantly, all of these results were true for both groups to a similar degree. Unlike the spider image of Experiment 1, the snake image presented in Experiment 2 did not yield disorder-specific effects in SFs; and snakes were similarly special for SFs and NACs. This may reflect the evolutionary relevance that snakes have for all humans, independent of their fear of spiders.
General discussion In two experiments, we studied visual working memory for negative materials in individuals suffering form severe fear of spiders. The two experiments are based on a previous study by Reinecke et al. (2006), which indicated that compared to other images, spider images enjoy several processing advantages in VWM. Regarding task-relevant images that had to be retained in VWM, these advantages occurred in both spider fearfuls and non-anxious controls. For task-irrelevant images, in contrast, only spider fearfuls showed better memory for the spider image than for other ones. With the two experiments reported here, we clarified and extended the earlier results of Reinecke et al. (2006). In Experiment 1, the long initial orientation time of 500 ms was replaced by a mere 150 ms. In addition, in Experiment 2 the 10
For the condition ”presence of uncued snake”, for each group the cells fA, fB, fC, fD, and fE of Table III.5 were included. For the control condition, we calculated with cells gA, gB, gC, gD, gE for each group.
III. PAPER 2
82
Table III.6: Comparison of results observed in three different experiments (Y = yes, N = no)
Memory advantage for cued critical item Extra advantage in SFs
Reinecke et al. (2006) Experiment 1 Experiment 2 500 ms, spider 150 ms, spider 150 ms, snake Y Y Y (SF, NAC) (SF, NAC) (SF, NAC) N
Y
N
Weakening of position effects for critical item
Y (SF, NAC)
Y (SF)
N
Proactive interference by critical item
Y (SF, NAC)
Y (SF)
N
Memory enhancement for uncued critical item
Y (SF)
Y (SF)
N
Distraction of cued items by uncued critical item
N
N
N
spider image was replaced by an image of a snake. Table III.6 gives a comparative summary of the main results of the earlier experiment and the two experiments reported here. In Experiment 1, we mostly replicated our earlier results (Reinecke et al., 2006). However, the reduction of the initial processing time prior to the cueing sequence lead to a more precise distinction between SFs and NACs. Contrary to our original assumption, SFs did not seem to strategically focus on the spider image during the first 500 ms. Instead, it seems that this time was used by NACs to strategically focus their attention on the spider image, in order to improve their performance on trials involving a probed spider image. As in the Reinecke et al. (2006) experiment, spiders were memorized better than non-spider items by both groups. However, the advantage was stronger in SFs than NACs, and serial position effects were reduced only in SFs, not in NACs. This way, compared to our first application of the task, the initial time of only 150 ms reduced the memory advantages for spiders in NACs, not in SFs. Another new observation was that only in the SF group did encoding of a cued spider item negatively influence encoding of the item following it (proactive interference). Surprisingly, SFs were able to maintain their strong memory advantage for uncued spiders without any costs regarding cued items. This finding was observed by Reinecke et al. (2006) and in Experiment 1, suggesting that it is not based on strategic pre-processing of the spider image before the cue sequence starts.
III. PAPER 2
83
In Experiment 2, cued snake items were remembered better than non-snake items. This advantage occurred to a very similar degree in both SFs and NACs. Furthermore, serial position effects in cue strings containing snakes were very similar to those in non-snake strings in both groups. Beyond this general advantage of cued snakes, snake items were not special to SFs in any way: They did not cause proactive interference, and memory for uncued snakes was no better than memory for other uncued items. This indicates that the group differences observed in our first study and in Experiment 1 are spider-specific: SFs only show memory advantages compared to NACs with spider materials, but not with snake materials. Compared to other pictures, snake images are special, but they are so to the same degree for SFs and NACs, and only spider images are truly threatening for SFs. What do these results tell us about the impact of threat on the attentional bottleneck and visual working memory? On the one hand, we can draw some general conclusions that are true for both participants groups. In general, the laws accounting for the attentional bottleneck and for VWM, as for instance formulated by Luck and Vogel (1997), Irwin and Zelinsky (2002), or Wolfe et al. (2006), are affected by the general threat value of an item. First, one can presume that stimuli of evolutionary importance are preferably selected to enter these capacity-limited instances. In both experiments reported here, participants showed better working memory for spiders and snakes, even when these were not feared. Interestingly, this advantage was not related to proactive interference when the item was not at the core of an individual’s fears. That is, non-phobics seem to show better working memory for spider and snake pictures without being distracted by them, which might reflect evolutionary relevance: quickly recognizing danger and quickly reacting to it, instead of hesitating. Our results are highly compatible with earlier ones suggesting a general processing advantage for evolutionary relevant materials which signal danger (e.g., Oehman et al., 2001; Cook & Mineka, 1991): The quick detection of threat ensures a life-saving flight-or-fight reaction. Referring to the preparedness theory of phobia acquisition (Seligman, 1971), it may be argued that humans are predisposed to be alert of situations and animals that, during early stages of evolution, endangered survival. In fact, evolutionary ”older” stimuli (e.g., spiders, snakes, heights) are more often at the core of phobic fears than modern, truly dangerous stimuli (e.g., cars, weapons; see McNally, 1987). However, this preparedness effect was not stronger in phobics than in general. Future research will have to determine the exact factors contributing to this general processing advantage of spiders and snakes over neutral and positive objects. It may well be that salient visual features of the images (e.g., the shape or color of the animals) contribute to the effects. This alternative explanation is difficult to exclude because spiders and snakes necessarily look different from other animals and objects. Thus, the visual features of threatening images can never be fully equated with those of other objects. However, it should be possible to control for the most salient features, such as the general shape or the color of the spiders and objects.
III. PAPER 2
84
In addition to the general effects, the reduction of the initial orientation time to 150 ms lead to stronger threat-specific effects which occurred only in the spider fearful participants. As already found in our earlier study, only SFs showed a memory advantage for uncued spider items, and reducing the initial orientation time to 150 ms did not remove this effect. Second, we now found stronger group differences regarding cued spider images: a) Cued spiders were now better memorized in the SF group, as the reduction of the initial orientation time lead to a loss of the memory advantage in the NAC group. b) The near independence of the spider item’s position within visual working memory reoccurred only in SFs. c) These disorder-specific advantages came at the expense of encoding the following item, only in SFs, and only after spider images. In summary, the conditions of Experiment 1 revealed threat-specific effects in VWM, which occurred only when SFs processed spider materials. In contrast to the findings by Reinecke et al. (2006), Experiment 1 yielded these threat-specific effects for both cued and uncued spider images. In addition, Experiment 2 showed that these threat-specific effects were indeed related to the items’ individual threat value: SFs did not show these effects for snake images. Several conclusions can be drawn from these findings. First, our data support both the assumption of enhanced detection of threat by phobics (e.g., Williams et al., 1997) and the hypothesis of aggravated disengagement from threat postulated by Fox et al. (2001). Enhanced detection of threat is supported by the strong memory enhancement for uncued spiders, which occurred in the SF group only. Future research employing eye tracking techniques should be used to verify whether SFs do have time to fixate an uncued spider image during the cueing sequence, or whether they are able to process it parafoveally. Slower disengagement from threat is supported by the finding that only SFs showed proactive interference caused by a cued spider item: Only in the SF group was memory accuracy for the item following the spider image lowered, presumably because SFs found it difficult to disengage attention from the spider. This explanation might also be tested by eye tracking techniques, for instance by measuring whether SFs show fixations on the location of a cued spider which last longer than the 150 ms cueing time. The fact the we found both enhanced detection of threat and slowed disengagement from it in SFs is in line with the results of Rinck et al. (2005) and others. Our data do not allow, however, to test the related assumption that fearfuls avoid deeper elaboration of threatening stimuli (e.g., Williams et al., 1997), as we did not probe long-term memory. Nevertheless, we may conclude that ”deeper elaboration” starts beyond working memory: Our data suggest that threatening materials are favorably processed in VWM, while avoidance might come into play at a later processing stage. Further research is needed to exactly define the processing level at which avoidance begins.
III. PAPER 2
85
Another conclusion to be drawn from the present results is that the disorder-specific VWM effects described above are materials-specific as well. Group differences were only observed with a spider as the critical image, not with snake images. Therefore, the group differences found in the spider conditions may indeed be attributed to the individual threat value of the spider image. This finding strengthens the assumption of Cave and Batty (2006) that specific anxiety representations are more highly activated in anxiety patients, and that the perception of threat items is therefore improved by the individuals’ numerous experiences of searching for the feared objects. To summarize, the two experiments presented here add to the literature on cognitive biases in anxiety by shedding light on the ”missing link” between attention and long-term memory, that is, working memory. Together with the results reported by Reinecke et al. (2006), the present data indicate that stimuli with an evolutionary threat value, such as spiders and snakes, enjoy a general processing advantage in human visual working memory. Moreover, these stimuli exhibit additional disorder-specific VWM advantages when processed by individuals for whom they are highly threatening, such as spiders are for spider phobics. In this case, even threat stimuli that are task-irrelevant seem to be processed extremely efficiently in VWM. Finally, the present study demonstrates that the promising new working memory paradigm introduced by Reinecke et al. (2006) may be a very useful tool for experimental psychopathology research, yielding reliable and replicable effects of stimuli on human visual working memory.
IV. Paper 3: Treatment Sensitivity of Strategic vs. Automatic Visual Working Memory Biases in Fear of Spiders
Abstract We investigated whether disorder-specific visual working memory (VWM) biases in spider phobia were modifiable through cognitive-behavioral treatment. Twenty-six spider fearfuls were tested three times for self-reported anxiety, behavior in approach tests, and a VWM task. Half of the participants received treatment after the first test, the other half after the second test. In the VWM task, a variety of items were displayed, cued, and later tested for memory. One of the images was a spider, which was either cued or uncued. We tested memory accuracy depending on cue status and valence of the items. Significant treatment-induced reductions of VWM biases were found for uncued, but not for cued spiders. Moreover, the reduction was prone to re-occur at follow-up testing. Introduction Cognitive models of anxiety postulate that cognitive biases are relevant for the etiology and maintenance of anxiety disorders by keeping fear cues salient (for a review, see Merckelbach, de Jong, Muris, & van den Hout, 1996). Following these models, specific anxiety disorders are associated with disorder-specific alterations of attention and memory. Regarding attentional biases in specific phobias, current research coherently suggests a fast, automatic allocation of attention to the threatening stimulus and a distraction of attention from other stimuli present at the same time (for a review, see Mathews & MacLeod, 2005). With regard to memory biases in specific anxiety, final conclusions are yet not possible. Some of the studies that investigate long-term memory biases do find enhanced memory for threatening stimuli in anxious participants, some do not (for a review, see Williams, Watts, MacLeod, & Mathews, 1997). Williams et al. (1997) try to explain this phenomenon by the depth of elaboration required by the task: Anxious participants indeed show vigilance, that is, a fast shift of attention to threat stimuli, but also tend to avoid threat, that is, refuse to deeply elaborate threatening stimuli.
86
IV. PAPER 3
87
Recently, we therefore suggested to investigate visual working memory (VWM) biases in anxiety, as this processing stage does not require elaboration (Reinecke, Rinck, & Becker, 2006; Reinecke, Becker, & Rinck, submitted-a). In these studies, we asked spider fearfuls and control participants to memorize 5 images out of a 16-item display. The 5 images were cued one after another for 150 ms each. All pictures were mostly neutral or positive. One item, however, depicted a spider, which could be one of the 5 cued ones, one of the 11 uncued items of the display, or not displayed at all. In both studies, we found some general VWM advantages for cued spiders, reflected in higher memory for cued spiders compared to non-spider items in both groups. More importantly, we also found disorder-specific VWM biases, mostly reflected in a strong memory enhancement for uncued spiders in spider fearfuls. The difference between cued and uncued spiders is of theoretical importance because it reflects the difference between controlled versus automatic cognitive processes. Effects for cued spiders largely reflect controlled processes, here the use of VWM resources according to the experimental instructions, which do not seem to differ much between spider fearfuls and non-fearfuls. In contrast, disorder-specific biases for uncued spiders largely reflect automatic processes, here the allocation of attention to task-irrelevant, potentially distracting threat stimuli. Indeed, research on attentional biases in phobias has shown that it is mainly the automatic processes which are biased in phobics and highly fearful individuals (for a review, see Mathews & MacLeod, 2005). Given these findings and the prediction that cognitive biases are involved in the maintenance of anxiety disorders, an important further question is whether the biases are modifiable by treatment. In particular, when cognitive-behavioral therapy successfully reduces subjective fear as well as avoidance behavior, are these changes related to changes in cognitive biases as predicted by cognitive models of anxiety (e.g., Beck & Clark, 1997; Young, 1999; for a review see Merckelbach et al., 1996)? Studies investigating the neurochemistry of anxiety suggest strong associations between changes in experiences and cognitions on the one hand and neurochemical parameters on the other hand. A study by Mogg, Baldwin, Brodrick, and Bradley (2004), for instance, revealed the modifiability of disorder-specific interpretational biases in patients with generalized anxiety disorder by the application of SSRI. Following a somewhat different approach, Gaab, Jucker, Staub, and Ehlert (2005) found that disorder-related elevated cortisol levels in spider fearfuls during confrontation with spiders were reduced by cognitive-behavioral treatment. In addition, several PET studies found evidence for effects of psychotherapy on metabolic changes in specific brain regions in specific mental disorders, such as obsessive-compulsive disorder (Schwartz, Stoessel, Baxter, Martin, & Phelps, 1996) or specific phobia (Fredrikson, Wik, Greitz, Eriksson, Stone-Elander, Ericson, & Sedvall, 1993). In an fMRI study of neurobiological effects of cognitive-behavioral therapy on the neural correlates of spider phobia, Straube and colleagues (Straube, Glauer, Dilger, Mentzel, & Miltner, 2006) demonstrated that brain
IV. PAPER 3
88
regions specifically associated with spider phobia are not overly activated anymore after successful treatment (see also Paquette, Levesque, Mensour, Leroux, Beaudoin, Bourgouin, & Beauregard, 2002). Importantly, these attenuations were only observed in treated phobics, but not in a phobic waiting-list group who was also tested twice. If psychotherapy is able to modify the neural correlates of fear, it should also be able to reduce or even erase the cognitive biases that anxiety patients exhibit. Indeed, several studies investigating the modifiability of cognitive biases in anxiety disorders provide evidence that successful cognitive-behavioral therapy is related to changes in cognitive processing. This is true for studies addressing biased attention to threat (generalized anxiety disorder: Mogg, Bradley, Millar, & White, 1995; spider phobia: van den Hout, Tenney, Huygens, & de Jong, 1997), biased automatic threat associations (spider phobia: Teachman & Woody, 2003), and interpretation biases (panic disorder: Westling & Oest, 1995; social phobia: Franklin, Huppert, Langner, Leiberg, & Foa, 2005). However, these studies did not include a waiting-list group of patients who were also tested twice. Therefore, the studies cannot rule out that the changes observed in the treatment groups were mere practice effects, and the claims that cognitive biases can be modified through therapy are not sufficiently supported. In contrast, the few studies that included an adequate control group design reported similar changes in the patient treatment group and the patient waiting group. This was true both for attentional biases measured with an emotional Stroop task (spider phobia: Thorpe & Salkovskis, 1997; Watts, McKenna, Sharrock, & Tresize, 1986) and biased associations assessed with an implicit association task (spider phobia: Huijding & de Jong, in press). To summarize, there is first evidence that successful psychotherapy not only influences self-report and behavior, but also the neuroendocrinology and the metabolic characteristics of brain regions associated with anxiety disorders. However, research addressing the modifiability of cognitive biases through psychotherapy is still insufficient and incomplete. One obvious deficiency is that, to our knowledge, so far no study investigated the malleability of memory biases in anxiety. A second deficiency is the lack of appropriate control groups in many of the existing studies. With the present study, we sought to contribute to reducing both deficiencies: The content gap was reduced by giving a VWM task to participants receiving treatment for spider phobia; the methodological gap was reduced by also testing a waiting-list control group of patients. Using the VWM paradigm described above, we predicted that the VWM bias to uncued spiders (which does not occur at all in healthy participants) should be removed or at least markedly reduced through successful treatment. We asked spider fearfuls to perform the task introduced in Reinecke et al. (2006; submitted-a) repeatedly before and after cognitivebehavioral treatment. Half of the patients performed two pre-tests to investigate the strength
IV. PAPER 3
89
of practice effects, and the other half had two post-tests to detect possible relapse effects. Between pre- and post-tests, they received a one-session therapy as suggested by Oest (1996), including confrontative in-vivo elements which are assumed to be the most effective tool in the treatment of specific phobias (e.g., Chambless & Gillis, 1993; Craske & Rowe, 1997; Barlow, 1988). The treatment seems to be very effective, as Oest (1996) describes treatment gain in 71-80% of cases with long-term stability and very low drop-out rates (Hellstroem & Oest, 1996). We addressed the following research questions: (1) Does successful cognitivebehavioral treatment reduce memory advantages for cued spiders? (2) Does the treatment reduce memory advantages for uncued spiders? (3) Are changes in visual working memory biases related to behavioral changes assessed by anxiety questionnaires and behavioral approach tests?
Methods Participants
Twenty-six volunteers with a specific fear of spiders participated in the study. In lectures at Dresden University of Technology and by newspaper articles, we recruited interested individuals who judged themselves as spider fearful and wanted to participate in a training to reduce their fear. Potential participants suffering from panic disorder, depression, psychosis, or severe heart problems were excluded from the study. Trained interviewers assessed the existence of a depression or panic disorder by using the International Diagnosis Checklist for DSM-IV (ICDL; Hiller, Zaudig, & Mombour, 1997), and they screened participants for physical health problems that might require exclusion from the study. A short screening was also conducted at the beginning of each testing session to explore alcohol or drug abuse and current alcohol or drug influence. One participant had to be excluded due to heart problems, no one had to be excluded due to any of the other exclusion criteria. To be eligible for the study, participants had to fulfill at least criteria A to D of the DSM-IV criteria for a specific phobia. Criterion E, which requires significant impairment in everyday life, did not have to be fulfilled, because it is fairly easy to avoid spiders in Northern Europe. Fifteen of the participants indeed fulfilled all five criteria. The DSM-IV criteria for specific phobia was also assessed with the ICDL (Hiller et al., 1997). Participants were randomly assigned to one of two treatment groups in a multiple-baseline design. Each participant was tested three times. The time between consecutive tests was held constant at about two weeks. Participants in the waiting group (WG) received treatment between the second and the third test session, while participants in the treatment group (TG) received treatment between the first and the second test. The participants of the two groups were matched with regard to age, gender, and educational level. On average, the 11 female and 2 male participants of the WG were 32.9 years old (SD = 13.2), the 12 female and
IV. PAPER 3
90
1 male participants of the TG had a mean age of 30.0 years (SD = 11.6), t(24) = 0.59, p = .564. All volunteers had normal or corrected-to-normal vision. All of them gave written consent after being informed of their rights as participants in an experimental study. Materials and apparatus
Pictorial stimuli were the 36 color images (side length 115 pixels) previously used by Reinecke et al. (2006; submitted-a), including one negatively valenced spider image and 35 neutral and pleasant images. The experiment was controlled by MATLAB software, using the Psychophysics Toolbox extensions (Pelli, 1997; Brainard, 1997) and a 17” monitor with 1024x768 resolution. Procedure
Each participant was invited three times for data collection. In the first test session, participants were screened with regard to the exclusion criteria of the study. Subsequently, the procedure was the same in all three test sessions. Prior to the experimental task, volunteers completed two questionnaires measuring fear of spiders: the German Spider Anxiety Screening (SAS; Rinck, Bundschuh, Engler, Mueller, Wissmann, Ellwart, & Becker, 2002) and the German version of the Fear of Spiders Questionnaire (FSQ; Szymanski, & O’Donohue, 1995; see Rinck et al., 2002). After reading written instructions, participants performed the experimental VWM task. At the beginning of each trial, a black fixation cross was presented for 500 ms. Then, 16 pictures randomly chosen from the pool of 36 images were placed on the positions of an invisible 4x4 grid with center-to-center distances of 120 pixels. After 150 ms, 5 of the 16 display pictures were cued one after another with an SOA of 150 ms. Each item was cued by illuminating the background of the image for 150 ms. After the cueing sequence, one of the 16 display items was masked by a dark gray square for 150 ms. The masked item was one of the cued items in 85% of trials, and one of the remaining 11 uncued items in 15% of the trials. The critical spider item could be one of the cued ones, one of the uncued display items, or not be displayed at all. Immediately after the probe, a gray blank screen was presented for 1000 ms, followed by a response menu including all 36 images. Participants had to report the identity of the probed image by mouse-clicking on the according picture within 3 sec. Written feedback was provided immediately. Breaks were allowed whenever needed. After each experimental task, participants performed two behavioral approach tests (BATs). In the Pulse BAT, participants’ pulse was measured during four experimental phases: (1) During a first baseline phase while participants completed the Beck Depression Inventory (BDI; Beck & Steer, 1987; German version: Hautzinger, Bailer, Worall, & Keller, 1994), (2) during an expectation phase while looking at the picture of a tarantula, after having been
IV. PAPER 3
91
informed about the imminent confrontation during the third phase, (3) during an exposure phase in which the investigator quickly approached the participant with the carapace of a tarantula, and (4) during a rebound phase while completing the German version of the Body Sensations Questionnaire (BSQ; Chambless, Caputo, Bright, & Gallagher, 1984; German version: Ehlers, Margraf, & Chambless, 1993). For the current study, the pulse increase from Phase 1 to Phase 2 was used as the dependent variable. In the Speed BAT, patients were instructed to enter a room including a cage with a living tarantula on the windowsill and to approach the cage as quickly and as closely as possible. Speed in approaching the tarantula was measured. The first complete test session took about 100 minutes, the other two sessions lasted for about 80 minutes. At the end of the third test session, all participants were debriefed regarding the study aims. Treatment
The treatment was conducted by an experienced psychologist (the second author) in strong accordance with the one-session treatment for specific phobias developed by Oest (1996). The trainer was coached and continuously supervised by a licensed therapist (the fourth author) with particular experience in the therapy of anxiety disorders. The treatment was performed with groups of 4 or 5 participants and consisted of three sessions. During the first session, the patients were cognitively prepared for the exposure session. Not more than two or three days after the first session, patients completed the gradual exposure treatment for 3 or 4 hours. At the end of the session, participants were encouraged to plan and realize self-exposure exercises until the next session. During the final session, the exposure session and the self-management phase were analyzed to anchor participants’ correcting experiences with spiders. Design
Treatment design: The study followed a multiple-baseline design, with the treatment group (TG) being tested once before and twice after treatment, and the waiting group (WG) being tested twice before and once after treatment. Therefore, the independent variables were group (TG, WG) and test session (1, 2, 3). As dependent variables, several questionnaire scores, BAT parameters, and results of the VWM task were used. VWM task design: Preceded by 6 practice trials, participants performed 420 experimental trials. In these trials, the most important variations included (a) whether memory for a spider or non-spider was tested, and (b) whether the tested item had been among the 5 cued or among the 11 uncued items. Moreover, (c) if the test item had been cued, we varied whether it was the first, second, third, fourth, or fifth cued item. For each of the resulting data points, participants’ mean accuracy in reporting the masked item was calculated. The complete design as well as complete analyses of serial position effects, proactive interference effects,
IV. PAPER 3
92
and threat relevance effects were described in detail by Reinecke et al. (2006; submitted-a). It is beyond the scope of the present study to report replications of all these analyses. Instead, we restrict ourselves to the analyses which are critical for the specific hypotheses tested here. We selected and averaged only those data points which are relevant for the VWM biases that were measured across the three test sessions. One of these VWM biases was the disorderrelated memory advantage for cued spider images compared to cued non-spider images (see Reinecke et al., 2006; submitted-a), which is called cued threat advantage. This bias score was calculated by subtracting mean memory accuracy for cued non-spider items in spiderfree displays from mean accuracy for cued spider items, averaging over the position of the tested items within the cue string. The second VWM bias refers to enhanced memory for uncued spider images compared to uncued non-spider images, which is called uncued threat advantage. It was calculated by subtracting mean memory accuracy for uncued images in non-spider displays from mean memory accuracy for uncued spider images. Hypotheses
A number of specific hypotheses were tested to determine whether VWM biases were affected by successful treatment of fear of spiders. Three hypotheses referred to VWM biases for cued spider items: (1) From the first to the second test, the cued threat advantage will be reduced more in the TG than in the WG. (2) From the second to the third test, the reduction will be stronger in the WG than in the TG. (3) Therefore, concerning the cued threat advantage, the groups will differ especially at the second test. Another three hypotheses referred to the same VWM biases for uncued spider items: (4) From the first to the second test, the uncued threat advantage will be reduced more in the TG than in the WG. (5) From the second to the third test, the reduction will be stronger in the WG than in the TG. (6) Therefore, concerning the uncued threat advantage, the groups will differ especially at the second test. Results Self-report measures and behavioral tests
The mean questionnaire and BAT scores for the TG and the WG are shown in Table IV.1 for all three test times. Questionnaire scores, BAT speeds, and baseline-expectation pulse differences were each subjected to a 2x3 ANOVA with the factors ”group” and ”test time” to reveal the impact of the treatment on these measures. Additionally, we conducted independent-samples t-tests for each test point to determine the strength of group differences. Regarding the questionnaires and the BSQ, the treatment led to a clear reduction of participants’ mean scores, SAS: group x time: F (2, 48) = 16.91, p < .001, FSQ: group x time: F (2, 48) = 27.28, p < .001, BSQ: group x time: F (2, 48) = 2.98, p = .061. In the FSQ and the BSQ, the groups did not differ before treatment, FSQ: t(24) = 1.19, p = .247, BSQ: t(24) = 1.12, p = .272. In the SAS, the TG revealed slightly higher scores
IV. PAPER 3
93
Table IV.1: Questionnaire scores (means, standard deviations), BAT speed, and pulse scores of treatment group vs. waiting group at the three test times.
SAS
Treatment Group Waiting Group Test 1 Test 2 Test 3 Test 1 Test 2 Test 3 st nd st nd (pre) (1 post) (2 post) (1 pre) (2 pre) (post) 20.8 11.3 9.1 17.9 17.9 11.1 (3.5) (4.7) (4.8) (3.4) (3.9) (4.2)
FSQ
64.9 (23.4)
23.5 (16.7)
19.5 (19.2)
55.2 (18.0)
51.9 (17.2)
19.4 (9.8)
BSQ
2.2 (0.9)
1.1 (0.3)
1.1 (0.1)
1.9 (0.6)
1.4 (0.5)
1.1 (0.8)
68.9 (11.8)
67.3 (8.1)
63.8 (10.0)
67.7 (9.6)
66.8 (8.6)
65.7 (9.0)
Expectation
79.8 (12.6)
71.9 (10.2)
68.9 (11.9)
71.5 (12.9)
75.4 (13.8)
68.5 (13.9)
SPEED BAT
0.29 (0.19)
0.58 (0.28)
0.71 (0.29)
0.35 (0.18)
0.45 (0.26)
0.62 (0.23)
PULSE BAT Baseline
than the WG, SAS: t(24) = 2.16, p < .05. At the second test, however, the TG exhibited significantly lower spider fear and weaker bodily sensations during confrontation than the WG because only the TG had received treatment already, SAS: t(24) = 3.86, p = .001, FSQ: t(24) = 4.26, p < .001, BSQ: t(24) = 2.00,p = .057. As expected, the WG caught up with these improvements at the third test, SAS: t(24) = 1.13, p = .268, FSQ: t(24) = 0.03, p = .980, BSQ: t(24) = 0.31, p = .760. Speed in approaching a living tarantula was significantly enhanced by treatment, group x time: F (2, 48) = 3.59, p < .05, and expectation pulse increase was significantly reduced, group x time: F (2, 48) = 3.45, p < .05. The differences in BAT speed between the two groups were not significant at any of the three test times, all t(24) < 1.18, all p > .25. However, both groups showed the expected pattern in BAT speed: the TG showed a significant enhancement at the second test after having received treatment already, t(12) = 4.35, p = .001. The WG’s speed only increased significantly from the second to the third test after they had also received treatment, t(12) = 2.44, p < .05. With respect to the expectation pulse increase, the TG revealed a marginally higher expectation pulse than the WG at the first test already, t(24) = 1.67, p = .107, but not at the second test, t(24) = 1.62, p = .119. At the third test, the two groups showed very similar pulse increases, t(24) = 0.68, p = .505. Moreover, the TG did not show significant changes in their expectation pulse differences over the three tests, F (2, 22) = 1.49, p = .246. In contrast, the WG exhibited a signifi-
IV. PAPER 3
94
cantly larger expectation pulse increase at the second test than at the first one, t(12) = 3.08, p = .01, which was then significantly decreased as a result of the treatment before the third test, t(12) = 2.77, p < .05. Visual working memory task
Prior to the statistical analyses, practice trials were removed from the data set. For each of the total 42 experimental conditions, mean accuracies in reporting the tested item were calculated. Although not reported here, results for the complete data set may be requested from the first author. From these data, the scores for the cued threat advantage bias and the uncued threat advantage bias were calculated for each person as described above. Due to the precise one-sided hypotheses mentioned above, the t-tests described below were one-sided tests. Hypotheses (1) to (3) regarding cued spiders. A cued threat advantage was calculated for each person at each test time as outlined above. The left panel of Figure IV.1 depicts the mean advantages, separated for the three test times and the two groups (see also Table IV.2). From these means, we calculated the differences between the cued threat advantage at the first vs. the second test, and between the second vs. the third test. For these differences, we calculated one-sided t-tests between groups for each test-to-test phase. In addition, we tested the cued threat advantage against 0, separately for each group. Unexpectedly, the TG did not show a significantly stronger reduction of the cued threat advantage than the WG from the first to the second test, t(24) = 1.20, p = .122, and from the second to the third test, the WG did not show a significantly stronger reduction than the TG, t(24) = 0.12, p = .452. However, the TG showed a reduction of the threat advantage between the first and second test, which was significantly different from 0, TG: t(12) = 2.06, p < .05, but no significant change between the second and the third test, t(12) = 1.36, p = .100. For the WG, we did not find a significant change from the first to the second test, t(12) = 0.21, p = .419, but the change from the second to the third test was marginally larger than 0, t(12) = 1.43, p = .090. To test the hypothesis that the groups differed from each other especially at the second test, we calculated measures of quadratic contrasts over the three test times and determined whether there are any group x time interaction effects. In contrast to our predictions, this analysis suggested that the time courses in the two groups did not differ from each other significantly, group x time: F (1, 24) = 0.63, p = .435. In summary, although the observed changes were mainly in line with our predictions, they were too small to yield significant group differences. Hypotheses (4) to (6) regarding uncued spiders. The means of the uncued threat advantages for each group at each test time are depicted in the right panel of Figure IV.1 and the lower part of Table IV.2. They were analyzed in the same way as the ones for cued items, as were the differences between successive tests. As predicted, the TG showed a
IV. PAPER 3
95
Table IV.2: Threat advantage scores (means, standard deviations) for cued and uncued spiders of treatment group vs. waiting group at the three test times.
Treatment Group Waiting Group Test 1 Test 2 Test 3 Test 1 Test 2 Test 3 st nd st nd (pre) (1 post) (2 post) (1 pre) (2 pre) (post) .46 .40 .34 .48 .47 .41 (.12) (.13) (.11) (.19) (.15) (.15)
Cued Uncued
.56 (.30)
.38 (.27)
.53 (.16)
.49 (.24)
(A) cued threat-advantage
(B) uncued threat-advantage
0,9
TG WG
0,8 threat advantage
threat advantage
0,8
.40 (.32)
1
1 0,9
.51 (.35)
0,7 0,6 0,5
0,7 0,6 0,5
0,4
0,4
0,3
0,3
0,2
TG WG
0,2 test 1
test 2
test 3
test 1
test 2
test 3
Figure IV.1: (A) Cued threat advantage, calculated as the mean accuracy in memorizing cued spiders minus the mean accuracy in memorizing cued non-spiders in corresponding conditions, for both groups and three tests. (B) Uncued threat advantage, calculated as the mean accuracy in memorizing uncued spiders minus the mean accuracy in memorizing uncued non-spiders in corresponding conditions.
greater reduction of the uncued threat advantage than the WG from the first to the second test t(24) = 1.74, p < .05, while the WG showed a greater reduction from the second to the third test, t(24) = 1.74, p < .05. In line with our expectations, the TG showed a significant reduction of uncued threat advantage from the first to the second test, t(12) = 2.19, p < .05, while the WG did not, t(12) = 0.24, p = .406. Contrary to our hypotheses, however, the WG did not show a significant reduction from the second to the third test, t(12) = 0.86, p = .203, and the TG – instead of showing stability in their prior reduction – even exhibited a relapse of the uncued threat advantage, t(12) = 1.86, p < .05. As before, group x time interaction effects were calculated for the quadratic contrasts of the three test times. This analysis confirmed that the temporal course of the uncued threat advantage differed between the two groups, and it suggested a nearly significant effect of the treatment in the TG at the second test, F (1, 24) = 4.19, p = .052. In summary, the observed results for uncued items
IV. PAPER 3
96
yielded the predicted differential advantages for uncued spiders, although the relapse in the TG was unexpected. Discussion Earlier studies demonstrated that successful cognitive-behavioral psychotherapy of spider phobia is able to modify hormone levels (Gaab et al., 2005) and brain metabolism (Paquette et al., 2003; Straube et al., 2006) in spider phobics. So far, however, there is no reliable evidence that cognitive biases can be modified through treatment. This is surprising, as cognitive-behavioral therapy primarily addresses these distorted cognitions and disordermaintaining behavior such as avoidance, and effects on the physiology are assumed as being rather secondary. The present study addressed two main limitations of previous studies which may explain the lack of reliable findings: First, the studies often lacked an adequate no-treatment control group to estimate the amount of mere practice effects induced by repeated testing (e.g., Mogg et al., 1995; Teachman & Woody, 2003). The few studies which did include such a control group illustrate how important it is: Even though treated spider phobics often showed an impressive reduction of fear-related cognitive biases, this reduction did not exceed the mere practice effects observed in the waiting-list control groups (e.g., Huijding & de Jong, in press; Thorpe & Salkovskis, 1997). Second, previous studies often addressed cognitive biases which occur in both high fearfuls and low fearfuls, but to different degrees, for instance, attentional vigilance to spiders (e.g., van den Hout et al., 1997). Therefore, if the cognitive biases are not very strong to begin with, it will be more difficult to find treatment-induced changes in them. In the present study, we took both problems into account: The study involved a notreatment control group, and we tested the modifiability of VWM biases for two different types of materials, namely a bias for cued spiders which we had earlier observed in both highly spider fearfuls and non-anxious controls, and a disorder-specific bias for uncued spiders, which had occurred in high-fearfuls only (see Reinecke et al., 2006; submitted-a). Therefore, 26 spider fearfuls were tested three times with self-report measures assessing fear of spiders and bodily symptoms during confrontation with a phobic stimulus, with behavioral approach tests, and with the VWM task introduced by Reinecke et al. (2006). Following a multiple-baseline design, half of the patients received treatment between the first and the second test session, while the others were treated between the second and the third test. In line with earlier studies, changes in self-reported fear of spiders (SAS, FSQ) as well as self-reported bodily sensations (BSQ) during confrontation clearly reflected the efficacy of treatment. Both groups revealed the strongest reductions of these scores after treatment. Although less pronounced, the same was true for approach speed in the Speed BAT. For
IV. PAPER 3
97
the expectation pulse increases in the Pulse BAT, the results were slightly different. They implied that experiencing the first Pulse BAT increased expectation anxiety in the following test when there was no treatment in between. In contrast, the cognitive-behavioral treatment prevented an increase of expectation anxiety. With respect to the cued threat advantage, the TG and the WG showed no significant group differences in changes from the first to the second and from the second to the third test. Moreover, the analysis of quadratic contrasts did not indicate any differences between the two groups in the time course of the cued threat advantage. In summary, the analyses of the cued threat advantage indicated that the treatment effects barely exceeded practice effects. A different picture emerged for the uncued threat advantage: As expected, changes in this bias from the first to the second and from the second to the third test were significantly different between groups. Compared to the first test, the uncued threat advantage at the second test was significantly reduced in the TG, but not different at all in the WG. As expected, the WG showed a similar reduction of the uncued threat advantage from the second to the third test, after having received treatment as well. In addition, the TG exhibited an unexpected relapse of the uncued threat advantage, that is, an increase from the second test (directly after treatment) to the third test two weeks later. The overall pattern of results observed here confirms that at least some aspects of VWM biases are sensitive to treatment, and that they can be modified through experience. Successful psychotherapy aiming at a modified judgment of the feared stimulus seems to be able to yield quick changes in the cognitive reactions to this stimulus. Interestingly, the two types of VWM biases investigated here differed in how strongly they were affected by treatment. This raises the question why we found stronger reductions in the bias for uncued spiders than in the bias for cued spiders, and why there was a fairly quick loss of the treatment-induced reduction of the uncued threat advantage. The most important difference between the two biases may be the extent of disorderspecificity they show. Our earlier work (Reinecke et al., 2006; submitted-a) suggests that cued spiders enjoy preferred VWM processing by both spider fearfuls and non-fearful individuals, with a slightly larger bias in highly fearfuls. In contrast, biased VWM for uncued spiders was disorder-specific, occurring only in spider fearfuls. Therefore, the cued threat advantage may indicate a general human processing bias which is not specific to spider phobia. If this is true, it is not surprising that only the disorder-specific uncued threat advantage was reduced by successful therapy to a degree which exceeded that of mere practice effects. This also explains why no relapse was found in the TG’s cued threat advantage: A bias is unlikely to increase at follow-up, if it was not significantly reduced by treatment in the first place. However, the relapse found in the TG’s uncued threat
IV. PAPER 3
98
advantage remains surprising and requires further study. In any case, it does demonstrate the importance of follow-up tests to determine how stable the beneficial effects of treatment are. Related to this issue, we argued earlier that the performance in memorizing a cued spider versus memorizing an uncued spider might depend on two different types of attention allocation. Recognizing and memorizing cued items is part of the instruction, and is additionally emphasized by the task, because a cued item is tested in 85% of trials. Thus, all participants, independently of their anxiety, will strategically and volitionally direct their attention to the cued items. In this situation, both fearfuls and non-fearfuls, revealed memory advantages for cued spiders, possibly due to their generally negative valence, and fearfuls showed only a slight extra advantage. In contrast, the detection and memorization of an uncued spider item is not task-relevant, but spider fearfuls seem to do it nevertheless with high accuracy, while controls do not do it at all (see Reinecke et al., 2006; submitted-a). We argued that this effect reflects disorder-specific hypervigilance, implying the automatic, reflexive and inevitable detection of spiders. Cognitive-behavioral exposure therapy specifically addresses these automatic fear responses, aiming at the patient habituating to spiders. This might also explain why the uncued threat advantage was more prone to treatment effects than the cued threat advantage. The unexpected finding of a rebound effect in the TG’s uncued threat advantage implies re-occurring hypervigilance for uncued spider images. At first sight, this is surprising because self-reports and behavioral tests suggested continuous improvement of anxiety symptoms in the TG. What might lie behind this discrepancy? Most likely, the answer is that exposure therapy is very successful in quickly gaining subjective improvements, as patients soon experience habituation effects and a restructuring of cognitions (Marks, 1987). This might explain the continuously positive development in self-report measures. In addition, the contents of the behavioral approach tests were directly addressed within the treatment sessions, leading to potential practice effects. However, it is also known that these quick gains might be lost rapidly without further practicing. Only enduring exercises slowly lead to a complete extinction of automatic fear responses (e.g., Oest, 1996). A short cognitive-behavioral treatment is probably sufficient for learning to deal with phobic anxiety and threatening stimuli in a controlled, volitional manner. In contrast, long-term modification of automatic aspects of anxiety, such as fright or accelerated heart beat in view of a spider, requires practicing. Possibly, the same is true for cognitive aspects of anxiety. This explanation would be in line with studies addressing fear associations, which support the assumption that automatic associations change more slowly than intentional, self-reported associations (e.g. Huijding & de Jong, in press; Strack & Deutsch, 2004). However, the amount to which participants further practiced to approach the threatening stimuli was not systematically documented so that this post-hoc explanation cannot be
IV. PAPER 3
99
explicitly tested. Presumably, the observed re-occurrence of the uncued threat advantage may also be an important predictor of relapse in behavior and subjective fear. Therefore, further studies should examine whether relapse of phobia is more likely in individuals who either did not show a reduction of cognitive biases, whose biases decreased only little, or whose biases returned at follow-up tests. The VWM bias for uncued spiders is a likely candidate for the kind of biases to be examined in these studies, but other biases should also be addressed, for instance, automatic attentional biases. Some limitations of the current study and suggestions for further research should also be mentioned. First, one might argue that before applying cognitive tasks in treatment studies, we should know more about the test-retest reliability of these tasks. This is certainly true because possible treatment effects can only be detected in pre-post comparisons if the measurements have sufficient reliability. Unfortunately, very little is known about the test-retest reliability of most cognitive tasks, including the VWM task used here. However, repeated one-time applications of the task in earlier studies (Reinecke et al., 2006; submitted-a) suggest that the reported effects occur reliably at least in extreme groups. Moreover, within the waiting-list group of this study, the threat advantages observed on the first test correlated significantly with those of the second test (cued threat advantage: r = .74, p < .01; uncued threat advantage: r = .59, p < .05). This suggests high test-retest reliability, even though this group was both small in number and homogeneous in fear levels. A second restriction of the current study is that we did not test a healthy control group, therefore we cannot say whether successful treatment reduced the observed VWM biases to the level of non-fearful controls. This would be a worthwhile continuation of research. In addition, future research should address the role of VWM biases in the prediction of relapse, as mentioned above. Finally, it remains to be tested whether VWM biases are existing and sensitive to treatment in other anxiety disorders as well, for instance panic disorder or generalized anxiety disorder. The aim of the present study was to test whether VWM biases can be modified through cognitive-behavioral treatment beyond mere practice effects. We succeeded in providing first evidence that some aspects of these biases might be indeed modified. While we did not find a treatment effect for the rather strategic working memory aspects of performance, we found clear treatment sensitivity of automatic, disorder-specific working memory biases. We therefore suggest to focus further studies of treatment effects on cognitive biases which are highly disorder-specific, and which reflect automatic aspects of cognitive processing. For cognitive theories of anxiety disorders and the postulated importance of cognitive biases, the results reported here supply some supporting evidence. Further research is required to clarify whether residual biases after treatment and re-occurring biases are predictors for relapse.
V. Paper 4: Visual Working Memory for Threat: Spider Fearfuls Show Disorder-Specific Change Detection
Abstract Working memory biases in anxiety were investigated with a change detection task. Spider fearfuls (SFs) and non-anxious controls (NACs) judged two subsequently presented displays as same or different. The displays consisted of pictures, one of which could depict a spider. In Experiment 1, the first display was shown for 100 or 500 ms. Display 2 showed a complete display or a single item. In Experiment 2, SFs and NACs without snake fear were tested with displays including either a spider or a snake. Both groups exhibited better working memory for the critical stimuli than for neutral ones, and SFs showed disorder-specific working memory enhancements for spiders. The discussion refers to cognitive models of phobia and theories of attention and memory.
Introduction Allow yourself a few seconds to look around and to realize how much of your surrounding you are able to visually capture. Surely, you have the impression of seeing everything that crosses your visual field. How is that in line with the growing literature that reveals the inability of 50% of experimental participants to detect the replacing of a person they are talking to by another person (Simons & Levin, 1998), the exchange of heads of two persons in a photograph (Grimes, 1996) or the appearance of a gorilla during a basketball game (Simons & Chabris, 1999)? Indeed, recent studies investigating this impressive phenomenon called change blindness expose an astonishing discrepancy between what we believe to visually perceive and what we really do perceive. Recently, there seems to be wide agreement that the strong capacity limitations of attention and visual working memory are causative for the phenomena described above (e.g. Simons & Ambinder, 2005; Wolfe, Reinecke, & Brawn, 2006; Koivisto & Revonsuo, 2005). For instance, Luck and Vogel (1997) investigated the storage capacity of visual working memory (VWM) in several change detection experiments. Participants viewed a study
100
V. PAPER 4
101
display of simple, colored dots for 100 ms and, after a short delay, a test display, which was either exactly the same as the previous seen one, or contained a change in one of the dots. A verbal working memory load was given at the beginning of each trial to avoid influences of verbal memory. Therefore, participants had to memorize an initially displayed two-digit number, which was tested at the end of the trial. The authors calculated participants’ accuracy in judging the two visual displays as same or different in dependence of the number of items visible within the display. Participants were able to store only about 4 objects, which is in strong contrast to our impression of seeing a ”whole world”. Additional control experiments were conducted to ensure that lower memory accuracy with higher set sizes was not due to capacity limitations during the perception or the response decision stage, but only during the encoding stage. In a first control experiment, the display time of the study display was extended to 500 ms. In a second control experiment, the test display showed only one item and participants had to report whether this item was part of the previous seen study display. As both control experiments revealed similar results as the main task, the authors concluded that the task indeed measures VWM. In summary, the ability to detect changes, even in very simple objects, seems to be highly constricted due to capacity-limited VWM. Following Simons and Ambinder (2005), current change blindness research has nevertheless left many open issues, among them: Under which conditions is change detection enhanced, and which role do individual differences play? Indeed, several studies suggest that both the significance of the stimuli and individual characteristics influence change detection abilities. For instance, the work of Rensink, O’Regan, and Clark (1997) revealed change detection advantages for the most salient stimuli of a scene. Moreover, the study reported by Ro, Russel, and Lavie (2001) suggests a change detection advantage for faces among objects, and this effect seems to be even stronger for well-known faces (Buttle & Raymond, 2003). And in a study by Werner and Thies (2000), football experts were faster than non-experts in detecting changes in scenes of football games, which suggests the relevance of individual experiences for change detection. Another line of research has addressed the role of mental disorders and the question whether they affect change detection for disorder-relevant stimuli. Jones, Jones, Smith, and Copley (2003) investigated information processing biases in alcohol and cannabis users by comparing the detection speed of changes made to scene objects in a flicker paradigm. On each trial, participants viewed a real-world scene including several neutral vs. substance-related items. Between scene views, either a neutral or a substance-related item changed back and forth. The authors measured the number of scene switches necessary for change detection. Regarding both substances, heavy substance users were faster in detecting substance-related changes, but slower in detecting neutral changes. A similar information
V. PAPER 4
102
processing bias was reported for fear of spiders by Mayer, Muris, Vogel, Nojoredjo, and Merckelbach (2005). In this study, observers also viewed scenes. On some trials, a spider vs. a non-spider item gradually appeared and participants had to indicate at the end of the trial whether a new item was added or not. Spider fearfuls performed better in detecting spider-related changes than non-anxious participants. Both of these studies addressed attentional biases as participants were allowed to guide their attention through the visual scene as long as necessary to detect a change, and both studies imply utility of the paradigm for assessing attentional processes. So far, however, no study addressed emotional visual working memory biases by using a change detection paradigm such as the one introduced by Luck and Vogel (1997). This is regrettable because working memory (WM) biases are important for closing the empirical gap observed between attentional biases and memory biases. From research on attentional biases in phobias we know that phobics tend to show enhanced attention to feared objects and greater distractibility by them (for reviews, see Mathews & MacLeod, 2005; Mathews & Mackintosh, 1998). For instance, spider phobics should be very quick to focus their attention on a spider present in a room, but the spider should also distract their attention from other objects or events. On the other hand, studies investigating memory biases in phobia did not lead to coherent conclusions: some results suggest a disorder-specific memory bias, while others argue against it (for a review, see Williams, Watts, MacLeod, & Mathews, 1997). Thus, the question which biases are typical for phobics is still an open issue. The vigilance-avoidance hypothesis postulated by Williams et al. (1997) might provide a possible explanation why researchers do frequently find attentional biases in specific phobias, but have difficulties to find reliable memory biases. The authors assume that phobics show a fast employment of attention to threatening stimuli, but also an avoidance of a deeper elaboration of the feared material. This assumption has received considerable empirical support from studies failing to reveal fear-related memory biases (e.g., Becker, Roth, Andrich, & Margraf, 1999; Thorpe & Salkovskis, 2000; Watts & Dalgleish, 1991), but also leaves open questions: Where does the unwanted elaboration – if at all – start? At the level of WM or beyond it? And when the feared stimulus is attracting attention quickly, is it also stored in WM more efficiently? So far, only two studies investigated disorder-specific VWM biases (Reinecke, Rinck, & Becker, 2006; Reinecke, Becker, & Rinck, submitted-a). On each trial of these studies, we presented 16 stimuli in a 4x4 matrix to spider fearfuls and non-anxious participants. One of the stimuli was a spider, the remaining pictures were either neutral or positively valenced. On each trial, 5 of the 16 images were subsequently cued by a sudden color change of the picture background, once every 150 ms. Afterwards, one of the cued items or, in some cases, one of the uncued items, was hidden and probed in a WM test. We measured memory
V. PAPER 4
103
accuracy depending on the cue status of the item (first, second, third, fourth, fifth cued item, or uncued item). The spider picture could be one of the cued items, one of the 11 remaining uncued ones, or not displayed at all. Both spider fearfuls and non-anxious controls showed enhanced memory for cued spiders compared to cued neutral items, and this advantage was even stronger in fearfuls. In addition, fearfuls alone also exhibited disorder-specific enhanced memory for uncued spiders. Thus, it seems that ”deeper elaboration” in terms of Williams et al. (1997) does not start within VWM. However, it is not clear yet where the disorder-specific advantage exactly derives from: from a faster, automatic memory consolidation of the spider, from strategic storage of spiders, or from a stronger storage linkage? One explanation of the observed disorder-specific VWM biases might be that the two groups differently employed to two different attentional systems, namely voluntary vs. reflexive attention (Mueller & Rabbitt, 1989). Both groups were instructed to attend to the cued items and, therefore, invested voluntary, goal-directed and controlled attention to these stimuli. Thus, both groups showed similar biases. In contrast, uncued spiders were salient stimuli only for spider fearfuls, thus only their attention was reflexively captured by uncued spiders. Unfortunately, however, there is an alternative explanation which states that spider fearfuls strategically encoded all spiders, cued and uncued alike, because it was obvious to all participants that the studies were addressing fear of spiders. A temporally more precise paradigm might shed light on that question, and particularly the task introduced by Luck and Vogel (1997) seems advantageous in several ways. First, it is a well-established paradigm, and the authors’ data demonstrate that the task is really measuring VWM. An adaptation of the task to real objects to better ecologically validity is easy to realize. Second, the task does not require elaboration (see Williams et al., 1997) from the participant and, therefore, should be suitable for revealing disorder-specific biases in phobic anxiety. Third, by using the three different task versions employed by Luck and Vogel (1997), we might be able to answer the question exactly where VWM biases occur. Do we find group differences in all of the three task versions? Or only under specific temporal circumstances? Fourth, the task provides the possibility to investigate disorder-specific distraction effects: If spider fearfuls indeed show enhanced memory for spider displays – is it at the expense of the visual encoding of other, non-spider images visible within the display? To answer these questions, we conducted two change detection experiments, studying VWM enhancement and distraction in fear of spiders. In Experiment 1, we tested whether the task introduced by Luck and Vogel (1997) is suitable for measuring VWM for real objects, and whether we find any differences between highly spider-fearfuls and non-fearful individuals in detecting changes to spider images. As in the study by Luck and Vogel (1997),
V. PAPER 4
104
we varied the display size and encoding time of the study display, and also the type of test display (whole-display-test vs. single-item-test). Unlike Luck and Vogel (1997), on some trials, the displays contained a spider image. In Experiment 2, we tested whether any group differences found in Experiment 1 were disorder-specific, that is, occurred only for the feared object, and not for all threatening objects. So far, only a few studies of attentional biases employed materials of varying individual fear levels. For instance Oehman, Flykt, and Esteves (2001) found that all participant groups showed faster detection of evolutionary relevant materials such as snakes and spiders, and that this effect was enhanced in snake phobics and spider phobics, respectively. Would the same be true for VWM biases? Or are group differences observed with spider displays due to a higher preparedness in general (Seligman, 1971) in the phobic group, that is, would spider fearfuls show general VWM biases for all evolutionary relevant materials? To answer these questions, we compared the performance in detecting changes applied to spider images and snake images in a group of spider fearfuls vs. a group of non-anxious controls, both without snake anxiety.
Experiment 1: Applying a Classical VWM Task to Fear of Spiders Introduction Experiment 1 was designed to test whether the VWM task introduced by Luck and Vogel (1997) can be applied to real objects. Therefore, we replicated the authors’ three-part experiment as closely as possible. Participants performed a) a whole-display-test block with 100 ms display time of the study display, b) a whole-display-test block with 500 ms display time of the study display to exclude a possible influence of perceptional difficulties, and c) a partial-report block with 100 ms display time and only one item in the test display to exclude difficulties on the decision stage with higher set sizes. We measured participants accuracy in judging two displays as same or different, depending on the valence of the displays (non-spider trials vs. spider trials). Moreover, we studied whether emotional materials have an influence on the general WM laws suggested by Luck and Vogel (1997). By including a spider picture, we varied the external threat value of the materials, and by comparing a spider fearful group to a group of non-anxious controls, we varied the individual threat value of the spider item. Employing the three different task versions described above should further elucidate the nature of the disorder-specific WM differences we expected. Three hypotheses were tested in Experiment 1: (1) Several authors have argued that the units of VWM are whole, integrated objects (e.g., Duncan, 1984; Vogel, Woodman, & Luck, 2001) rather than single features. However, other authors have reported evidence against this assumption (e.g., Wheeler & Treisman, 2002). They suggest single features as the units of VWM, and the debate is still ongoing. Since the object stimuli used in the present study are far more complex than the simple dots used by
V. PAPER 4
105
Luck and Vogel (1997), we first aimed at testing whether it is possible to adapt the Luck and Vogel (1997) task to pictures of real objects without changing temporal parameters. We expect that it will be possible to replicate the results provided by Luck and Vogel (1997) for real objects in neutral displays, that is, we predict similar results in the task with an encoding time of 100 ms, the task with an encoding time of 500 ms, and the single-item-test task. (2) Many studies demonstrated attentional biases in fears and phobias, but the evidence for memory biases is very incoherent (see Mathews & MacLeod, 2005; Williams et al., 1997). As the here employed task requires reflexive attention in terms of Mueller and Rabbitt (1989), and no elaboration in terms of Williams et al. (1997), we expect enhanced memory for spider changes in the spider fearful group compared to the non-anxious controls group. Here, we have to differentiate between two cases: a spider can vanish (being contained in the study display, but not in the test display), or a spider can appear (being part of the test display, but not the study display). Only the first case would address WM for spider images, and we predict stronger group differences for this case. Based on the finding of Luck and Vogel (1997) of a VWM span of about 4 items, we can conclude that with display sizes larger than four, participants have to selectively encode into VWM a subset of items from the study display. Based on prior studies of attentional biases, we predict that for spider fearfuls, the spider item should be one of these four items if it is present, even with an encoding frame of only 100 or 500 ms. In contrast, when a spider image only appears in the test display, 2000 ms display time are at both groups’ disposal for comparison with the study display – more than enough for the NACs to detect the spider image as well. (3) Attentional bias research not only suggests that phobics show faster detection of threatening stimuli, but that phobics also exhibit stronger distraction from other stimuli by the threatening stimuli (e.g. Rinck, Reinecke, Ellwart, Heuer, & Becker, 2005). Therefore, we predict that the spider fearfuls’ improved VWM performance for spider changes will be accompanied by poorer VWM performance for non-spider changes in displays that contain a spider item.
Methods Participants
The experimental session was completed by 21 spider fearfuls (SFs) and 21 non-anxious controls (NACs) without any animal oriented fears. Preselection took place in classes at several departments of Dresden University of Technology, using the German ”Spider Anxiety Screening” (SAS; Rinck, Bundschuh, Engler, Mueller, Wissmann, Ellwart, & Becker, 2002). We selected students with scores lower than 5 (minimum 0) or higher than 14 (maximum 18) and invited them for further interviewing to test whether they were suitable
V. PAPER 4
106
for participation in the study in one of the two experimental groups. Exclusion criteria were alcohol or drug abuse, current influence of alcohol, drugs, or attention-affecting medication, psychosis, depression, and medium levels of fear of spiders. First, potential participants were interviewed regarding current stress in everyday life and the use of pharmaceuticals, alcohol, and drugs. They completed the German version of the ”Fear of Spiders Questionnaire” (FSQ; Szymanski & O’Donohue, 1995; see Rinck et al., 2002) as well as the German FDD-DSM-IV inventory (Kuehner, 1997), which is a translation of the ”Questionnaire for Depression Diagnosis” (Zimmermann, Coryell, Wilson, & Corenthal, 1986). Moreover, trained interviewers checked the DSM-IV criteria for specific phobia concerning spiders. The interview was based on the International Diagnosis Checklist for DSM-IV (ICDL; Hiller, Zaudig, & Mombour, 1997) including the eight-stage assessment scales of the F-DIPS (Margraf, Schneider, Soeder, Neumer, & Becker, 1996), which is the German version of the ADIS (DiNardo, Brown, & Barlow, 1994). For the anxiety group, we admitted only candidates who had a minimum FSQ score of 30. Fourteen of the 21 SFs fulfilled all DSM-IV criteria for a specific phobia of spiders. The remaining 7 fulfilled all criteria except criterion E, which requires significant impairment in everyday life. Considering the ease of avoiding threatening spiders in Northern Europe, not fulfilling this criterion is comprehensible and does not affect the questions of interest. The SFs group and the NACs group were matched with regard to age, gender, and educational level. All participants had a high school degree and were students of Dresden University of Technology. On average, the 17 female and 4 male members of the NACs group were 21.6 years old (SD = 2.2), the 19 female and 2 male SFs participants had a mean age of 21.2 years (SD = 2.6). All of the final 42 participants had normal or corrected-to-normal vision. All of them were informed of their rights as experimental participants and gave their consent. In return for their participation, they received course credit or a payment of 5 EUR per hour. Materials and apparatus
The experiment was operated by MATLAB software using the Psychophysics Toolbox extensions (Pelli, 1997; Brainard, 1997). Experimental materials were presented on a gray background on a 17” monitor with a resolution of 1024 x 768 pixels. Stimuli for the verbal WM load task were randomly chosen black printed triple-digit numbers of the font size 25 displayed in the center of the screen (see Figure V.1A). Stimuli for the VWM task were 36 color pictures with an approximate side length of 115 pixels: 1 disorder-relevant image (spider) and 35 disorder-irrelevant images (e.g. butterfly, apple, fan). In each visual study display, either 4, 6, or 8 images were randomly selected from the complete item pool of 36 items and randomly set on the nine locations of an invisible 3x3 grid. Whether one of these pictures was the spider was likewise randomly controlled by the experimental software. A sample study display with a set size of 8, containing no spider, is shown in Figure V.1B.
V. PAPER 4
107
Both responses to the verbal memory task and the visual memory task were recorded via the number input field of the computer keyboard.
Figure V.1: Sample experimental trial of the whole-display-test task. Participants view a tripledigit number first, then a study display, and afterwards a test display. Participants’ task is to memorize the digit via verbal WM and to judge the two picture displays as same or different via visual WM. In the single-item-test task, the test display showed only one picture. The figure shows a ”spider appears” trial. Note: Actual stimuli were in color.
Procedure
After giving informed consent, participants completed the State form of the German State-Trait Anxiety Inventory (STAI-S; Laux, Glanzmann, Schaffner, & Spielberger, 1981). Afterwards, they read written instructions regarding the experimental task and studied a sample trial. They were instructed to memorize the initially displayed triple-digit number digit by digit, and then memorize the study display. In the "whole-display-test task", they then had to decide whether the subsequently presented test display was identical to or different from the study display. In the "single-item-test task", a single item was presented instead of a complete test display, and participants had to indicate whether this item had
V. PAPER 4
108
been contained in the study display. A sample whole-display-test trial containing a spider in the test display is shown in Figure V.1. Each experimental trial started with the presentation of a black, centered fixation cross for 500 ms. Afterwards, a triple-digit number was centrally displayed for 500 ms and followed by a blank screen containing a fixation cross for 1000 ms. Then the VWM task started, in which a study display containing either 4, 6, or 8 items was displayed. Encoding time, that is, the display time of the study display, and the type of test display were varied in three different task blocks. In the 100-whole-display-test task and the 100-single-item-test task, the study display was shown for 100 ms, in the 500-whole-display-test task it was shown for 500 ms. The task order was counterbalanced across participants. Subsequently to another blank delay period of 900 ms, the test display was provided for 2000 ms at most. In the two whole-display-test tasks, the test display consisted of the same number of items as the study display, while one item could be changed. The participants’ task was to indicate whether the second display was identical to the first one. In the single-item-test task, only one item was displayed in center of the screen, and the item had either been part of the study display or not. Here, participants were asked to report whether this item had been part of the study display. If it had been, they had to respond by pressing the ”4” key of the number block of the computer keyboard. If not, they had to press the ”6” key. Written feedback was provided directly after the response. Then, in all of the three tasks, the memorized triple-digit number was typed in via the keyboard. Again, written feedback was provided immediately. On each trial, set size, study display, test display and the existence of a change were randomly determined by the experimental program. Two breaks were included between the three blocks. After the experiment, participants completed the STAI-State questionnaire a second time, and also the STAI-Trait questionnaire (STAI-T; Laux et al., 1981). Finally, the participants were debriefed regarding the study aims. SFs were informed about treatment possibilities concerning spider phobia. One block took about 35 minutes, a complete session lasted about 130 minutes. Design
The experiment was based on an incomplete 3x3x2x2x2x2 factorial design with the withinsubjects factors task (100-whole-display-test, 500-whole-display-test, 100-single-item-test), set size (4, 6, 8 items), study display (non-spider, spider), test display (non-spider, spider), change type (same, different) and the between-subjects factor group (SFs, NACs). The factorial structure depicted in Table V.2 might facilitate the traceability of the design. The reason for the incompleteness is that when one combines the factors study display, test display, and change type, inevitably some combinations are impossible: For instance, when the study display includes a spider, and the test display does not, a change must have occurred. The incompleteness of the design does not pose a problem, however, because
V. PAPER 4
109
we tested specific predictions for which an analysis of the complete data set would be inappropriate. To avoid response biases that could arise from a higher probability of one of the two response categories (same, different) or one of the two study displays (spider, non-spider) due to the incomplete design, it was required to balance the probability of the correct answer being ”same” vs. ”different”, and the probability of the study display including a spider vs. no spider. In order to set these probabilities to 50%, some factorial combinations were presented 10 times, others 20 times 1 . Participants performed 240 experimental trials in each of the three tasks, preceded by 8 practice trials each. In total, 720 experimental trials were run. For each experimental condition, the participants’ mean accuracy in judging the two visual displays as same or different (whole-display-test task) or in deciding whether the test picture had been contained in the study display (single-item-test task) was calculated, but only for trials with a correct report of the verbal WM digit. In the analyses, interactions including the factor ”group” were of main interest, because they correspond to disorderspecific effects. Results Questionnaires
The mean scores for the two groups of participants regarding age and questionnaires are shown in Table V.1. Depression scores on the FDD, trait anxiety scores on the STAI-Trait, and both state anxiety scores on the STAI-State fell within the normal range. SFs showed slightly higher scores than NACs on the FDD and the STAI-T. There was no significant group difference regarding the pre-experimental STAI-State scores. However, SFs’ state anxiety rose slightly during the experiment, yielding a significant difference between the two groups after the experiment. None of these results compromises interpretation of the results reported below. Experimental Task
Prior to the statistical data analyses, practice trials and trials with an incorrect reproduction of the triple-digit number were discarded from the data set. The latter occurred in only 8% of all trials. Table V.2 shows the calculated mean accuracy values in judging the study display and the test display as same or different (whole-display-test) or in determining whether a single picture was shown earlier within the study display or not (single-item-test). To test the specific hypotheses stated above, we computed several specific analyses of the relevant 1
In the whole-display-test task, the combinations depicted in cells A and G in Table V.2 were presented 20 times, those of cells B, D, F, and H 10 times. In the single-item-test task, the conditions of cells A and F were presented 20 times, those of cells B, D, E, and G 10 times.
V. PAPER 4
110
Table V.1: Questionnaire scores (means, standard deviations, t-tests) of participants in Experiment 1
Spider Fearfuls
Non-Anxious Controls Significance of t-Test (df = 40) 21.6 n.s. (2.2)
Age
21.2 (2.6)
SAS
18.2 (4.4)
2.1 (3.0)
.001
FSQ
61.1 (21.0)
2.1 (2.7)
.001
FDD
6.6 (4.0)
4.0 (3.5)
.05
STAI-T
41.1 (7.7)
35.5 (7.9)
.05
STAI-S pre exp.
36.0 (5.8)
32.7 (5.8)
n.s.
STAI-S post exp.
38.4 (8.4)
32.0 (6.5)
.01
experimental conditions. To avoid inflation of alpha error in these analyses, Bonferroni corrections were used where necessary. For ease of traceability, the cells of the complete data depiction in Table V.2 are labeled from A to H. We refer to these labels when explaining our analyses. Below, effect sizes are reported as eta2 values for ANOVAs and Cohen’s d values (1988) for t-tests. Hypothesis 1: Replication of Luck and Vogel (1997) with pictures of real objects To test whether the tasks and temporal parameters employed by Luck and Vogel (1997) are suitable for pictures of real objects, we analyzed the non-spider trials only and compared the change detection accuracies across the three task types. Based on Luck and Vogel’s finding that lower accuracy with larger set sizes cannot be explained by stronger capacity competition at the encoding level, we predicted that the two whole-display-test blocks with encoding times of 100 ms vs. 500 ms should show similar effects of set size on memory accuracy. Likewise, we predicted that the 100ms-whole-display-test and the 100ms-singleitem-test task should also show similar effects of set size, based on Luck and Vogel’s finding that lower accuracy with larger set sizes is not due to difficulties at the response selection level. Therefore, we calculated a three-way ANOVA, including the within-subjects factors ”task” (100-whole-display-test, 500-whole-display-test, 100-single-item-test) and ”set size”
V. PAPER 4
111
(4, 6, 8), and the between-subjects factor ”group”. For each participant, an average memory accuracy value for non-spider trials was calculated by averaging the cells A and B of Table V.2, separately for each task and each set size. The results of this analysis are depicted in the left panel of Figure V.2. As expected, memory accuracy decreased with larger set sizes, set size: F (2, 80) = 176.42, p < .001, eta2 = .82, and participants performed very similarly in the three tasks, task: F (2, 80) = 2.46, p = .092, eta2 = .06, task x set size: F (4, 160) = 1.32, p = .267, eta2 = .03. This was true for both groups, group x task: F (1, 40) = 2.17, p = .120, eta2 = .05, and the two groups did not differ in their overall performance, group: F (1, 40) = 0.34, p = .854, eta2 = .00. Comparing the 100-whole task only to the 500-whole task also suggested that participants performed very similarly, task x set size: F (2, 80) = 0.39, p = .680, eta2 = .01. The same was true when the 100-whole task was compared to the 100-single task only, F (2, 80) = 2.44, p = .094, eta2 = .06. Table V.2: Mean accuracy (and standard deviation) in judging study and test display as same or different in Experiment 1. Spider changes in spider displays are in boldface (enhancement effects), neutral changes in spider displays are italicized (distraction effects), neutral baseline conditions are not highlighted. For ease of communication, cells are labeled with uppercase letters A to H to be referred to in the text.
Group Study Display Test Display
NAC
SF
neutral spider neutral neutral spider neutral spider neutral spider
spider neutral spider
WHOLE 100 ms set size x change 4
6
8
same
.86A (.11)
–
–
.84G (.11)
.87A (.09)
–
–
.86G (.09)
different
.79B (.15)
.85D (.17)
.85F (.11)
.78H (.10)
.80B (.23)
.88D (.15)
.92F (.08)
.84H (.21)
same
.80A
–
–
.78G
.83A
–
–
.81G
different
(.12) .57B
.69
(.11) .66H
(.08) .64B
.77
(.12)
(.21)
(.15)
(.17)
(.22)
(.21)
(.17)
(.16)
same
.81A (.11)
–
–
.83G (.07)
.86A (.09)
–
–
.82G (.13)
different
.50B (.23)
.56D (.19)
.59F (.13)
.39H (.16)
.47B (.20)
.62D (.18)
.71F (.20)
.52H (.21)
D
.67
F
D
.82
F
(.12) .60H
V. PAPER 4
112
Group Study Display Test Display
NAC
SF
neutral spider neutral neutral spider neutral spider neutral spider
spider neutral spider
WHOLE 500 ms set size x change 4
6
8
same
.88A (.11)
–
–
.88G (.08)
.89A (.08)
–
–
.91G (.09)
different
.83B (.15)
.87D (.17)
.88F (.12)
.81H (.17)
.82B (.14)
.89D (.12)
.91F (.13)
.86H (.12)
same
.82A
–
–
.84G
.83A
–
–
.82G
different
(.11) .62B
.68
(.11) .63H
(.13) .71B
.81
(.20)
(.23)
(.19)
(.22)
(.20)
(.17)
(.15)
(.18)
same
.81A (.09)
–
–
.77G (.15)
.81A (.15)
–
–
.81G (.13)
different
.55B (.20)
.66D (.28)
.60F (.26)
.54H (.15)
.53B (.21)
.72D (.18)
.74F (.19)
.55H (.19)
same
.78A (.15)
–
.80E (.18)
.88G (.11)
.75A (.18)
–
.80E (.19)
.91G (.13)
different
.93B (.10)
.86D (.16)
.89F (.09)
–
.86B (.19)
.89D (.12)
.89F (.13)
–
same
.73A
–
.67E
.81G
.66A
–
.63E
.79G
different
(.13) .78B (.14)
(.17) .76F (.12)
(.14) –
(.15) .77B (.19)
(.18) .79F (.17)
(.20) –
.79G (.17) –
.59A (.15) .66B
.69D
.59E (.22) .71F
.79G (.21) –
(.22)
(.24)
(.19)
D
.77
F
D
.85
F
(.13) .63H
SINGLE 100 ms set size x change 4
6
8
same different
D
.69 (.21)
.59A (.15) .67B
.67D
.65E (.19) .67F
(.23)
(.18)
(.15)
–
D
.81 (.17) –
V. PAPER 4
113
non-spider trials
spider trials NAC
SF
1
1
0,9
0,9 accuracy
accuracy
NAC
0,8 0,7 0,6
whole 100 whole 500 single 100
0,8 0,7 0,6
0,5
SF
whole 100 whole 500 single 100
0,5 4
6 set size
8
4
6
8
set size
Figure V.2: Memory enhancement for spider images. Mean percent correct for the three different VWM tasks in Experiment 1, separately for the three set sizes and the two groups. Left: Accuracy in detecting changes and no-changes on trials without any spiders. Right: Accuracy in detecting changes and no-changes to spider images on spider trials.
Hypothesis 2: Disorder-specific memory enhancement for spider displays To test whether the spider item enjoys a favored role in VWM and whether this is the case for both groups or only for the SFs group, we compared the change detection accuracies of the two groups in spider trials vs. non-spider trials. Additionally, we tested whether any group effects differed between the three tasks. For a mean accuracy score for non-spider trials, we averaged cells A and B for each task (see Table V.2). To calculate a mean accuracy score for spider trials, we averaged the cells D and F in the whole-display-test tasks, and the cells D and G in the single-item-test task. These values were calculated for each participant, task, and set size. Then, they were subjected to a 2x3x3x2 ANOVA involving the between-subjects factor ”group” (NACs, SFs) and the within-subjects factors ”task” (100-whole-display-test, 500-whole-display-test, 100-single-item-test), ”set size” (4, 6, 8), and ”threat” (non-spider trials, spider trials). The results are shown in Figure V.2. As in the prior analysis, memory accuracy decreased with increasing set sizes, set size: F (2, 80) = 350.87, p < .001, eta2 = .90. Moreover, spider displays were memorized better than non-spider trials, and this was especially true for the SFs group, threat: F (1, 40) = 7.24, p = .01, eta2 = .15; group x threat: F (1, 40) = 5.93, p < .05, eta2 = .13. In addition, overall memory performance and the memory advantage for spider displays differed between the three tasks, task: F (2, 80) = 4.37, p < .05, eta2 = .10, task x threat: F (2, 80) = 4.35, p < .05, eta2 = .10. To determine the nature of the latter interaction, a number of additional three-way ANOVAs were computed, separately for each task type. In each of these analyses, the factors ”group”, ”threat”, and ”set size” were included. Moreover, for the two whole-display-test conditions, we computed separate analyses for
V. PAPER 4
114
cases in which the spider item vanished from the study display to the test display versus cases in which the spider appeared. For the ”spider vanishes” calculations, we compared the mean accuracies of cell F (see Table V.2) to the mean accuracies of the corresponding non-spider cell B. For the ”spider appears” condition, we compared the means of cell D to the means of the non-spider cell B. 100-whole-display-test task (1) Spider vanishes: Both groups showed enhanced memory performance when a spider rather than a non-spider item vanished from the first display to the second, and this effect was enhanced in the SFs group, threat: F (1, 40) = 27.21, p < .001, eta2 = .41, group: F (1, 40) = 5.33, p < .05, eta2 = .12, threat x group: F (1, 40) = 4.08, p = .05, eta2 = .10. This was confirmed by supplemental two-way analyses computed separately for each group, SFs: F (1, 20) = 20.74, p < .001, eta2 = .51, NACs: F (1, 20) = 6.93, p < .05, eta2 = .26, and by analyses computed separately for each threat condition, spider condition: F (1, 40) = 16.06, p < .001, eta2 = .29, non-spider condition:F (1, 40) = 0.13, p = .725, eta2 = .00. (2) Spider appears: Considering only trials in which a spider appeared in the test display, both groups preferably noticed a ”new” spider compared to a ”new” non-spider item, and there was no group difference, threat: F (1, 40) = 68.81, p < .001, eta2 = .63, group: F (1, 40) = 0.99, p = .326, eta2 = .02, group x threat: F (1, 40) = 0.71, p = .406, eta2 = .02. This was confirmed by additional two-way analyses computed separately for each group, SFs: F (1, 20) = 43, 56, p < .001, eta2 = .69, NACs: F (1, 20) = 26, 66, p < .001, eta2 = .57, and by analyses computed separately for each threat condition, both F(1,20) < 1.50. In sum, these results conform exactly the predictions outlined above. 500-whole-display-test task (1) Spider vanishes: Both groups detected the disappearance of a spider more accurately than the disappearance of a non-spider item, and there was no difference between the two groups, threat: F (1, 40) = 18.48, p < .001, eta2 = .32, group: F (1, 40) = 2.69, p = .109, eta2 = .06, threat x group: F (1, 40) = 1.27, p = .267, eta2 = .03. This was confirmed by additional two-way analyses computed separately for each group, SFs: F (1, 20) = 13.09, p < .01, eta2 = .40, NACs: F (1, 20) = 5.74, p < .05, eta2 = .22. Additional two-way analyses computed separately for each threat condition also suggested that SFs tended to show better memory for spider changes than NACs, spider condition: F (1, 40) = 3.41, p = .072, eta2 = .08, neutral condition: F (1, 40) = 0.38, p = .542, eta2 = .01. (2) Spider appears: Both groups showed better change detection when a non-spider item was changed to a spider item than to a non-spider item, threat: F (1, 40) = 15.14, p < .001, eta2 = .28, group: F (1, 40) = 1.80, p = .187, eta2 = .04, threat x group: F (1, 40) = 1.03, p = .318, eta2 = .03. Additional two-way analyses, computed separately for each group, suggested that this threat advantage was slightly stronger in the SFs group, F (1, 20) = 18.23,
V. PAPER 4
115
p < .001, eta2 = .48, than in the NACs group, F (1, 20) = 3.09, p = .094, eta2 = .13. However, two-way analyses computed separately for each threat condition revealed that the two groups did not differ from each other in any of the threat conditions, spider condition: F (1, 40) = 2.31, p = .136, eta2 = .06, non-spider condition: F (1, 40) = 0.38, p = .542, eta2 = .01. In general, these results also agree with the predictions outlined above, except that the disorder-specific advantage of SFs was slightly weaker than in the 100-whole-display-test task. 100-single-item-test task. Both groups, but especially the SFs, performed better when this picture depicted a spider rather than a neutral item, threat: F (1, 40) = 19.53, p < .001, eta2 = .33, group: F (1, 40) = 0.01, p = .960, eta2 = .00, threat x group: F (1, 40) = 3.83, p = .057, eta2 = .09. Additional two-way analyses computed separately for each group indicated that the threat advantage was significant for SFs, F (1, 20) = 21.96, p < .001, eta2 = .52, but not for NACs, F (1, 20) = 2.82, p = .109, eta2 = .12. Separating the two threat conditions suggested that SFs did not perform significantly better than NACs in any of the conditions, spider condition: F (1, 40) = 1.01, p = .320, eta2 = .03, non-spider condition: F (1, 40) = 1.11, p = .299, eta2 = .03. In sum, these results replicate those of the 500-whole-display-test task, and they largely agree with the predictions outlined above, except that the disorder-specific advantage of SFs was slightly weaker than in the 100-whole-display-test task. Hypothesis 3: Visual memory distraction in spider displays As the prior analyses revealed enhanced memory for spiders, we also tested whether this advantage came at the expense of memory for non-spider items. Therefore, we compared memory accuracy for non-spider items in displays without spiders to accuracy for the same items in displays including a spider. For the non-spider trials, we again included the means calculated from cells A and B. For the spider trials (i.e., the mean accuracy in detecting changes to non-spider items when a spider is present within the display), we averaged the cells G and H in the whole-display-test tasks and the cells E and F in the single-item-test task. This added up to a 2x3x3x2 ANOVA involving the between-subjects factor ”group” and the within-subjects factors ”task” (100-whole-display-test, 500-whole-display-test, 100-singleitem-test), ”set size” (4, 6, 8), and ”spider presence” (non-spider trials, spider trials). There were no costs in any of the groups in noticing a non-spider change when a spider was visible vs. when there was no spider present, presence: F (1, 40) < 0.01, p = .995, eta2 = .00, group: F (1, 40) = 0.28, p = .598, eta2 = .01, presence x group: F (1, 40) = 0.73, p = .400, eta2 = .02. In addition, there were no differences in the degree of distraction between the three task types, presence x task: F (2, 80) = 0.40, p = .673, eta2 = .01, presence x task x group: F (2, 80) = 0.33, p = .723, eta2 = .01. This was confirmed by additional three-
V. PAPER 4
116
factorial analyses computed separately for each task type, threat: all F (1, 40) < 0.40, group: all F (1, 40) < 1.94, threat x group: all F (1, 40) < 1.14. In sum, recognition probability of changes applied to non-spider items did not to depend on the presence of a spider item within the display. Discussion Experiment 1 revealed that the VWM task introduced by Luck and Vogel (1997) is suitable for studying VWM for real objects. Replicating the task with whole objects, accuracy curves for non-spider trials were very similar to the ones reported by Luck and Vogel (1997), independent of encoding time of (100 ms vs. 500 ms) and test condition (whole-display-test vs. single-item-test). Therefore, lower memory for displays with higher set sizes was not related to increasing difficulties at the performance level or the response level, but at the WM level. In addition, we were also able to detect some general emotion effects, and some disorder-specific effects of a threatening picture on WM performance. In general, displays in which a spider was the object of change were better memorized by both groups, but this effect was stronger in the SFs group, and the group differences were especially large in the 100-whole-display-test task. In this task, we also found differences between spider-vanish and spider-appear trials: When a spider had not been part of the study display but appeared in the test display (spider-appear), both groups preferably noticed this change, compared to non-spider changes. The same was true for trials in which a spider item of the study display was replaced by a non-spider item (spider-vanish), but in this case, the effect was significantly larger in SFs. In the 500-whole-display-test task, the analyses revealed better WM for spider changes in both conditions (appearing and vanishing spider), for both groups. There is a only tendency of a stronger threat effect in SFs, especially in the condition ”spider vanishes”. In the 100-single-item-test task, the analyses also revealed better WM for spider displays in both groups, again with a slightly stronger effect in the SFs. Interestingly, none of the observed memory advantages for spiders were related to costs in VWM. That is, all participants performed comparably well in noticing a change made to a non-spider item, no matter whether there was a spider item visible within the displays or not. This seems contrary to Rinck et al. (2005) who found clear distraction effects in a visual search paradigm. We will get back to this topic in the General Discussion section. To summarize, we found the strongest disorder-specific group differences with a short encoding time and with threat trials in which a spider vanished instead of appeared. Thus, the data do indeed imply disorder-specific VWM biases, because the accurate detection of the disappearance (rather than appearance) of a spider reflects WM for the spider. In addition, the disorder-specificity seems to trace back to an exceptionally fast encoding of the spider
V. PAPER 4
117
item in the SFs group, as the strongest group differences were observed in tasks with only 100 ms encoding time. A more elaborate discussion of these results, especially of the role of automatic versus strategic encoding processes, is provided in the General Discussion section.
Experiment 2: VWM for Spiders and Snakes in Spider Fearfuls Introduction Experiment 1 demonstrated that spider fearfuls show enhanced VWM for spider displays compared to non-anxious controls. In Experiment 2, we tested whether this advantage is not only disorder-specific, but also materials-specific. Do spider fearfuls show improved memory performance only for the stimuli they are afraid of, namely, spiders? Or does the memory advantage occur for all kinds of threatening animals? To answer these questions, in Experiment 2, a group of spider fearfuls was compared to a group of non-anxious controls, while both groups were without fear of snake. We repeated the original whole-display-test block condition with a study display presentation time of 100 ms, once with a spider as the critical stimulus, once with a snake. The spider task served to replicate the spider-related results observed in Experiment 1, and the snake block served to determine VWM performance for snakes. The 100ms-whole-display-test task was chosen because the results of Experiment 1 suggest that it differentiates best between highly fearfuls and non-anxious controls. The following hypotheses were tested: (1) Both groups show enhanced WM performance for spiders and snakes compared to neutral items. (2) The enhanced performance for spiders is especially pronounced in SFs. (3) The two groups do not differ regarding WM enhancement for snakes. Methods Participants
23 spider fearfuls (SFs) and 23 non-anxious controls (NACs) without any animal-oriented fears were tested. None of them had participated in Experiment 1. The recruitment and selection procedure was identical to that of Experiment 1, except for the addition of the ”Snake Anxiety Screening” (SCANS; Reinecke, Becker, & Rinck, submitted-b) and the SCAF, which is the German version of the ”Snake Anxiety Questionnaire” (SNAQ, Klorman, Hastings, Weerts, Melamed, & Lang, 1974; see Reinecke et al., submitted-b), and the addition of the DSM-IV criteria for snake phobia to the diagnostic interview. Only candidates who fulfilled none of the DSM-IV criteria for specific snake phobia, and who had a maximum SCAF score of 10 (SCAF: min 0, max 30) were allowed to participate in the experimental task. On average, the 19 female and 4 male members of the NACs group were 22.6 years old (SD = 4.2), the 19 female and 4 male participants of the SFs group had a mean age of 21.6 (SD = 2.8).
V. PAPER 4
118
Table V.3: Questionnaire scores (means, standard deviations, t-tests) of participants in Experiment 2
Spider Fearfuls
Non-Anxious Controls Significance of t-Test (df = 44) 22.6 n.s. (4.2)
Age
21.6 (2.8)
SAS
17.8 (3.3)
1.7 (1.4)
.001
FSQ
61.2 (18.7)
2.0 (2.3)
.001
SCANS
2.8 (2.0)
1.9 (1.7)
n.s.
SCAF
5.4 (2.7)
3.9 (3.2)
n.s.
FDD
5.1 (3.1)
3.4 (3.3)
n.s.
STAI-T
40.3 (8.4)
35.6 (5.9)
.05
STAI-S pre exp.
38.0 (7.9)
33.5 (4.7)
.05
STAI-S post exp.
39.1 (7.1)
37.3 (6.7)
n.s.
Five of the 23 SFs fulfilled all DSM-IV criteria for a specific phobia of spiders. The participation was honored with course credit or payment of 5 EUR per hour.
Materials and apparatus
The apparatus and experimental stimuli were identical to those of Experiment 1, except for the addition of a second critical stimulus, namely, a snake image. The snake was colored black, and its picture had the same high contrast as the spider picture. Participants completed two different blocks of trials: In one block, the spider image from Experiment 1 was the critical item, in the other block, the new snake image was used. The order of the two blocks was counterbalanced across participants. Both blocks employed the 100-whole-display-test of Experiment 1. A complete session took about 90 minutes.
V. PAPER 4
119
Design
The design was nearly the same as in Experiment 1, with the only difference that the twolevel factor ”critical stimulus” (spider, snake) was included instead of the three-level factor ”task”. Thus, the incomplete 2x2x3x2x2x2 factorial design included the between-subjects factor group (SFs, NACs) and the within subjects-factors set size (4, 6, 8), critical stimulus (spider, snake), study display (non-critical, critical), test display (non-critical, critical) and change type (same, different). The frequency of the two response categories ”same” vs. ”different” and the two study display categories ”critical-display” vs. ”non-critical display” was balanced as in Experiment 1. In total, 480 experimental trials were run. For all trials with a correct reproduction of the three-digit number, we calculated the mean memory accuracy for each valid combination of factors. Results Questionnaires
The mean scores, standard deviations, and significances of t-tests of age and questionnaires for both groups of participants are depicted in Table V.3. None of the results compromises interpretation of the results reported below. Experimental Task
Data aggregation and calculation were identical to Experiment 1. Table V.4 shows mean accuracies in judging the two displays sets as same or different, separately for each possible combination of ”critical stimulus”, ”study display”, ”test display” and ”change type”. We again computed several specific analyses of the relevant experimental conditions in order to test the specific hypotheses laid out above, and we refer to the cell indices of Table V.4 for ease of communication. To test whether the enhancement effects observed in Experiment 1 are disorder-specific, we compared the change detection accuracies of both groups to each other, separately for spider trials vs. non-spider trials and snake trials vs. non-snake trials. The mean accuracies for non-critical trials in the spider block and the snake block were calculated by averaging the cells A and B (see Table V.4) in each case. To determine a mean accuracy value for the spider trials and the snake trials, we averaged the cells D and F of each block condition. These values were calculated for each participant and each set size and were afterwards subjected to two three-way ANOVAs (one for spiders, one for snakes), involving the factors ”group” (SFs, NACs), ”threat” (non-critical trials, critical trials), and ”set size” (4, 6, 8). The results are depicted in Figure V.3. In both blocks, memory accuracy decreased with increasing set size, spider: F (2, 88) = 59.52, p < .001, eta2 = .58, snake: F (2, 88) = 86.53, p < .001, eta2 = .66.
V. PAPER 4
120
Table V.4: Mean accuracies (and SD) in Experiment 2, separately for both critical stimuli types. Critical changes in critical displays are in boldface (enhancement effects), neutral changes in critical displays are italicized (distraction effects), neutral baseline conditions are not highlighted. Means are labeled A to H for ease of communication.
Group Study Display Test Display
NAC neutral neutral critic.
SF
spider neutral neutral critic. neutral critic.
spider neutral critic.
SPIDER set size x change 4
6
8
same
.88A (.10)
–
–
.91G (.09)
.92A (.06)
–
–
.90G (.08)
different
.73B (.22)
.85D (.18)
.89F (.10)
.71H (.20)
.73B (.21)
.95D (.08)
.97F (.05)
.73H (.22)
same
.84A (.11)
–
–
.87G (.10)
.87A (.11)
–
–
.88G (.09)
different
.43B (.18)
.78D (.20)
.84F (.18)
.51H (.21)
.49B (.20)
.88D (.16)
.95F (.08)
.46H (.21)
same
.85A (.10) .49B
–
–
–
.77F
.89A (.09) .43B
–
.70D
.85G (.10) .37H
.87D
.89F
.84G (.10) .34H
(.17)
(.21)
(.27)
(.16)
(.14)
(.14)
(.13)
(.18)
same
.88A
–
–
.89G
.90A
–
–
.87G
different
(.08) .72B (.17)
.85D (.13)
.96F (.08)
(.08) .76H (.22)
(.08) .78B (.17)
.88D (.14)
.90F (.09)
(.11) .75H (.22)
different SNAKE set size x change 4
6
8
same
.86A (.10)
–
–
.86G (.09)
.85A (.08)
–
–
.85G (.09)
different
.51B (.18)
.77D (.20)
.83F (.18)
.53H (.25)
.60B (.22)
.81D (.19)
.85F (.13)
.58H (.24)
same
.86A (.10)
–
–
.88G (.08)
.83A (.15)
–
–
.82G (.13)
different
.39B (.17)
.65D (.22)
.67F (.23)
.36H (.15)
.48B (.16)
.73D (.16)
.75F (.22)
.43H (.23)
V. PAPER 4
121
In the spider block, both groups exhibited higher accuracy in detecting spider changes than non-spider changes, threat: F (1, 44) = 74.04, p < .001, eta2 = .63, and this advantage was especially enhanced in the SFs group, group x threat: F (1, 44) = 7.59, p < .01, eta2 = .15, group: F (1, 44) = 9.86, p < .01, eta2 = .18. This finding was confirmed by additional two-way ANOVAs (”threat” x ”set size”), computed separately for each group, SFs: threat F (1, 22) = 80.49, p < .001, eta2 = .79, NACs: threat F (1, 22) = 14.28, p = .001, eta2 = .39. Two-way ANOVAs (”group” x ”set size”) computed separately for each ”threat” condition confirmed that SFs performed significantly better than NACs on spider trials, F (1, 44) = 12.89, p = .001, eta2 = .23, but not on non-spider trials, F (1, 44) = 0.71,p = .405, eta2 = .02. In the snake block, both groups performed better to a comparable degree in detecting snake changes than non-snake changes, threat: F (1, 44) = 25.06, p < .001, eta2 = .36, group: F (1, 44) = 2.80, p = .102, eta2 = .06, threat x group: F (1, 44) = 0.02, p = .886, eta2 = .00. This was confirmed by additional two-way ANOVAs computed separately for each group, SFs: F (1, 22) = 14.88, p = .001, eta2 = .40, NACs: F (1, 22) = 11.00, p < .01, eta2 = .33, and separately for each threat condition, snake condition: F (1, 44) = 1.03, p = .317, eta2 = .02, non-snake condition: F (1, 44) = 3.74, p = .060, eta2 = .08.
spider block
snake block
SF
NAC
1
1
0,9
0,9
0,8
0,8
accuracy
accuracy
NAC
0,7 0,6
0,7 0,6
critical neutral
0,5
SF
critical neutral
0,5 4
6 set size
8
4
6 set size
8
Figure V.3: Disorder-specific memory enhancement. Mean percent correct depending on group, set size, and critical stimulus in Experiment 2. Left: Accuracy in the spider block. Right: Accuracy in the snake block.
The previous results indicate that SFs were better than NACs at detecting spider changes, but not at detecting snake changes. An additional set of analyses was conducted to determine whether the SFs, but not the NACs, would also detect spider changes better than snake
V. PAPER 4
122
changes. We computed a three-way ANOVA including the factors ”group”, ”set size”, and ”threat item” (spider, snake). This analysis included all trials for which a change was applied to a spider or a snake, respectively (averaged cells D and F, see Table V.4). The analysis indicated that indeed only SFs showed better WM performance for spiders than for snakes, threat item: F (1, 44) = 9.22, p < .01, eta2 = .17, group: F (1, 44) = 7.71, p < .01, eta2 = .15, threat item x group: F (1, 44) = 4.81, p < .05, eta2 = .10. This was confirmed by additional two-way ANOVAs computed separately for each group, which revealed a significant main effect of the factor ”threat item” for SFs, F (1, 22) = 16.98, p < .001, eta2 = .44, but not for NACs, F (1, 22) = 0.30, p = .591, eta2 = .01. Discussion Experiment 2 revealed significant VWM advantages for both of the critical stimulus types compared to non-critical stimuli in both of the groups. Regarding snakes, there were no group differences. Regarding spiders, there was a significant group difference, indicating an additional memory advantage for spiders in spider fearfuls. Thus, pictures of snakes are likewise special for spider fearfuls and non-anxious controls. Pictures of spiders are also special for both groups, but especially for spider fearfuls. We will discuss this finding in more detail in the following General Discussion section.
General Discussion In two change detection experiments, we investigated biases in visual working memory in spider fearfuls. In Experiment 1, we tested whether a VWM task adapted from cognitive psychology (Luck & Vogel, 1997) is also suitable to the study of VWM of real object pictures. Moreover, we studied the temporal circumstances under which the threat value of an item has general vs. disorder-specific influences on VWM processes. Experiment 2 was conducted to investigate whether the disorder-specific effects found in Experiment 1 were material-specific as well. In the non-spider trials of Experiment 1, we found identical results in all of the three tasks and in both participant groups. Therefore, the experimental parameters provided by Luck and Vogel (1997) seem suitable for the measurement of working memory for real objects. When displaying a spider, results were different, indicating that the emotionality of an item has a significant impact on VWM. Overall, both groups, but especially the SFs group, performed better with spider displays than non-spider displays, which is in line with earlier results on VWM biases (Reinecke et al., submitted-a). In both the single-item-test task and the whole-display-test tasks, we found additional disorder-specific memory advantages in the SFs group, favoring the processing of spider items in VWM. For whole-display-test tasks, this disorder-specific advantage of spiders occurred only in the ”spider vanishes”
V. PAPER 4
123
condition, and it was especially strong with the shorter encoding time of 100 ms. With the longer encoding time of 500 ms, there was only a tendency of a group difference left. Interestingly, all these memory advantages for spiders were not related to memory costs for other items. Experiment 2 revealed that both SFs and NACs exhibited a memory advantage for spider displays and snake displays compared to non-critical displays. Only in the spider block, however, did the SFs group perform even better than the NACs group in memorizing the critical item (spider vs. snake). SFs’ memory performance for spider displays was significantly better than their performance for snakes, while no such difference occurred in NACs. To summarize, the current data indicate some general effects of emotional contents on VWM, in addition to some disorder-specific biases. General impact of threat value on VWM. In Experiment 1, both groups showed enhanced memory for spider displays compared to non-spider displays, although one of the groups did not fear spiders at all. Moreover, in Experiment 2, both groups, although without fear of snakes, showed enhanced change detection performance for snake displays. How could this be explained? On the one hand, it might suggest that evolutionary relevant stimuli are not only preferably attended to (e.g. Oehman et al., 2001), but also preferably stored in VWM. This would be in line with the theory of preparedness, implying that humans are predisposed to be alert of situations and animals that threatened survival (Seligman, 1971). On the other hand, it is possible that the enhancement would be observable with all kind of negative or emotional material. This study was not designed to draw final conclusions regarding the impact of evolutionary relevance in VWM, but it would be a worthwhile extension of the current research to repeat the task with a common neutral or positive object or modern threat items (e.g., a hand grenade). One might also wonder whether the psychophysical salience of the spider and snake pictures may account for the memory advantages observed in both groups. After all, both pictures had a distinctive pattern and color, and they were of high contrast. However, this potential explanation was already tested and excluded by Reinecke et al. (2006). Disorder-specific impact of threat on visual working memory.
As mentioned, for
non-threatening objects we found that VWM effects were completely independent of the participant group, of the encoding time of the study display (100 ms vs. 500 ms), and of the type of test display (whole-display-test vs. single-item-test). However, when displaying a spider among otherwise non-threatening objects, differences between spider fearfuls and non-anxious controls occurred, and these differences varied between the three task types. What does that tell us about disorder-specific processing biases in specific phobias? In Experiment 1, the most striking disorder-specific advantages were observed
V. PAPER 4
124
when we used a whole-display-test task with a very short encoding time, and when the spider image vanished from the first display to the second. With a longer encoding time of the study display, group differences were reduced, indicating that NACs were able to compensate for the disorder-specific processing advantage that SFs had when encoding time was short. Thus, the data confirm our hypothesis that group differences should be especially strong when the experimental condition measures VWM for spider images, that is, when a spider is visible within the study display, but vanishes when the test display is shown. Beyond that, the disorder-specific bias demonstrated here seems to be based on automatic rather than strategic processes, as it is strongest with short encoding times. It seems that the disorder-related VWM biases found here are based on disorder-related attentional biases allowing a quick and automatic preferential encoding of spider items. Indeed, many empirical studies demonstrate that anxiety disorders are coupled with a very quick engagement of attention to the feared stimulus (for a review, see Williams et al., 1997). In the study displays of our tasks, several very briefly presented stimuli were competing for attention, and all participants had the rather unrestricted task to memorize as much of the visual scene as possible. It can be argued that 100 ms are sufficient for fearful observers to immediately detect a spider item within the visual display, as they presumably attend to the feared stimulus reflexively. Non-anxious participants, however, probably follow the instructions in a more goal-oriented way, and try to encode as many stimuli as possible, without any automatic preferences. This interpretation seems plausible in light of the observations of Oehman et al. (2001) who found that the search for fear-relevant stimuli is very effective, quick, and independent of display size, whereas the search for fear-irrelevant items seems to be less effective and dependent on display size. Since being attended to is the prerequisite for an item’s being stored in VWM, it is most likely that in our task, a spider item is quickly and automatically transferred into VWM by SFs. For NACs, however, the probability of a spider item being stored in VWM is (aside from some possible evolution-based advantage that would occur to a similar degree in all participants) similar to the probability of storing a non-threatening item. Of course the probability of storing the spider item increases with increased presentation time of the display containing it. Therefore, with an encoding time of 500 ms, the probability of a spider item being stored in VWM by NACs nearly overrules any disorder-specific advantages that SFs might have. The same is true for when a spider appears not until the second display: In this spider-appears condition, all participants have up to 2 s time to decide whether the spider was presented earlier or not, and no group differences occur. And why did we fail to find stronger group differences in the 100-single-item-test task? That we observed effects at all, we assume, is due to the short presentation time of the study
V. PAPER 4
125
display, which seems to be a prerequisite for the observation of group differences. However, in both whole-display-test tasks, we observed stronger group differences for ”spider vanishes” conditions than for ”spider appears” conditions. In the single-item-test task, this differentiation is not possible, diluting the observed effects. Moreover, we assume that the failure to find strong group differences in the 100-single-item-test task is due to different response strategies: in a whole-display-test task, participants may report their reflexive observation that the spider item has vanished; in a single-item-test task, they have to engage in a voluntary memory search for the spider item presented in the single-item-test study display. Interestingly, the disorder-specific memory advantages for spiders were not accompanied by disorder-specific costs in VWM. We assume that the memory advantages are due to an additional processing path specific in spider fearfuls. As suggested by Rensink et al. (1997), high-level representations might be involved in the guidance of attention through a scene. Also, Buttle and Raymond (2003) conclude that familiarity ”promotes highly efficient visual processing and may especially activate a configural mode of analysis” (p. 1296). This is very similar to the assumption of Cave and Batty (2006) that experience with a specific object stimulus provides stronger connections between the high-level representation of that object and its specific combination of visual features. Spider fearfuls may have more ”practice” with processing spiders, and the fear representation should therefore be more highly activated, which should lead to a better perception of spiders. At first glance, the lack of distraction effects seems to run counter to empirical results of attentional bias research, which often demonstrated distraction of attention by threatening stimuli in SFs in visual search tasks (e.g., Rinck et al., 2005). Comparing visual search studies investigating attentional biases to the experiments presented here, we can determine one very prominent difference: experiments investigating distraction of attention without externally guiding the observers attention typically use numerous pictures of the feared stimulus as distractors, whereas we presented only a single spider image. Some limitations of the current study also have to be mentioned. First, as mentioned above, the study was not designed to determine whether memory advantages found in both groups are due to the outstanding valence of the items or due to evolutionary relevance. Further research with suitable stimuli will be needed to answer this question. Second, further research should also determine whether the VWM effects observed here generalize to other anxiety disorders than specific phobias. Nevertheless, our study contributes to current research on disorder-specific biases in several ways. The three-fold VWM task adapted from Luck and Vogel (1997) yielded conclusions regarding the nature of VWM biases in specific fears and phobias which were more specific than those derived from earlier work (Reinecke et al., 2006, submitted-a). On the one hand, we were able to confirm that the individual threat
V. PAPER 4
126
value of a stimulus seems to be important for change detection performance and, therefore VWM, as threatening images were preferably stored into VWM. Moreover, the current work indicates that these advantages trace back to a very fast and reflexive encoding of the spider image instead of a voluntary, strategic memorizing. This result adds to finding the ”missing link” between attentional biases and memory biases in fears and phobias. In addition, we were able to provide some information to the question where ”avoidance of deeper elaboration” in terms of Williams et al. (1997) starts. It seems not only to occur beyond attention, but also beyond working memory.
VI. Paper 5: How preferential is the preferential encoding of threatening stimuli? Working memory biases in specific anxiety and the Attentional Blink
Abstract Temporal visual working memory (VWM) biases in spider anxiety were studied with an Attentional Blink paradigm. In Experiment 1, participants viewed pictures sequentially presented at rates of 80 ms and were instructed to memorize two target pictures. We varied time between targets and valence of the second target (neutral: mushroom, positive: blossom, negative: spider). In Experiment 2, spider fearfuls and non-anxious controls (both without snake anxiety) participated. Here we tested two negative targets: disorder-related spiders and disorder-irrelevant snakes. Both positive and negative items were memorized more successfully than neutral targets. Spiders were preferentially recalled by spider fearfuls compared to non-anxious controls, implying temporal VWM biases in spider anxiety.
Introduction Specific phobias belong to the most common mental disorders (e.g., ESEMed Investigators, 2000) with a lifetime prevalence of 8-12% (Kendler, Neale, Kessler, Heath, & Eaves, 1992; Magee, Eaton, Wittchen, McGonagle, & Kessler, 1996) to 25.6% (Regier, Rae, Narrow, Kaelber, & Schatzberg, 1998); impairments in everyday life from these disorders can be far reaching (Wittchen, Nelson, & Lachner, 1998). Cognitive models of anxiety (e.g., Beck, Emery, & Greenberg, 1985; Clark & Wells, 1995; Williams, Watts, MacLeod, & Mathews, 1997) postulate that disorder-specific biases in information processing are relevant for the etiology and maintenance of these disorders. Accordingly, a phobic seems to pay more attention to feared aspects of the environment (e.g., to spiders and spider webs). Phobics are more likely to notice feared stimuli, supporting their impression of a dangerous world, confirming their dysfunctional beliefs and resulting in increased checking behavior. In a spider phobic’s world, it seems as if there are more spiders, enforcing their avoidance behaviors and thus the anxiety disorder is maintained.
127
VI. PAPER 5
128
Ample evidence exists in specific phobia that affected individuals show attentional biases for feared stimuli (for reviews, see, Mathews & MacLeod, 2005; Williams et al., 1997), implying a fast and automatic shift of attention to threat items and therefore greater distractibility from other stimuli when threat is present. Empirical support for memory biases in specific phobia is less clear; some studies report memory biases, some do not (for a review, see Williams et al., 1997). One possible explanation for the strong evidence of attentional biases and weak evidence of memory biases, is found in the vigilance-avoidance theory (Williams et al., 1997). It implies a rapid switch of attention towards threatening stimuli, but avoidance of deeper elaboration on the feared materials. But exactly what is ”deeper elaboration”? Does it start in visual working memory (VWM)? This question is difficult to answer, as there seems to be a missing link in research on cognitive biases in specific phobia, namely the attentional bottleneck and VWM. In earlier studies of visual working memory biases in anxiety disorders, we observed enhanced VWM for spider images in spider fearfuls compared to non-anxious controls in a spatial cueing paradigm (Reinecke, Becker, & Rinck, submitted-a; Reinecke, Rinck, & Becker, 2006) and in a change detection task (Reinecke, Becker, Rinck, submitted-c). The results of these studies imply that the avoidance of deeper elaboration on threatening materials (Williams et al., 1997) does not start in working memory. Moreover, the results suggest that the basis for disorder-specific VWM biases must be a preferential and very quick automatic encoding of spider items into VWM. However, these previous studies assessed only the spatial aspects of working memory biases, as the threatening image was presented among several non-threatening pictures. Specific details of this fast, automatic encoding process remain unexplained. Exactly how circumscribed is the preferential selection of threat items? Does it occur at the expense of other stimuli undergoing the capacity-limited encoding process? That is, would the presentation of a spider item interrupt the ongoing encoding of other items in the processing channel? Would it cause premature drop-out, resulting in incomplete processing of other items? To answer these questions, a paradigm with a high temporal, rather than spatial resolution was required. Such a task, addressing the consolidation of items, would allow for the investigation of temporal working memory biases in specific anxiety. Fortunately such a task exists, namely the Attentional Blink (AB) paradigm. In an AB task, participants are asked to attend to a series of rapidly presented stimuli (i.e. letters, words, or pictures) and to focus on two targets (T1 and T2) defined by unique visual features (i.e. color, size or category; Broadbent & Broadbent, 1987; Intraub, 1985; Kanwisher, 1987; Weichselgartner & Sperling, 1987), while the time between these two targets is varied. For instance, Shapiro, Raymond, and Arnell (1994) asked their participants to attend to a stream of black letters, identify the first target (indicated by a white color) and determine
VI. PAPER 5
129
whether a second target (a black ”X”), was present. For a wide variety of emotionally neutral materials, observers showed reduced report accuracy for the second target when it was preceded by another attended target within a temporal distance of 100 to 400 ms (e.g., Broadbent & Broadbent, 1987; Raymond, Shapiro, & Arnell, 1992; Reeves & Sperling, 1986). This phenomenon of impaired information processing is called the Attentional Blink. Most authors investigating the AB hold post-perceptual processes such as working memory consolidation responsible for the performance decrease (e.g., Chun, 1997; Chun & Potter, 1995; Jolicoeur & Dell’Acqua, 2000; Olson, Chun, & Anderson, 2001; Vogel, Luck, & Shapiro, 1998). The two-stage model proposed by Chun and Potter (1995) assumes that the AB phenomenon traces back to capacity limitations at the second of two processing stages required for correct target report, namely, working memory consolidation. Following this model, a very broad but rough representation is built at the first stage, allowing the detection of target-defining features. Only at the second stage of information processing is a more durable and valid object representation created, involving consolidation into working memory allowing full identification of the object, which is a prerequisite for correct report. However, this stage operates rather slowly and serially: only after the first target has completely passed through this phase can the next target enter. As this second phase lasts longer than the presentation of items within the rapid serial string, subsequent items can enter the first, but not the second stage before processing is complete. The longer the second item must be preserved in the first stage, the higher the probability of losing its representation, causing lower report rates of T2 items if they appear within the temporal frame of stage two processing of T1 (see Potter, Staub, & O’Connor, 2002; Raymond, 2003; Zuvic, Visser, & DiLollo, 2000). This model is further supported by electrophysiological data (Luck, Vogel, & Shapiro, 1996; Vogel & Luck, 2002; Vogel, Luck, & Shapiro, 1998). The AB paradigm is useful for the study of cognitive biases in specific phobia because it allows us to answer the following questions: When we present individually threatening stimuli – what information is preferentially selected for processing at a higher level? Does the general rule ”first in, first out” apply - implying that the T1 item stage 2 processing is completed before a subsequent T2 item can enter? Or can incoming threatening stimuli disrupt ongoing processing? Thus far, only a few studies have addressed the characteristics of the AB phenomenon with emotional materials. Smith and colleagues (Smith, Most, Newsome, & Zald, 2006), for instance, reported decreased report probability for neutral T2 pictures when these were preceded by aversively conditioned (but originally neutral) photographs. Manipulating T1 as either neutral or emotional, Arend and Botella (2002) compared the AB magnitude in low vs. high-trait anxious participants. In contrast to Smith et al. (2006), they observed reductions in AB effect for emotional words in high-trait anxious only, indicating disorder-specific influence on the AB effect. However, in both of these studies, the valence of the first target was varied, which means that the duration
VI. PAPER 5
130
of consolidation for emotional materials and subsequent encoding of neutral materials was investigated. Thus, these studies addressed whether the second stage as described by Chun and Potter (1995) is faster or slower for emotional materials, but not whether disorder-specific emotionality can affect general laws like ”first in, first out”. Keil and Ihssen (2004) investigated the AB phenomenon with neutral, pleasant, and unpleasant T2 verbs in rapid serial visual streams. Participants were asked to select the two green-colored target words from a string of otherwise white-printed distractors. With shorter T1-T2 distance, the accuracy in reporting T2 was reduced, which is the Attentional Blink phenomenon. Enhanced report rates for T2 (a reduction of the AB) was observed for all T2 that were rated as emotionally salient and highly arousing. The authors concluded that ”affectively arousing information is selected preferentially from a temporal stream, facilitating processes such as working memory consolidation and action”. Similar results were reported by Anderson (2005). While Keil and Ihssen (2004) found no influence of T2 valence on T1 report accuracy, Anderson (2005) found some evidence that negative, arousing T2 stimuli affect T1 performance. However, neither study investigated whether individual differences in T2 salience were related to report probability of T1. When, for instance, the negative T2 stimulus depicts a spider – is the subsequent AB reduction related to the participant’s anxiety for spiders? Or, in other words, when the AB mirrors the loss of information at a post-perceptual stage – does individual threat positively influence the preservation of information? To the best of our knowledge, only two studies have investigated the AB magnitude in relation to anxiety for T2 stimuli. Fox, Russo, and Georgiou (2005) found a reduced AB for fearful T2 faces in a high-trait anxiety group and no effects of T2 valence on T1 report accuracy, suggesting that anxiety reduces the attention needed for processing of threatening materials. In contrast, de Jong & Martens (2006) reported similar reductions in AB for angry compared to happy T2 faces, but also reduced T1 report accuracy with angry T2 faces, indicating that threat is not only preferably attended, but also favored in the competition for consolidation in VWM. However, the authors observed this effect in both high and low socially anxious participants. The differences in these two studies regarding T1 effects make it difficult to conclude whether increased response rates for negative T2 are truly related to prioritized VWM consolidation at the expense of T1. These differences might be related to the study samples and to individual threat relevance of the employed stimuli: for highly socially anxious individuals, faces depicting negative expressions might be more relevant than for high-trait anxiety participants. A good match between the type of anxiety and the presented materials might be critical for AB results. In addition, both studies tested small samples of 14 to 17 participants. Differences between study results could possibly be a result of lack of power. This might also hold for the lack of group differences in the study reported by de Jong and
VI. PAPER 5
131
Martens (2006). Moreover, neither study included neutral targets. Therefore, it is not clear whether the reduction in AB found with negative T2 are due more to efficient detection of threat or to reduced efficacy in detection of happy faces. Likewise, it is not clear whether an angry T2 is preferentially encoded at the cost of T1, or whether a positive T2 is less efficiently encoded in favor of T1. In the present study, we attempt to overcome these limitations by testing a larger sample, by including a neutral T2 category, and by emphasizing the selection of anxiety-specific threat materials. Only when biases occur exclusively in the presence of disorder-specific materials should they be considered relevant in the genesis and maintenance of the affliction. We investigated an anxiety disorder that has, thus far, not been investigated with an AB paradigm, namely, spider phobia. Here, the scope of fear is clearly limited to spiders. In two AB experiments, participants were instructed to attentively follow a string of pictures and then report the two target items indicated by a brighter background. In Experiment 1, participants with varying levels of spider anxiety viewed rapid serial presentations of 15 mostly neutral images. The valence of the second target (T2) was varied, depicting either a neutral (mushroom), positive (blossom), or a negative image (spider). Additionally, the time between the two targets (T1 and T2) was varied in order to get information about the onset and duration of the AB under different valence conditions. We were interested in whether there was enhanced report for negative T2 and whether this advantage was related to the individual’s spider anxiety. Furthermore, we were interested in T1 report deficiencies when negative T2 images were presented. In Experiment 2, we repeated the same paradigm, while modifying T2 type and participant characteristics: in addition to the negative ”spider” stimulus, we presented pictures of snakes. Observers were either spider-fearful or non-spider-anxious, both without snake anxiety. This experimental design allows for conclusions regarding disorder-specific biases in the temporal processing of spiders and whether these effects appear only with spiders or also with other negative materials unrelated to the disorder.
Experiment 1: The Attentional Blink For Emotional Pictures in a Random Sample Introduction In an AB task, the probability of reporting the second of two targets is reduced when it appears approximately 100 to 500 ms after the first. This has previously been explained by capacity-limitations at the stage of working memory consolidation. However, research on attentional biases in specific phobia suggests that emotionally relevant stimuli are processed preferentially, presumably automatically (e.g., Williams, Mathews, & MacLeod, 1996). For
VI. PAPER 5
132
evolutionary relevant materials, such as spiders or snakes, this effect occurs in all people, but is particularly strong for those who are afraid of the employed stimulus (e.g., Oehman, Flykt, & Esteves, 2001). The current study was designed to investigate whether such a bias occurs in an Attentional Blink paradigm. We sought to answer the following questions: (A) Is the attentional blink reduced in amplitude and duration when T2 depicts a spider compared to neutral or positive images? (B) If spider T2 images lead to reduced AB, is this reduction related to the individual’s spider anxiety? (C) Does the presentation of spider T2 images influence the report accuracy for T1 in comparison to neutral and positive T2? For instance, does a spider image disrupt the rule ”first in, first out” such that it is preferably processed at the expense of T1? (D) Is a lower T1 memorization after presentation of a spider T2 related to higher spider anxiety? Methods Participants Prior to the experimental sessions, interested students from several departments at Dresden University of Technology were asked to enlist their name and phone number. From these lists, 60 randomly chosen people were called and invited for testing. To ensure that none of the participants had an aversion for neutral or positive T2 stimuli, we asked if they had any allergies or general antipathy for flowers or mushrooms; no participants were excluded for this reason. All candidates had high school degrees and were students of Dresden University of Technology. On average, the 51 women and 9 men were 20.9 years of age (SD = 2.3), all were without history of psychiatric disorder and had normal or corrected-to-normal vision. All volunteers were informed of their rights as experimental participants and gave their consent to participate in the study. In return for their participation, they received either course credit or a payment of e5 per hour. Participants with pronounced spider anxiety were told about behavioral therapy as a treatment option, and were given contact information of the outpatient university clinic. Materials and apparatus The experiment was controlled by MATLAB software using the Psychophysics Toolbox extensions (Brainard, 1997; Pelli, 1997). Stimuli were presented on a gray background on 17” monitors with a resolution of 1024 x 768 pixels. Responses were recorded via button press. The displayed elements included 84 square (115x115 pixel) color images, made up of 40 neutral distractors, 32 neutral T1 (16 kitchen, 16 non-kitchen), 4 neutral T2 (mushrooms), 4 pleasant T2 (blossoms), and 4 unpleasant T2 items (spiders). Pictures were chosen after extensive pretesting 1 . For the T1 sample, only neutral pictures having valence ratings not 1
Twenty individuals who did not participate in the experiments reported here rated a sample of 200 pictures. The sample included several variations of diverse potential T2 images (spiders, snakes, blossoms, wheels,
VI. PAPER 5
133
significantly different from the neutral mean (5.0) on the rating scale were employed. These were further divided into 16 ”kitchen items” and 16 ”non kitchen items” based on agreement of at least 90% of the raters (most were classified with agreement of 95-100%). For the T2 sample, 4 mushroom images with neutral valence ratings, 4 blossom pictures with positive and 4 spider items with negative valence ratings were selected. As distractors, 40 images with neutral valence that did not match any of the T2 categories were chosen (for examples, see Figure VI.1A). Procedure Prior to the experimental session, participants were informed about the general experimental procedure and filled out the "Spider Anxiety Screening" form (SAS, Rinck, Bundschuh, Engler, Mueller, Wissmann, Ellwart, & Becker, 2002) and the German version of the "Fear of Spiders Questionnaire" (FSQ; Szymanski & O’Donohue, 1995; see Rinck et al., 2002). They were then given written instructions on the computer monitor instructing them to attend to the presented picture string and prepare for a memory test where they would make decisions about the two target items indicated by a bright-gray background. The importance of accuracy was emphasized. Additionally, participants viewed a schema of a sample trial including the response menus and an overview of the different picture types (e.g., kitchen items, blossoms) to become familiarized with the materials. The computer screen was placed approximately 70 cm away from the participant. Each experimental trial started with the presentation of a black fixation cross on a gray background. After 500 ms, the rapid serial presentation of 15 images centered on the screen at a rate of 80 ms per picture with an ISI of 0 ms started. Trial by trial, the position of T1 within the picture series was randomly determined, occurring in equal measure at the string positions 3 to 8. The position of T2 was determined randomly using fixed T1-T2 lags of 1, 2, 3, 4, 5, or 6. A lag of 1, for instance, indicates that T2 will be presented directly after T1, equal to an SOA of 80 ms. Both the content of T1 and T2 were randomized. Within T1 images, kitchen and non-kitchen items were each displayed 50% of the time. Likewise, T2 depicted neutral (mushroom), positive (blossom), or negative (spider) items equally often. Additionally, 13 distractor images were randomly chosen from the pool of 40 items and randomly inserted into the remaining positions of the image string. Compared to the distractor items, both target items were characterized by a brighter gray background (120 x 120 pixels). Two sample trials, showing both neutral and negative T2 images, are shown in Figure VI.1. After the picture string, a blank gray screen presented for 1000 ms to mushrooms, fruit), several kitchen and non-kitchen items, and many additional images of varying appearance and valence. Each item was judged on 9-point scales regarding valence (from 1 very pleasant to 9 very unpleasant) and recognizability (from 1 very good to 9 very bad). Additionally, each item was classified as ”definitely kitchen item” vs. ”definitely no kitchen item”. Only images with mean recognizability ratings of 3 or less were considered.
VI. PAPER 5
134
avoid memory masking by the onset of the response menus. The response menus for T2 (see Figure VI.1B) and T1 (see Figure VI.1C), were displayed one after another for at most 5000 ms each. Participants were first asked to indicate whether T2 had depicted a mushroom, a blossom, or a spider, and then to decide whether T1 had shown a kitchen or non-kitchen item by clicking on the corresponding button. In both response phases, an additional button could be selected to indicate that the observer did not know the correct response (”no idea”).
A
T1
lag 2
T2
… T1
… lag 4
B
T2 C
What was the second
MUSHROOM
BLOSSOM
SPIDER
NO IDEA
What was the first
KITCHEN ITEM
OTHER
NO IDEA
Figure VI.1: Schematic depiction of the trial procedure in Experiment 1. (A) Participants viewed fifteen images each presented for 80 ms. The task is to identify the two target items indicated by a brighter background. The upper row shows a neutral trial with a T1-T2-lag of 2. The lower row depicts a negative trial with a T1-T2lag of 4. (B) After the presentation of the image string, participants decide by clicking on the display whether the second target was a mushroom, a blossom or a spider. (C) Afterwards, identification of the first target as kitchen item or nonkitchen item is requested. Note: Actual stimuli were in color.
Written feedback was provided on screen after each of the two responses. Participants initiated the next trial with a key press, and could thereby take breaks whenever needed. After the experiment, participants were debriefed. A session took approximately 40 minutes.
VI. PAPER 5
135
Design The task followed a 3x6 factorial design with within-subjects factors ”T2” (neutral: mushroom, positive: blossom, negative: spider) and "lag" (1, 2, 3, 4, 5, or 6). For each trial, T2 and lag were pseudo-randomly chosen by the MATLAB program. Each of the 18 possible combinations of the two factors was presented 10 times to each participant. Thus, they completed 180 experimental trials, preceded by 6 practice trials. For each factorial combination, we determined the mean accuracy in correctly identifying T2 provided that the T1 response was accurate and the mean accuracy in correctly reporting T1 for correct T2 trials. Results Questionnaires
The 60 participants revealed a mean SAS score of 12.1 (SD = 6.0) and a mean FSQ score of 27.9 (SD = 25.6), which is in line with mean scores previously reported by Rinck et al. (2002) in normal samples. Experimental Task
Prior to statistical testing, practice trials were discarded from the data set. Following standard procedures of AB task analysis, we (A) calculated the T2 report accuracy for the different lag conditions in trials with correct T1 reports, (B) tested whether report accuracy for spider items correlated with the individuals’ spider anxiety, and (C) calculated T1 report accuracy dependent on T2 type. Below, effect sizes are reported as eta2 values for ANOVAs and Cohen’s d values (1988) for t-tests. (A) Accuracy in reporting T2 after a correct T1 response: Attentional Blink. In an initial analysis, mean accuracy for reporting T2 dependent on its valence and T1-T2 lag was calculated for trials with a correct T1 report. These values were subjected to a two-way ANOVA, including the factors ”T2” (neutral: mushroom, positive: blossom, negative: spider) and ”lag” (1-6). In addition, we calculated two-way ANOVAs including only two T2 pictures at a time to determine which picture types differed from each other. As each factorial combination of lag and T2 was presented only 10 times, some participants did not correctly report T1 in individual cells. In these cases, the calculation of valid T2 accuracies after correct T1 responses was not possible. Therefore, we refer herein only to the 48 participants with complete data across all factorial combinations 2 . The results are depicted in the left panel of Figure VI.2. 2
Analysis of the data for all participants without considering whether the T1 response was correct led to comparable results.
VI. PAPER 5
136
Participants performed better in detecting spider T2 pictures than positive or neutral T2 images, F (2, 94) = 90.24, p < .001, eta2 = .66, spider-positive: F (1, 47) = 45.68, p < .001, spider-neutral: F (1, 47) = 180.99, p < .001, and the accuracy for detecting positive T2 images was higher than for neutral T2 items, neutral-positive: F (1, 47) = 44.79, p < .001. Accuracy was also lower in specific lag conditions, F (5, 235) = 28.21, p < .001, eta2 = .38. This was true for all T2 types, lag spider: F (5, 235) = 3.88, p < .01, eta2 = .08, lag positive: F (5, 235) = 12.82, p < .001, eta2 = .21, lag neutral: F (5, 235) = 15.12, p < .001, eta2 = .24. The lag effect was similar for positive and neutral T2, positive-neutral: F (5, 235) = 0.51, p = .766, eta2 = .01, but different for spider T2, spider-positive: F (5, 235) = 3.53, p < .01, eta2 = .07, spider-neutral: F (5, 235) = 5.16, p < .001, eta2 = .10. Moreover, the significant interaction of lag and T2 type, F (10, 470) = 2.96, p = .001, eta2 = .06, suggests that the three valence conditions differed regarding onset, duration, and amplitude of the attentional blink. The left panel of Figure VI.2 demonstrates that in all T2 conditions, report accuracy was lowest at lag 2 and lag 3, producing the AB characteristic U-shaped curves. However, the U-shape was less prominent in the spider condition. To determine whether there were any valence-related differences regarding the onset and duration of the attentional blink, for each valence condition paired t-tests were computed for all possible pairs of the first four lag conditions. In all valence conditions, accuracy at lag 1 was significantly higher than at lag 2 [spider: t(47) = 2.08, p < .05, d = .39, positive: t(47) = 4.42, p < .001, d = .63, neutral: t(47) = 3.83, p < .001, d = .65] and lag 3 [spider: t(47) = 2.64, p < .05, d = .49, positive: t(47) = 4.34, p < .001, d = .60, neutral: t(47) = 3.15, p < .01, d = .47], but did not differ anymore from accuracy at lag 4 [spider: t(47) = 1.48, p = .146, d = .26, positive: t(47) = 1.81, p = .077, d = .28, neutral: t(47) = 0.29, p = .782, d = .07]. In all valence conditions, there was no significant difference between the T2 accuracy at lag 2 and lag 3 [all t(47) < 1.19, all p > .201]. This implies that the encoding of T1 led to lower encoding probability for T2 when T2 appeared 160 ms to 320 ms after the onset of T1, independent of the valence of T2. Regarding the onset and duration of the AB, there seemed to be no differences between the three picture types. The calculation of the quadratic contrasts for the first four lag conditions, separately for each T2 condition confirmed AB effects for all valence conditions, as there were strong quadratic contrasts in the neutral curve, F (1, 47) = 28.08, p < .001, eta2 = .37, and in the positive condition, F (1, 47) = 17.67, p < .001, eta2 = .27, and also – although weaker - in the spider curve, F (1, 47) = 6.32, p < .05, eta2 = .12.
VI. PAPER 5
137
T2
T1
positive
negative
neutral
1
1
0,9
0,9
0,8
0,8 accuracy
accuracy
neutral
0,7 0,6
positive
negative
0,7 0,6
0,5
0,5
0,4
0,4 0,3
0,3 1
2
3
4 lag
5
6
1
2
3
4
5
6
lag
Figure VI.2: Left panel: Means (and standard error bars) in correctly reporting T2 dependent on its valence and lag in Experiment 1, for trials with a correct T1 response only. Right panel: Means (and standard error bars) in correctly reporting T1 dependent on T2 valence and the lag in Experiment 1, for trials with a correct T2 response only.
To test statistically whether the three T2 conditions yielded differences in AB amplitude, we first calculated the standard deviation of the six mean accuracies yielded at each lag position, separately for each curve and each participant, as a parameter of the amplitude of AB effects. The standard deviations (SDneutral = 0.24, SDpositive = 0.22, SDspider = 0.12) were then subjected to a one-way ”T2” ANOVA. The standard deviations of the six lag means differed significantly between the three picture types, F (2, 94) = 21.36, p = .000, eta2 = .31, implying differences in the strength of the AB effect between the three valence conditions. Additional paired t-tests confirmed a similar AB amplitude in the neutral and positive condition, t(47) = 1.41, p = .166, d = .26, but a weaker AB in the spider condition, neutral-spider: t(47) = −4.61, p = .000, d = 1.23, positive-spider: t(47) = −5.88, p = .000, d = .93. (B) Correlations of the spider AB effect and individual spider anxiety. To investigate whether there were any correlations between the participants’ spider anxiety and their spider-T2 performance in the Attentional Blink paradigm, we correlated the mean of the six means of the spider curve vs. the mean of the first four means of the spider curve with the individual’s SAS and FSQ scores in Pearson’s correlation analyses. These calculations revealed no significant correlations, with all r < .106 and all p > .474. In addition, we correlated the standard deviation of the six lag points of the spider curve vs. the standard deviation of the first four means of the spider curve with the self-reported spider
VI. PAPER 5
138
anxiety. The participants’ AB effect and their self-reported spider anxiety did not correlate, all r > −.105, all p > .386. (C) Accuracy in reporting T1 depending on T2 type: Distraction. To test whether the content of T2 items influenced the report accuracy of T1, we conducted a two-way ANOVA with the independent measures ”lag” and ”T2” and the dependent measure ”T1 accuracy in correct T2 trials”. Again, data from three participants did not contain all necessary values. Therefore, the analysis was based on the 45 participants with full set of results. Means are depicted in the right panel of Figure VI.2. Calculations revealed that the content of the T2 image did not affect the report probability of T1, T2: F (2, 88) = 1.33, p = .269, eta2 = .03, T2 x lag: F (10, 440) = 1.11, p = .354, eta2 = .03, but that independent of T2 type, T1 was missed more often with short lags, lag: F (5, 220) = 7.65, p < .001, eta2 = .15. This was confirmed by an additional ANOVA excluding lag-1 data, which no longer showed significant lag effects, F (4, 176) = 2.24, p = .067, eta2 = .05. (D) Correlations of T1 distraction and individual spider anxiety. To find out whether memory accuracy for neutral T1 items before a spider T2 was related to spider anxiety, we calculated (a) the mean of the T1 report accuracies at the six lag conditions and (b) the mean at lag conditions 1 and 2, which proved to be most prone to T2 onset effects. These values were, together with individual SAS and FSQ scores, subjected to Pearson’s correlation analyses. Calculations revealed no correlations of spider anxiety with either the T1 mean depending on all six lag positions, SAS: r = −.080, p = .601, FSQ: r = .038, p = .803, or with the T1 mean depending on only the first two lag positions, SAS: r = .055, p = .718, FSQ: r = .127, p = .406. Discussion In Experiment 1, we investigated whether a spider-T2 is associated with a different AB pattern than a positive or a neutral T2, whether this difference is related to the individuals’ spider anxiety, and whether T1 report accuracy is lower when it is followed by a spider. We found significant lag effects in all T2 conditions, causing U-shaped courses in each. For all T2 types, report accuracy was lowest between 160 and 320 ms SOA, which is in line with the literature investigating AB with simple letters (e.g., Chun & Potters, 1995) or words (e.g., Anderson, 2005). Thus, there were no differences in the onset and duration of the AB in the three picture conditions. However, the magnitude of the AB was significantly lower in the spider condition, while the AB amplitudes in the positive and neutral T2 condition did not differ from each other. This effect of a reduced AB in spider curves did not correlate with individual spider anxiety. Spiders were generally more likely to be successfully reported than neutral or positive T2 pictures, but accuracy to spider T2 did not correlate with individual
VI. PAPER 5
139
spider anxiety. Additionally, the valence of T2 did not affect report accuracy for T1, nor did T1 report accuracy in spider trials correlate with spider anxiety. T1 report accuracy was in general reduced with small T1-T2 lags, which is in line with the results reported by Anderson (2005). Summarizing, Experiment 1 suggests that the evolutionary meaning or general negativity of items affects the AB phenomenon. In contrast, the individual threat value of a stimulus did not seem to increase its probability of being promoted to a higher processing level for consolidation. The data indicate no processing preference for spiders at the cost of other items undergoing higher processing. A deeper discussion of the results follows in the General Discussion.
Experiment 2: The Attentional Blink for Spiders and Snakes in Spider Fearfuls vs. Non-Anxious Controls Without Snake Anxiety Introduction In Experiment 1, we found no correlations between the AB reduction by spiders and individual spider anxiety, nor did we find correlations between T1 accuracy in spider trials with spider fear. However, the SAS and FSQ scores of the participants of Experiment 1 indicate that the sample included predominantly individuals with low or medium levels of spider fear and barely any highly fearful participants. Thus, the results can hardly be generalized to spider phobics. Therefore, in Experiment 2, only participants with either very low or very high, clinically relevant spider anxiety were tested to see if report accuracy for T2 spiders and T1 items in spider trials would differ between the two groups. As earlier studies on spatial VWM biases in spider anxiety suggested disorder-specific enhancement for spider images, we sought to determine whether this difference would also occur in a temporal VWM paradigm. We further tested whether any group differences in consolidation of T2 spiders would not only be disorder-specific, but also materials-specific. Therefore, the negative T2 item in this experiment included both a disorder-relevant spider, feared by only one of the groups, and a generally negative snake, feared by none of the participants. Methods Participants 31 spider fearfuls (SFs) and 36 non-anxious controls (NACs), both without snake anxiety, participated in the experiment 3 . Potential participants were preselected in classes at several departments at Dresden University of Technology with the German "Spider Anxiety 3
Originally, 34 SF were tested. The data of one of these participants had to be removed from the data set due to a heightened snake anxiety score revealed in the SCAF. In two other cases, technical problems led to incomplete data recording.
VI. PAPER 5
140
Screening" (SAS, Rinck et al. 2002) and the corresponding German ”Snake Anxiety Screening” (SCANS, Reinecke, Rinck, & Becker, submitted-b). Both 4-item instruments assess the DSM criteria for specific phobia, namely ”anxiety”, ”physiological activation”, ”avoidance”, and ”impairment”. As it is easy to avoid spiders and snakes in Northern Europe and, consequently, impairments are rarely reported by anxious persons, no importance was attached to the ”impairment” item in the prescreening analyses. Students with scores lower than 5 or higher than 14 on the three remaining items of the spider screening (SAS) and scores lower than 5 on the first three items of the snake screening (SCANS) were invited for further interviews and testing. Before the experiment, participants were screened for alcohol or drug abuse, extreme stress, depression and psychosis. Potential participants were questioned regarding everyday stress, use of pharmaceuticals and drugs and the extent of their alcohol use. To exclude depressed students, the German FDD-DSM-IV inventory (Kuehner, 1997), which is a translation of the ”Questionnaire for Depression Diagnosis” (Zimmermann, Coryell, Wilson, & Corenthal, 1986) was conducted. Additionally, the psychosis section of the F-DIPS (Margraf, Schneider, Soeder, Neumer, & Becker, 1996), the German version of the ADIS (DiNardo, Brown, & Barlow, 1994), was applied. None of the volunteers had to be excluded due to suspicion of drug abuse, depression or psychotic tendencies. Afterwards, spider and snake anxiety was carefully measured: they completed German versions of the "Fear of Spiders Questionnaire" (FSQ; Szymanski & O’Donohue, 1995; see Rinck et al., 2002) and the ”Snake Anxiety Questionnaire (SNAQ; Klorman, Hastings, Weerts, Melamed, & Lang, 1974; see Reinecke et al., submitted-b). Trained interviewers assessed volunteers on DSM-IV criteria for specific phobia of spiders and snakes. For that purpose, the International Diagnosis Checklist for DSM-IV (ICDL; Hiller, Zaudig, & Mombour, 1997) was used, enlarged by the eight-stage assessment scales of the F-DIPS (Margraf et al, 1996). Only candidates fulfilling none of the DSM-IV criteria for snake phobia participated in the experimental task. Additionally, they had to meet criteria for one of the spider anxiety groups: for the non-anxious control group (NAC), they were not allowed to fulfill any of the DSM-IV criteria for specific spider phobia as assessed by the ICDL, and had to have an FSQ score below 11. Participants in the spider fearful group (SF) had to reach an F-DIPS "fear", ”physical activation” and ”avoidance” score of at least 4 each and a minimum FSQ score of 30. Eight of the 31 SFs fulfilled all DSM-IV criteria for a specific phobia of spiders, while the rest met all criteria except criterion E (significant impairment in everyday life). The SF sample and the NAC group were matched for age, gender, and educational level. All candidates had high school degrees and were students of Dresden University of Technology. On average, the 31 female and 5 male members of the NAC group were 22.5 years
VI. PAPER 5
141
Table VI.1: Mean questionnaire scores (means, standard deviations, t-tests) in the two experimental groups, calculated for all participants in Experiment 2.
Age
non-anxious controls spider fearfuls (N=36) (N=31) 22.5 21.4 (3.5) (2.5)
significance of t-test (df = 67) n.s.
SAS
1.6 (1.6)
17.9 (3.2)
.001
FSQ
1.8 (2.6)
63.5 (17.3)
.001
SCANS
1.8 (1.6)
2.4 (2.0)
n.s.
SCAF
3.4 (2.0)
3.9 (2.6)
n.s.
FDD
2.9 (2.9)
5.1 (3.9)
.05
STAI-T
36.1 (7.0)
38.7 (6.6)
n.s.
STAI-S pre exp.
32.8 (4.9)
38.8 (8.9)
.001
STAI-S post exp.
32.4 (6.5)
37.3 (7.1)
.01
of age (SD = 3.5), while the 27 female and 4 male SF participants had a mean age of 21.4 years (SD = 2.5). All volunteers had normal or corrected-to-normal vision. All were informed of their rights as experimental participants and gave their consent. The participation was honored with course credit or payment of e5 per hour. Materials, apparatus, and procedure. The experiment was nearly identical to Experiment 1. The only extension was a second negative T2 category, the snake images. We selected 4 pictures of dark-colored snakes from the picture pool rated as described above. Only images with a recognizability rating of at most 3 and a negative valence rating were included. The response menus were changed slightly with removal of the ”no idea” buttons and addition of a ”snake” button in the T2 response menu. However, participants were explicitly encouraged to avoid guessing.
VI. PAPER 5
142
Design Statistical analyzes are based on a 2x4x6 factorial design with the between subjects factor ”group” and the within-subjects factors ”T2” (neutral: mushroom, positive: blossom, negative: snake, disorder-specific negative: spider) and "lag" (1, 2, 3, 4, 5, or 6). For each trial, T2, and lag were pseudo-randomly chosen by the MATLAB experimental program. Each of the 24 possible combinations of the two within-subjects factors was presented 10 times to each participant. Thus, they completed a total of 240 experimental trials, preceded by 6 practice trials. For each factorial combination, we determined the mean accuracy in correctly identifying T2 provided that the T1 response was accurate. Results Questionnaires
The mean scores, standard deviations, and significance of t-tests for age and questionnaire scores are shown in Table VI.1. Snake anxiety scores on the SCAF were comparably low in both groups. Trait anxiety scores on the STAI-T fell within the normal range and did not differ between the groups. However, the groups slightly differed regarding depression scores on the FDD and pre-experimental and post-experimental state anxiety with higher scores in the SF group. Mostly, these values fell within normal range and therefore should not confound interpretation of the results reported below. We observed heightened FDD scores in three of the SF participants. However, a supplementary analysis regarding the experimental results showed that the FDD scores did not correlate with the effects reported later, but only the FSQ score. Experimental Task
We determined (A) whether there were any group differences in T2 report accuracy, given accurate T1 report for the different lag conditions, and (B) whether there were any group differences for T1 accuracy when T2 depicted a spider. (A) Accuracy in reporting T2 after a correct T1 response: Attentional Blink. For trials with a correct T1 response, we calculated mean accuracy in reporting T2-targets dependent on their valence and the lag condition for each participant. These values were subjected to a three-way repeated measures 2x4x6-ANOVA for the within-subjects factors ”T2” (neutral: mushroom, positive: blossom, negative: snake, disorder-specific negative: spider) and ”lag” (1-6), and the between-subjects-factor ”group”. The results are depicted in Figure VI.3. Again, there were cases in which a person was completely unable to reproduce T1 correctly for a specific factorial combination, making it impossible to calculate a valid accuracy value for T2. Therefore, this analysis is based only on participants that did not
VI. PAPER 5
143
produce any empty cells 4 . The age and questionnaire differences between the remaining 26 SF and 28 NAC mirror the results presented in Table VI.1. As in the previous experiment, accuracy in reporting T2 depended on its valence, F (3, 156) = 83.45, p < .001, eta2 = .62, and on the lag condition, F (5, 260) = 18.74, p < .001, eta2 = .27, and there were differences between the four T2 picture types with regard to the AB, F (15, 780) = 2.49, p = .001, eta2 = .05. In contrast, the complete ANOVA revealed no differences between the groups, group: F (1, 52) = 0.98, p = .327, eta2 = .02, group x lag: F (5, 260) = 0.76, p = .583, eta2 = .01, group x T2: F (3, 156) = 0.25, p = .860, eta2 = .01, group x T2 x lag: F (15, 780) = 1.02, p = .435, eta2 = .02. However, calculating the same ANOVA including only the T2 conditions neutral, positive, and snake, suggested similar lag patterns in these three conditions and a differing lag pattern only in the spider condition, lag x T2: F (10, 520) = 1.15, p = .835, eta2 = .01, lag: F (5, 260) = 18.81, p < .001, eta2 = .271, T2: F (2, 104) = 26.85, p < .001, eta2 = .34.
NON-ANXIOUS CONTROLS positive
spider
snake
1
1
0,9
0,9
0,8
0,8
accuracy
accuracy
neutral
SPIDER FEARFULS neutral
0,7 0,6
spider
snake
0,7 0,6
0,5
0,5
0,4
0,4
0,3
positive
0,3 1
2
3
4
lag
5
6
1
2
3
4
5
6
lag
Figure VI.3: Means (and standard error bars) in correctly reporting T2 after a correct T1 response in Experiment 2. Accuracy values for T2 are depicted dependent on its valence and lag, separated for the two groups.
Additional three-way ANOVAs including only two T2 types at one time revealed better accuracy for positive T2 than for snakes, Fpositive−snake (1, 52) = 4.65, p < .05, eta2 = .08, better report accuracy for snakes compared to neutral images, Fneutral−snake (1, 52) = 24.11, p < .001, eta2 = .32, and the highest accuracy for spider images, Fpositive−spider (1, 52) = 64.29, p < .001, eta2 = .55, without any group differences, 4
The analysis of the data of all participants independent of a correct T1 response led to comparable effects.
VI. PAPER 5
144
all F < 0.52, all p > .476. Additional ”lag” x ”group” analyses, separately for each T2 picture type, revealed marginally better spider detection in the SF group compared to the NAC group, F (1, 52) = 3.23, p = .078, eta2 = .06, but no group differences regarding the neutral condition, F (1, 52) = 0.13, p = .724, eta2 = .00, nor the positive condition, F (1, 52) = 0.11, p = .737, eta2 = .00, nor the snake condition, F (1, 52) = 1.03, p = .316, eta2 = .02. Without group differences, accuracy was similar at all lag positions of the spider curve, group x lag: all F (5, 260) < 1.05, all p > .390, lag: Fspider (5, 260) = 1.33, p = .252, eta2 = .03, but differed depending on the lag in the three remaining valence conditions, Fneutral (5, 260) = 9.66, p < .001, eta2 = .16, Fpositive (5, 260) = 7.32, p < .001, eta2 = .12, Fsnake (5, 260) = 6.56, p < .001, eta2 = .11. In a second analysis, the standard deviations of the 6 lag means (used as a measure of the AB effect) of each T2 curve and each participant were subjected to a two-way ANOVA with the factors ”T2” and ”group”. Results (SF: SDneutral = 0.24, SDpositive = 0.20, SDspider = 0.06, SDsnake = 0.23; NAC: SDneutral = 0.22, SDpositive = 0.20, SDspider = 0.10, SDsnake = 0.19) indicated that in both groups, AB effects were significantly lowest in the spider condition, T2: F (3, 156) = 47.66, p < .001, eta2 = .48, SF: all tspider−other (25) > 7.91, p < .001, NAC: all tspider−other (27) > 5.21, p < .001. In addition, the AB effect in spider curves was slightly smaller in the SF group than the NAC group, group x T2: F (3, 156) = 3.23, p < .05, eta2 = .06, yielding a flatter spider curve in SFs than in NACs. Considering only the first four lag conditions of each curve for the calculation of the standard deviations lead to similar results. (B) Accuracy in reporting T1 depending on T2 type: Distraction. This calculation is based on the 24 SF and 24 NAC who did not produce any empty cells. In this analysis, we tested whether the accuracy in reporting T1 depended on the valence of T2 and group. Therefore, we computed a three-way ANOVA with the factors ”lag”, ”T2”, and ”group”. Results are depicted in Figure VI.4. A lag effect was observed, which was independent of group or T2 type: T1 accuracy decreased with decreasing lag, lag: F (5, 230) = 12.69, p > .001, eta2 = .22, lag x group: F (5, 230) = 0.75, p = .587, eta2 = .02, lag x T2: F (15, 690) = 0.98, p = .480, eta2 = .022, lag x group x T2: F (15, 690) = 1.02, p = .436, eta2 = .02. In both groups, T1 performance was higher for spider T2, T2: F (3, 138) = 3.06, p < .05, eta2 = .06, T2 x group: F (3, 138) = 1.22, p = .306, eta2 = .03, and similar for neutral, positive, and snake T2, F (2, 92) = 0.21, p = .809, eta2 = .01. In general, NAC T1 performance was similar to that of SF, group: F (1, 46) = 3.51, p = .067, eta2 = .07.
VI. PAPER 5
145
NON-ANXIOUS CONTROLS positive
spider
snake
neutral
1
1
0,9
0,9
0,8
0,8
accuracy
accuracy
neutral
SPIDER FEARFULS
0,7 0,6
spider
snake
0,7 0,6
0,5
0,5
0,4
0,4
0,3
positive
0,3 1
2
3
4
lag
5
6
1
2
3
4
5
6
lag
Figure VI.4: Means (and standard error bars) in correctly reporting T1 dependent on T2 valence and lag in Experiment 2 for trials with a correct T2 response only, separately for the two groups.
Discussion With Experiment 2, we studied whether two extreme groups with low vs. high spider anxiety would exhibit any differences in the AB effects yielded with threatening T2, and if so, whether this group effect would occur with disorder-specific threatening materials only, or also with other negative stimuli such as snakes. Both groups reported spiders significantly better than blossoms, blossoms significantly better than snakes, and snakes significantly better than mushrooms. Regarding the latter three T2 conditions, we observed no differences in the lag patterns, whereas in both groups, there seemed to be no lag effects at all for spider T2, which is in contrast to Experiment 1. While the data indicated no group differences in report accuracy regarding neutral, positive, and especially snake items, we observed a slight group difference in the identification of a spider T2, with advantages in the spider fearful group. Analyses of the ”flatness” of the T2 curves revealed that both groups, but especially the SF group, showed lowest lag dependence in the spider curve. In addition, both groups unexpectedly revealed higher T1 accuracy in spider T2 trials. To summarize, the data hint at the relevance of the individual threat value of an item for the report probability during the AB temporal frame, but do not indicate relevance of the individual threat value of an item for the report probability of the target item seen before.
VI. PAPER 5
146
General Discussion In two studies, we investigated the Attentional Blink in picture strings with T2 materials of differing valence. In Experiment 1, T2 depicted either a neutral mushroom image, a positive blossom picture, or a negative spider image. While on average, spiders were reported with a higher accuracy than blossoms, and blossoms were more often correctly reported than mushrooms, the AB typical u-shaped curve occured in all valence conditions, implying high accuracy at lag 1, but significantly reduced report accuracy at lag 2 and 3. That is, an AB appeared at about 160 to 320 ms after the onset of the first attended target without any differences between the three valence types regarding onset and duration. While the magnitude of this AB was similar for neutral and positive T2, it was reduced for spider T2. We observed no correlation between the flatness of the spider curve, that is, the reduction of the spider AB effect, and an individual’s spider anxiety. The T2 valence had no influence on the report probability of T1, and the T1 accuracy in spider T2 trials was not correlated with individual spider anxiety. Rather, T1 accuracy was lower at lag 1 and lag 2 in all T2 conditions. In Experiment 2, we tested spider fearfuls and non-anxious controls, both without snake anxiety, for two negative T2 conditions, a disorder-related spider image and an unrelated snake image. In both groups, spiders were better reported than positive items, these were slightly better identified than snakes, and neutral images had the lowest report probability. The mean accuracy in reporting spider T2 was marginally higher in SF. There were no differences in report accuracy for snake T2 between groups. Moreover, the data revealed similar lag patterns in the positive, the neutral, and the snake condition in both groups, and no significant lag effects at all in the spider condition, again in both groups. Nevertheless, spider T2 curves were significantly flatter in the SF group compared to the NAC group as indicated by the standard deviation of the six lag conditions. In addition, both groups showed higher T1 accuracy with spider-T2 compared to other T2. What do these data tell us about the relevance of emotionality of an item - especially its inividual threat value - for the magnitude of the AB, and about the existence of temporal working memory biases in specific anxiety? First, we can conclude that stimuli with a positive or negative valence are in general reported more often than neutral stimuli. That is, participants viewing a very rapid serial presentation of images preferably select emotional stimuli for higher-level processing. This is in line with processing theories postulating that emotional information is quickly and automatically filtered (for a review, see, for instance, Williams et al., 1997). However, Experiment 1 demonstrated that both neutral and emotional stimuli are prone to AB effects in a similar manner: independently of its emotionality, a target is reported with lower probability when it occurs within the AB temporal frame of 160 to 320 ms after the onset of another, attended target. Regarding the
VI. PAPER 5
147
two-stage model of Chun and Potter (1995), this observation implies that higher processing of an emotional T2 at least partially uses the same resources as the higher processing of neutral items: while T1 is still in the consolidation phase, T2 has to be held in stage 1, which is more prone to forgetting, producing an AB phenomenon. However, in both experiments, the AB magnitude was lower for spiders at all anxiety levels. This might on the one hand imply that, when the first target was still under higher processing, the stage 1 representation of a T2-spider was either more durable than the stage 1 representation of a mushroom- or a blossom-T2 and, thus, was more likely to survive the processing delay. On the other hand, it might suggest that in the consolidation of spider images, less resources are required or some additional, presumably automatic processing resources are activated. Further experiments are required to test the validity of these competing explanations. The advantage to spider-T2 at all anxiety levels is in line with the preparedness theory (Seligman, 1971), assuming that humans are predisposed to be alert to situations or animals that endangered survival during our evolutionary history. Possibly, some kind of internal representation of phylogenetically ”dangerous” objects and situations accelerates the creation of a spider-T2 representation. This will be an interesting avenue for further research. Earlier research already suggests that emotional materials are preferentially selected from a stream of information for encoding in working memory (Anderson, 2005; Keil & Ihssen, 2004), and that the encoding of these items takes less time (Arend & Botella, 2002). Getting back to our earlier questions – how preferential is this preferential processing of threatening stimuli in specific anxiety? Is the reduction of the AB magnitude related to individual anxiety regarding the emotional stimuli? Does this possible advantage come at the expense of items currently undergoing processing, resulting in premature ejection from being processed? And if so, is it related to the individual threat value of an item? Our data suggest that for samples with a normal distribution of spider anxiety as in Experiment 1, the AB magnitude is not related to spider anxiety, and advantages for negative T2 items are not related to T1 costs. However, it seems that for anxiety states with clinical relevance, AB patterns are different, implying the existence of disorder-specific biases in anxiety disorders. First, in highly spider fearfuls, the AB magnitude is additionally reduced compared to non-anxious controls. This enhanced encoding of spider-T2 in spider fearfuls might be due to their experience with spider materials. According to Cave and Betty (2006), phobics are faster at identifying feared stimuli due to a better representation of phobic materials as a result of their regular preoccupation with those items. Possibly, such an additional internal representation of the ”feared” spider is involved in the enhanced identification of spider T2 within the rapid stimuli stream. In contrast, both high and low spider anxiety participants exhibited higher T1 performance with spider T2. Together with the data of Experiment 1, this indicates that at all anxiety levels, the appearance of a spider
VI. PAPER 5
148
T2 does not lead to the interruption of ongoing processing of a T1 item. The processing of an item is not cancelled in favor of a spider item, and the general rule ”first in, first out” seems to be valid for both threatening and neutral items. At extremely high and low levels of anxiety, the onset of a spider T2 seems to evoke additional resources for completion of T1 processing. This implies that at particularly high and low anxiety levels, negative T2 images may require less processing resources for their own encoding. However, some inconsistencies in spider AB results between Experiments 1 and 2 point to methodological differences and therefore, interpretational limitations. Experiment 1 yielded significant lag effects for spider T2, while Experiment 2 yielded no lag effects for spider T2 at all. Moreover, missing T1 and T2 enhancement effects with snake T2 compared to spider T2 in Experiment 2 also requires explanation. Several explanations may seem initially plausible for the lack of AB effects on spider T2 in Experiment 2, but do not hold upon closer examination: (a) One might argue that the missing ”no idea” button in Experiment 2 may have encouraged guessing in trials where observers did not identify a T2, and that they chose the spider button, as extensive prescreening for spider anxiety might have primed insights into study interests. However, as prescreening for snake anxiety was comparably extensive, we should have observed similar AB effects in the snake curve as well; (b) Participants may have responded with the spider button when they merely noticed ”something dark”. But as only one of the four spiders was definitely darker than the snakes, the difference between the snake and the spider curve should not be that prominent. From earlier studies investigating the AB with emotional words as T2 (e.g., Anderson, 2005, Keil & Ihssen, 2004) we know that it is not merely stimulus valence that reduces AB effects, but primarily the arousal value of the target which is responsible. A closer inspection of our own stimuli reveals that the most important difference between spiders and snakes (as well as all other objects) is that spiders were depicted close to their natural size, while the others were reduced in size. This may have produced less arousal for snakes, as compared to spiders. Unfortunately, we did not collect arousal ratings for our stimulus materials and therefore cannot answer this question. However, these effects, relevant or not, provide no explanation for why we observed spider-T2 lag effects in Experiment 1, but not in Experiment 2. One could argue that only individuals with medium, non-extreme anxiety scores, show AB effects to the threat stimulus. Another limitation of the current results exists in low average report performance for T1 items. While earlier studies report T1 accuracies of 80 to 90% (e.g., Fox et al., 2005; Keil & Ihssen, 2004), we observed T1 accuracies of only 50 to 60%. As mentioned above, we found similar T2 results regardless of whether or not incorrect T1 responses were included in the analysis. Nevertheless, the categorization task for T1 chosen in this study may have been overly complex for performance at such short presentation times. Further research
VI. PAPER 5
149
should test this assumption by employing a less demanding T1 task. Despite these limitations, the current study adds to the growing literature on working memory biases in specific anxiety. Cognitive biases are relevant maintaining factors in the pathogenesis of anxiety disorders, and it seems that disorder-relevant threat is not only preferentially processed at the level of attention, but also at the level of working memory. There is evidence that spider fearfuls reveal spatial VWM biases for threatening materials (Reinecke et al., 2006; submitted-a), and evidence suggesting that this bias is based on automatic processing of spiders (Reinecke et al., submitted-c). In addition, the present study suggests that fear of spiders might also be related to temporal working memory biases, implying disorderspecific enhanced working memory encoding of spider T2 in an AB task. Interestingly, the enhanced encoding does not seem to occur at the expense of T1 processing.
Paper 6: Two Short Screenings Measuring Fear of Snakes: Reliability and Validity in Contrast With the SNAQ
Abstract In both, the therapeutic and the scientific sector, the need for economic screening instruments quickly assessing specific mental diagnoses is high. Regrettably, reviewed German short-screening instruments measuring snake anxiety are not available. Therefore, we determined the reliability and validity of a from English translated short self-judgment instrument addressing snake anxiety (Schlangenangstaspekte-Fragebogen SANA: Aspects of Snake Anxiety Questionnaire) and a newly developed short screening instrument (Schlangenangstscreening, SCANS). Both were compared to the substantially more extensive Schlangenangstfragebogen SCAF (Snake Anxiety Questionnaire, SNAQ). For all questionnaires, we found very good internal consistency, good reliability, and good to very good construct validity and criterion validity. Therefore, the newly investigated screening instruments SANA and SCANS are suitable to replace the SNAQ with similar quality but higher temporal economy.
Einleitung Spezifische Phobien stellen neben den Depressionen die häufigsten psychischen Störungen dar (ESEMed Investigators, 2000; Magee et al., 1996). Sie sind gekennzeichnet durch eine unbegründet starke Angst vor einem an sich ungefährlichen Objekt bzw. einer spezifischen Situation und assoziiert mit einer Vermeidung des Angstauslösers und Beeinträchtigungen in der Lebensführung (DSM IV, American Psychiatric Association, 1994). Epidemiologischen Studien zufolge erfüllen 8% (ESEMed Investigators, 2000) bis 20% (Fredrikson, Annas, Fischer & Wik, 1996) der erwachsenen Allgemeinbevölkerung irgendwann im Laufe ihres Lebens die Kriterien für eine Spezifische Phobie. Die Angst vor Tieren nimmt dabei neben der Höhenangst mit 5% (Becker, Türke, Neumer, Soeder, & Margraf, 2000) bis 12% (Fredrikson et al., 1996) Lebenszeitprävalenz den größten Anteil innerhalb der Spezifischen Phobien ein, wobei diese am häufigsten auf Schlangen gerichtet ist (Agras, Sylvester, &
150
VII. PAPER 6
151
Oliveau, 1969; Fredrikson et al., 1996: 5.5%). Die Störung beginnt meist früh (Craske et al., 1996) und ist mit deutlichen psychosozialen Beeinträchtigungen korreliert (Essau, 1999). Darüber hinaus werden Spezifische Phobien zunehmend als Risikofaktor für die Entstehung weiterer psychischer Störungen wie z.B. Depressionen (Essau, 2003; Kessler, Nelson, McGonagle, Liu, Swartz, & Blazer, 1996), Alkoholismus (Kessler, Crum, Warner, Nelson, Schulenberg, & Anthony, 1997) und Soziale Phobie (Lewinsohn, Zinbarg, Seeley, Lewinsohn, & Sack, 1997) diskutiert. Da es in nordeuropäischen Regionen relativ einfach ist, angstauslösende Tiere - insbesondere Schlangen - zu vermeiden, bleiben Beeinträchtigungen durch Tierängste meist gering, sodass das Belastungskriterium für eine Spezifische Phobie nicht erfüllt ist. In diesem Falle spricht man von einer Spezifischen Angst. Da die Betroffenen meist eine ähnlich hohe Angst erleben wie Phobiker, sollte diese Personengruppe bei der Betrachtung Spezifischer Phobien nicht aus den Augen verloren werden. Immerhin erfüllt ein nicht unerheblicher Anteil von 11% bis 28% der Erwachsenen (Becker et al., 2002; Curtis, 1998; Essau, Conradt, & Petermann, 2000) mindestens die Kriterien für eine Spezifische Angst vor Tieren, die sich von der Spezifischen Phobie lediglich im Ausmaß der Beeinträchtigung unterscheidet. Allein Angst und Phobien vor Tieren betreffen also einen beträchtlichen Anteil der Erwachsenen. Dementsprechend ist es umso erstaunlicher, dass im deutschen Sprachraum keinerlei testtheoretisch überprüfte Instrumente vorliegen, die ein schnelles Screening der Schlangenangst - sei es im wissenschaftlichen oder therapeutischen Setting - mittels Selbstauskunft ermöglichen könnten. Im therapeutischen Kontext stehen dem Kliniker zwar Exploration und Eingangsfragebögen zur Verfügung, jedoch ist es hierbei nicht immer möglich, jeden potentiellen Problembereich explizit und umfassend abzufragen. So leben viele Betroffene einerseits oft schon sehr lange mit ihrer Angst (Marks, 1987), sodass sie nicht selten als "normal", zur Person gehörig angesehen und auf allgemeines Nachfragen gar nicht als Problembereich angeboten wird. Unserer klinischen und wissenschaftlichen Erfahrung zufolge fehlen vielen Betroffenen andererseits aber auch - trotz oder gerade wegen der in den letzten Jahren verstärkten medialen Präsenz atemberaubender "Schocktherapien" - oft valide Informationen zu realistischen Therapiemöglichkeiten oder der letzte Anstoß oder Mut, die Behandlung in Angriff zu nehmen. Eigene Praxisbeispiele wie das einer 70-Jährigen mit “lebenslanger“ Spinnenphobie belegen hingegen, dass direkte Behandlungsangebote (in unserem Fall über Zeitungsartikel) sehr dankbar und erleichtert aufgenommen und motiviert angegangen werden. Die Integration sehr kurzer Phobie-Screenings in eine Fragebogenbatterie zur Eingangsdiagnostik könnte dem Behandler hier sehr schnell Überblick verschaffen und ihn in die Lage versetzen, über Therapiemöglichkeiten zu informieren. Andererseits besteht natürlich auch im Bereich der
VII. PAPER 6
152
Grundlagen- und Anwendungsforschung die Notwendigkeit möglichst zeitökonomischer Verfahren bei gleichzeitig möglichst hochwertiger Qualität. So hat z.B. die Erforschung störungsspezifischer hormoneller, genetischer, kognitiver oder hirnphysiologischer Korrelate psychischer Störungen, z.B. Spezifischer Phobien, in den letzten Jahren auch in Deutschland einen Aufschwung erlebt (z.B. Gaab et al., 2005; Globisch, Hamm, Esteves, & Öhman, 1999). Auch in derartigen Untersuchungen ist es wünschenswert, dass Indexprobanden möglichst ohne größeren Aufwand selegiert werden können. Beide Schwerpunkte, das klinische als auch das wissenschaftliche Setting, erfordern also prägnante, reliable Instrumente, die im deutschen Sprachraum bedauerlicherweise vielfach noch nicht zur Verfügung stehen. Für die Erfassung der Schlangenangst beispielsweise existiert zwar eine Übersetzung des ’Snake Questionnaire’ (SNAQ) von Klorman, Hastings, Weerts, Melamed, & Lang (1974). Jedoch ist dieses Instrument mit 30 Items sehr lang, und eine frei zirkulierende Übersetzung der englischen Originalversion war bis vor kurzem noch nicht testtheoretisch überprüft 5 . Der SNAQ wurde zur Erfassung der verbal-kognitiven Komponente der Schlangenangst entwickelt. Alle Items sind in Aussageform formuliert, z.B. ”I am terrified by the thought of touching a harmless snake.” (Item 7) und vom Probanden als ”zutreffend” oder ”nicht zutreffend” einzuschätzen. Sowohl die Autoren als auch Fredrikson (1983) berichten hohe interne Konsistenzen zwischen r = 0.78 und 0.90. Darüber hinaus schätzt Fredrikson (1983) die Ein-Jahres-Retest-Reliabilität mit rtt = 0.64 als gut ein. Die Validität des Instruments konnte größtenteils ebenfalls als zufriedenstellend eingestuft werden. Fredrikson wies nach, dass der SNAQ gut zwischen Probanden mit Schlangenphobie und nichtängstlichen Personen trennt und darüber hinaus hoch mit Aversionsratings während der Betrachtung von Schlangenbildern korreliert (Fredrikson, 1981). Öst (1978) bestätigte in einer weiteren Studie die Sensitivität des Fragebogens für Therapieeffekte. In einer Untersuchung zur Bestimmung der Kriteriumsvalidität des Fragebogens mittels Verhaltenstest, der das Berühren einer lebenden Schlange implizierte, konnten Schroder & Craine (1971) zwar signifikante, aber insgesamt recht geringe Interkorrelation von SNAQ und Verhaltenstest von r = 0.41 finden. Auch Klieger (1987) konnte insgesamt nur schwache Korrelationen ermitteln. Ihm zufolge ließe sich für laut SNAQ nichtängstliche Probanden valide eine Annäherung an die Schlange voraussagen. Viele Versuchsteilnehmer jedoch, die im SNAQ eine hohe Angst vor Schlangen äußerten, waren ebenfalls in der Lage, sich dem Terrarium zu nähern. Klieger (1994) merkt in diesem Zusammenhang kritisch an, dass der SNAQ dazu tendiere, “Falsch-Positive” zu ermitteln, also Probanden, die laut SNAQ als hochängstlich, laut Verhaltenstest jedoch als niedrig ängstlich einzustufen wären. Gibt es kürzere, qualitativ mindestens ebenbürtige Alternativen zum SNAQ? 5
Die vorliegende Untersuchung fand zeitgleich zur testtheoretischen Überprüfung der deutschen Version des SNAQ durch Hamm (2006) statt. Daher unterscheiden sich die beiden Versionen des SNAQ sprachlich leicht.
VII. PAPER 6
153
Einerseits findet sich in der englischsprachigen Literatur zur Schlangenangst der Aspects of Snake Fear Questionnaire (Suedfeld & Hare, 1977), der mit nur 8 Items deutlich zeitökonomischer eingesetzt werden könnte. Dieses Instrument beruht im weitesten Sinne auf der Fear Survey Schedule-II (FSS-II, Geer, 1964), die 51 Ängste abfragt. In diesem Fragebogen stufen Probanden ihre Angst bezüglich eines gegebenen Objektes oder einer gegebenen Situation auf einer siebenstufigen Skala von ’none’ (gar nicht) bis ’terror’ (extrem) ein, wobei eine Angst jeweils nur durch dieses eine Item abgedeckt wird. Auf der Basis des einzelnen Schlangenitems des FSS-II entwickelten Suedfeld & Hare (1977) den ’Aspects of Snake Fear Questionnaire’, der etwas spezifischer in 8 Items verschiedene schlangenbezogene Situationen beschreibt, wie z.B. ’Having to enter a room where you know there is a snake.’ (Item 5). Damit erfasst dieses Selbstbeurteilungsinstrument ähnlich wie der SNAQ die verbal-kognitive Komponente der Schlangenangst. Analog zum FSS-II schätzen Probanden jeweils auf einer siebenstufigen Skala ein, in welchem Ausmaß sie die beschriebene Situation ängstigen würde. Explizite Gütekriterien liegen zu diesem Instrument leider nicht vor. Jedoch bestätigen die Autoren die Sensitivität des Fragebogens für Therapieeffekte. Demnach korreliert die Reduktion des Fragebogenscores durch eine Therapie auch mit einer Reduktion der Herzrate auf aversive Stimuli hin (r = 0.54), mit einer größeren Annäherung an Schlangen im Verhaltenstest (r = 0.52) und mit einer Reduktion der Angst bei der Annäherung (r = 0.76). Die Korrelationen verbaler und physiologischer Maße lassen eine gute Validität vermuten. Demnach könnte dieses Instrument in diesem Punkt die möglichen Schwächen des SNAQ in der Konstruktvalidität ausgleichen. Zusätzlich entwickelten wir in Anlehnung an das Spinnenangst-Screening SAS (Rinck et al., 2002) eine für Schlangenangst abgewandelte Version, das Schlangenangst-Screening (SCANS). Wie sein Vorgänger ist auch dieses Instrument mit nur vier Items sehr kurz. Diese erfassen hierbei jeweils eine der vier relevanten Diagnosekriterien der Schlangenphobie nach DSM-IV: die subjektive Empfindung der persönlichen Angst vor Schlangen, die damit im Zusammenhang stehende physiologische Aktivierung durch den Anblick von oder den Gedanken an Schlangen, die Vermeidung von Schlangen sowie die subjektive Belastung durch die Angst vor Schlangen. Die vorliegende Arbeit verfolgt das Ziel, die beiden zeitökonomischen Screeninginstrumente - die deutsche Übersetzung des 8-Item umfassenden Aspects of Snake Fear Questionnaire (Suedfeld & Hare, 1977) sowie den eigens entwickelten 4-Item umfassenden SCANS - auf die Gütekriterien hin zu überprüfen und mit dem wesentlich längeren SNAQ in Beziehung zu setzen. Da zum Zeitpunkt der vorliegenden Studie noch keine überprüfte deutsche Version des SNAQ vorlag, wurde dieser von uns als Schlangenangstfragebogen (SCAF), der ’Aspects of Snake Fear Questionnaire’ als Schlangenangstaspekte-Fragebogen (SANA) ins Deutsche übertragen. In Studie 1 wurden Interne Konsistenz, Retestrelia-
VII. PAPER 6
154
bilität und Konstruktvalidität von SCAF, SANA und SCANS untersucht. In Studie 2 überprüften wir die Validität der drei Instrumente durch Vergleich der Fragebogenwerte schlangenängstlicher vs. nichtängstlicher Probanden bzw. die Korrelation der Fragebogenscores mit der Annäherungsgeschwindigkeit an eine lebende Schlange (ca. 70cm lange Mexikanische Bergnatter) in einem Verhaltenstest. Methode Stichprobe
An Studie 1 nahmen insgesamt 289 Studierende der Technischen Universität Dresden teil (195 Frauen, 94 Männer). Sie füllten zu Beginn von Vorlesungen die Erhebungsinstrumente SCANS, SANA und SCAF zu zwei Messzeitpunkten vollständig aus. Die Teilnehmer waren zwischen 18 und 37 Jahre alt, im Mittel 21.7 (SD = 2.6). An Studie 2 nahmen aus der oben beschriebenen Stichprobe 8 Probanden mit Schlangenangst (mittleres Alter: 24.4, SD = 3.4) und 10 Personen ohne Schlangenangst (mittleres Alter: 21.9, SD = 2.0) teil. Damit unterschieden sich die Gruppen hinsichtlich des Alters nicht. Darüber hinaus wurde die Verteilung des Geschlechts in beiden Gruppen parallelisiert (Angstgruppe: 6 Frauen, 2 Männer/ Kontrollgruppe: 7 Frauen, 3 Männer). Vorgehensweise
In Studie 1 wurden die Probanden gebeten, ihre persönliche Haltung zu Schlangen durch Beantwortung der aus SCANS, SANA und SCAF bestehenden Fragebogenbatterie anzugeben. Alle Fragebogen-Sets enthielten als erstes den SCANS. Die Instrumente SANA und SCAF erschienen anschließend in permutierter Reihenfolge. Zwei Wochen später wurden denselben Probanden die gleichen Fragebögen erneut vorgelegt. Im Anschluss an die zweite Messung wurden die Teilnehmer über die Intention der Untersuchung aufgeklärt. Für Studie 2 wurde mit 25 potentiellen Probanden 6 aus der Gesamtgruppe der 289 Studierenden ein Interview auf der Basis der “Internationalen Diagnose Checklisten (ICDL) für DSMIV, Spezifische Phobie” (Hiller, Zaudig & Mombour, 1997) durchgeführt. Anhand des Interviewergebnisses konnten 8 Probanden in die Kategorie “Spezifische Phobie/ Spezifische Angst” sowie 10 Probanden in die Kategorie “überhaupt keine Angst” eingegliedert werden. Diese Probanden wurden gebeten, an einem Verhaltenstest teilzunehmen. Dazu wurden Teilnehmer vor einer verschlossenen Labortür darüber aufgeklärt, dass sich hinter der Tür, am anderen Ende des Raumes, eine Schlange in einem Terrarium befände. Dieser sollten sie sich so schnell und so nah, wie es ihnen möglich erschien, nähern. Wir erfassten Annäherungszeit sowie Distanz zum Terrarium. Anschließend wurden die Probanden über die Zielsetzung der Untersuchung aufgeklärt. 6
Diese 25 Studenten meldeten sich im Anschluss an eine Vorlesung auf unser Gesuch nach Probanden, die sich subjektiv entweder für sehr stark oder überhaupt nicht schlangenängstlich halten.
VII. PAPER 6
155
Messinstrumente
Schlangenangstfragebogen (SCAF) Beim SCAF handelt es sich um die ins Deutsche übersetzte Version des Snake Questionnaire (SNAQ) von Klorman et al. (1974). Die Übersetzung erfolgte - inklusive einer validierenden Rückübersetzung ins Englische - gemäß der Empfehlungen von Hambleton (1994) durch im amerikanischen Englisch sichere Experten. Der Schlangenangstfragebogen ist ein Selbstbeurteilungsinstrument, das die verbal-kognitive Komponente der Schlangenangst in einem Gesamtwert erfasst. Das Instrument besteht aus 30 Items, die in beide Richtungen gepolte Aussagen über Schlangen enthalten. Tabelle VI.2 gibt eine Übersicht über die 30 Items des SCAF. Table VI.2: Schlangenangstfragebogen (SCAF): Items, Itemretestreliabilitäten und ItemGesamtwertkorrelationen
Nr. Wortlaut 1
Ich vermeide es, in Parks oder auf Campingausflüge zu
Retest
Item Gesamt
.39
.34
gehen, weil es dort Schlangen geben könnte. 2
Ich würde etwas Angst fühlen, wenn ich eine Spielzeugschlange in meiner Hand halten würde.
.57
.36
3
Wenn während eines Film das Bild einer Schlange auf
.49
.46
dem Bildschirm erscheint, drehe ich meinen Kopf weg 4
Ich verabscheue es, Bilder von Schlangen in einer Zeitschrift anzuschauen.
.47
.50
5
Auch wenn es vielleicht gar nicht stimmen mag, stelle ich mir Schlangen als schleimig vor.
.74
.51
6
Ich genieße es, Schlangen im Zoo zu beobachten.
.57
.44
7
Mir graut bei dem Gedanken, eine harmlose Schlange
.71
.69
zu berühren. 8
Wenn jemand sagen würde, dass es hier Schlangen gibt, würde ich wachsam und nervös werden.
.59
.58
9
Ich würde nicht am Strand schwimmen gehen, wenn in
.52
.42
dem Gebiet jemals Schlangen gemeldet wurden. 10
Beim Tragen eines Schlangenhautgürtels würde ich mich unbehaglich fühlen.
.54
.24
11
Wenn ich eine Schlange sehe, fühle ich mich angespannt und ruhelos.
.59
.54
12
Ich genieße es, Artikel über Schlangen und andere
.58
.33
VII. PAPER 6 Nr. Wortlaut
156 Retest
Item Gesamt
Reptilien zu lesen. 13
Ich verspüre Übelkeit, wenn ich eine Schlange sehe.
.36
.44
14
Schlangen sind manchmal nützlich.
.52
-.25
15
Ich schaudere, wenn ich an Schlangen denke.
.59
.53
16
Es macht mir nichts aus, in der Nähe einer ungiftigen
.46
.55
Schlange zu sein, wenn jemand da ist, dem ich vertraue. 17
Manche Schlangen sind sehr attraktiv anzuschauen.
.69
.56
18
Ich glaube nicht, dass jemand eine Schlange halten könnte, ohne ein wenig Angst zu haben.
.48
.35
19
Die Art wie Schlangen sich bewegen ist widerwärtig.
.62
.61
20
Es würde mir nichts ausmachen, eine tote Schlange mit einem langen Stock zu berühren.
.56
.49
21
Wenn ich im Wald auf eine Schlange treffen würde, würde
.68
.63
ich wahrscheinlich rennen. 22
Ich habe mehr Angst vor Schlangen als vor irgendeinem anderen Tier.
.62
.51
23
Ich würde nicht in den Süden oder in tropische Länder
.39
.40
reisen wegen der größeren Verbreitung von Schlangen. 24
Ich würde keinen Kurs wie Biologie wählen, wenn ich dächte, ich könnte eine Schlange sezieren müssen.
.57
.34
25
Ich habe keine Angst vor ungiftigen Schlangen.
.44
.65
26
Ich habe nicht nur Angst vor Schlangen, auch Würmer
.64
.53
und andere Reptilien machen mir Angst. 27
Schlangen sind sehr anmutige Tiere.
.60
.49
28
Ich denke, dass ich nicht mehr Angst vor Schlangen habe als der Durchschnittsmensch.
.36
.27
29
Ich würde es bevorzugen, eine Geschichte nicht zu beenden, wenn etwas über Schlangen darin vorkommen würde.
.09
.30
30
Selbst wenn ich für einen sehr wichtigen Termin spät dran
.37
.39
wäre- der Gedanke an Schlangen würde mich davon abhalten, eine Abkürzung durch ein offenes Feld zu nehmen.
VII. PAPER 6
157
Probanden bewerten durch Ankreuzen jede einzelne Aussage zweistufig als für sie “zutreffend” oder “nicht zutreffend”. Jede als zutreffend eingestufte Aussage wird mit einem Punkt, jede als nicht-zutreffend beurteilte Äußerung mit 0 Punkten belegt. Die Ermittlung des Gesamtscores der individuellen Schlangenangst erfolgt durch einfache Summierung der 30 Itemwerte nach Umkodierung der negativ gepolten Items 6, 12, 16, 17, 20, 25, 27 und 28. Damit sind Gesamtscores im Bereich von 0 bis 30 möglich. Die Gesamtbearbeitungszeit beträgt etwa 6 Minuten.
Schlangenangstaspekte-Fragebogen (SANA) Der SANA ist die deutsche Übersetzung des Aspects of Snake Fear Questionnaire (Suedfeld & Hare 1977), die analog zum SNAQ erfolgte. Eine Übersicht der Items findet sich in Tabelle VI.3. Auf der Basis des Schlangenitems des FSS-II (Geer, 1964) entwickelten Suedfeld & Hare (1977) das ’Aspects of Snake Fear Questionnaire’, das über 8 Items die verbal-kognitive Komponente der Schlangenangst erfasst. Probanden geben selbst Auskunft darüber, in welchem Ausmaß sie die beschriebene Situation ängstigen würde, wobei ihnen die sieben Kategorien ’überhaupt nicht’, ’nicht sehr’, ’ein wenig’, ’etwas’, ’ziemlich’, ’sehr stark’ und ’extrem stark’ zur Verfügung stehen. Jede mit ’überhaupt nicht’ belegte Situation wird mit null Punkten, jede mit ’nicht sehr’ belegte Situation mit einem Punkt etc. belegt, sodass Summenwerte im Bereich von 0 bis 48 möglich sind. Die Ermittlung des Gesamtwertes kann durch einfaches Summieren erfolgen, da alle Aussagen in Richtung der Angst gepolt sind und ein Umkodieren einzelner Items damit nicht erforderlich ist. Die Gesamtbearbeitungszeit beträgt etwa 1 Minute. Schlangenangst-Screening (SCANS) Das Schlangenangst-Screening ist ein sehr kurzes Selbstbeurteilungsinstrument, dass mit nur 4 Items (vergl. Tabelle VI.4) die Erfüllung der vier relevanten Kriterien der DSM-IV-Diagnose “Spezifische Phobie” bezüglich Schlangen prüft. Analog zum Spinnenangstscreening (SAS: Rinck et al., 2002) erfragt das SCANS über jeweils ein Item die subjektive Empfindung der Angst vor Schlangen (Item 1), die damit korrelierende physiologische Erregung durch die Anwesenheit oder den Anblick von Schlangen (Item 2), die Vermeidung von Schlangen (Item 3) sowie die subjektive Einschätzung der Belastung durch die Angst vor Schlangen (Item 4). Das individuelle Zutreffen der vier positiv gepolten Aussagen beurteilen Probanden auf einer siebenstufigen Skala von 0 (“trifft gar nicht zu”) bis 6 (“trifft genau zu”). Der Gesamtwert errechnet sich durch einfache Summierung der Einzelitemwerte. Damit sind Gesamtscores zwischen 0 (gar keine Schlangenangst) und 24 (sehr ausgeprägte Angst vor Schlangen) möglich. Die Bearbeitung des SCANS dauert lediglich eine Minute.
VII. PAPER 6
158
Table VI.3: Schlangenangstaspekte-Fragebogen (SANA): Items, Itemretestreliabilitäten und Item-Gesamtwertkorrelationen
Nr. Wortlaut 01 Eine lebendige Schlange in einem verschlossenen Terrarium ansehen 02 Ein Bild einer Schlange ansehen 03 An Schlangen denken 04 Plötzlich eine sich bewegende Schlange sehen 05 Einen Raum betreten müssen, von dem Sie wissen, dass dort eine Schlange ist 06 Eine tote Schlange in einem verschlossenen Terrarium ansehen 07 Eine Kiste öffnen müssen, von der Sie wissen, dass sie eine Schlange enthält 08 Einen Film über eine Schlange sehen
Retest Item Gesamt .73 .81 .70 .68 .81 .79
.71 .74 .84 .81
.71
.74
.82
.84
.62
.70
Table VI.4: Schlangenangst-Screening (SCANS): Retest-Reliabilitäten und korrigierte ItemGesamtwert-Korrelationen
Nr. Wortlaut Retest 01 Ich habe Angst vor Schlangen. .81 02 Beim Anblick von Schlangen werde ich aufgeregt .73 und bekomme Herzklopfen. 03 Ich vermeide Schlangen. .67 04 Meine Angst vor Schlangen belastet mich. .67
Item Gesamt .91 .91 89 .78
Ergebnisse Da in keiner der folgenden Analysen die Reihenfolge der Fragebogendarbietung einen Effekt zeigte, werden die Ergebnisse für beide Variationen zusammengefasst dargestellt. Studie 1: Mittelwerte, Reliabilität und Konstruktvalidität
Mittelwerte In Tabelle VI.5 sind die Mittelwerte und Standardabweichungen der 289 Probanden im SCANS, SANA und SCAF zu den beiden Erhebungszeitpunkten dargestellt. Eine Auflistung findet sich hier zum einen für die Gesamtstichprobe, zum anderen getrennt nach Geschlecht. In Einklang mit bisherigen Angstprävalenzstudien (z.B. Fredrikson, 1996) finden wir in allen
VII. PAPER 6
159
Table VI.5: Mittelwerte und Standardabweichungen sowie Streubreite und Verteilungsschiefe in SCANS, SANA und SCAF
Fragebogen
Messzeitpunkt
SCANS
T1
SANA
SCAF
Mittelwert und Standartabweichung Männer Frauen Gesamt (n=94) (n=195) (n=289) 6,3 8,9 8,0 (5,7) (6,5) (6,4)
Min-Max Schiefe Werte
0-24
0,58
T2
4,9 (4,7)
7,4 (5,9)
6,6 (5,7)
0-24
0,78
T1
8,6 (7,4)
13,0 (8,3)
11,6 (8,3)
0-48
1,12
T2
7,7 (6,0)
12,6 (9,5)
11,0 (8,8)
0-48
1,30
T1
5,5 (3,7)
8,8 (5,3)
7,7 (5,1)
1-27
1,14
T2
5,3 (3,3)
8,7 (5,5)
7,6 (5,2)
1-27
1,11
drei Fragebögen einen deutlichen Geschlechtseffekt zu beiden Messzeitpunkten. Sowohl die multivariate Analyse (F (1, 287) = 23.6; p < .001) als auch die für die einzelnen Fragebögen separaten Analysen ergaben signifikant niedrigere Angstwerte für Männer (SCANS: F (1, 287) = 13.4; SANA: F (1, 287) = 22.0; SCAF: F (1, 287) = 30.9; alle p < .001). Darüber hinaus fanden wir für SCANS und SANA einen Effekt des Messzeitpunktes: zur zweiten Messung lag der Angstwert etwas niedriger (multivariat: F (1, 287) = 20.7, p < .001; SCANS: F (1, 287) = 44.5; p < .001; SANA: F (1, 287) = 4.6, p < .05). Die Analyse des SCAF ergab keinen Unterschied der Angstwerte zwischen den beiden Messzeitpunkten (multivariate Interaktion Fragebogen x Messzeitpunkt: F (2, 574) = 12.0, p < .001; SCAF: F (1, 287) = 1.1; p > .05). Diese Zeiteffekte gelten für beide Geschlechter gleichermaßen, eine Interaktion von Geschlecht und Messzeitpunkt fand sich in keiner der Analysen. Für SCANS und SANA fanden wir zu beiden Messzeitpunkten Probandenmittelwerte auf dem gesamten Score-Spektrum, im SCAF ermittelten wir für keinen der 289 Probanden Werte im oberen Extrembereich von 28 bis 30 (Tabelle VI.5). Zu beiden Messzeitpunkten ergaben sich für alle drei Fragebögen rechtsschiefe Verteilungen. Das bedeutet, dass sich ein Großteil der Probanden links des Mittelwertes, also im Bereich geringerer Angst, einordnen lässt. Für Männer finden sich dabei größtenteils ausgeprägtere Verteilungsschiefen als bei
VII. PAPER 6
160
Frauen (SCANS T1: 0.93 vs. 0.43; SCANS T2: 0.93 vs. 0.65; SANA T1: 1.82 vs. 0.94; SANA T2: 1.00 vs. 1.18; SCAF T1: 2.29 vs. 0.83; SCAF T2: 1.00 vs. 0.88). Reliabilität Auf der Hauptdiagonalen in Tabelle VI.6 sind die internen Konsistenzen von SCANS, SANA und SCAF dargestellt. Alle drei Fragebögen wiesen zu beiden Messzeitpunkten gute bis sehr gute Konsistenzkoeffizienten auf (SCANS: CronbachsAlpha = 0.89 zu beiden Messzeitpunkten; SANA: T1: CronbachsAlpha = 0.89/ T2: CronbachsAlpha = 0.93; SCAF: T1: CronbachsAlpha = 0.85/ T2: CronbachsAlpha = 0.86). Darüber hinaus zeigt die äußere markierte Diagonale in Tabelle VI.6 die Retest-Reliabilitäten der drei Fragebögen nach einem Intervall von 2 Wochen, die für alle Fragebögen ähnlich gut ausfallen. Die Retest-Reliabilität des SCAF ist mit rtt = .89 die höchste der drei Fragebögen, jedoch liegen die Item-Retest-Reliabilitäten weit gestreut zwischen rtt = 0.09 und rtt = 0.74 (Siehe Tabelle VI.2). Die Retest-Reliabilität des SANA ist mit rtt = 0.86 ähnlich zufriedenstellend, wobei die Werte auf Itemebene (Siehe Tabelle VI.3) auch etwas niedriger zwischen rtt = 0.62 und rtt = 0.82 liegen.Auch für das SCANS konnten wir trotz seiner Kürze eine gute Retest-Reliabilität von rtt = 0.84 für den Gesamtwert ermitteln. Die RetestReliabilitäten der vier einzelnen Items liegen niedriger, zwischen rtt = 0.67 und rtt = 0.81 (Siehe Tabelle VI.4). Konstruktvalidität Zur Berechnung der Konstruktvalidität wurden die Interkorrelationen der drei Fragebögen zu beiden Erhebungszeitpunkten ermittelt. Wie in Tabelle VI.6 ersichtlich, liegen diese alle im Bereich von “zufriedenstellend” bis “gut” (r = 0.72 bis r = 0.86). Damit lässt sich vermuten, dass die drei Fragebögen trotz ihrer Verschiedenheit in Inhalt und Umfang ähnliche Aspekte der Schlangenangst erfassen. Studie 2: Konstrukt- und Kriteriumsvalidität
Beim Vergleich von Personen mit Schlangenangst und Probanden ohne Schlangenangst zeigten sich für alle drei Fragebögen signifikante Unterschiede in der erwarteten Richtung: laut ICDL als Schlangenängstliche bzw. Schlangenphobiker eingestufte Probanden wiesen höhere SCANS-Gesamtwerte (1.5 vs. 18.3, t(16) = 17.7, p < .001), höhere SANA-Werte (5.6 vs. 18.5, t(16) = 5.0, p < .001) und höhere SCAF-Werte (4.2 vs. 12.6, t(16) = 4.6, p = .001) als nichtängstliche Kontrollpersonen auf (Siehe Tabelle VI.7). Lediglich im SANA sind die Überschneidungen zwischen den Gruppen relativ hoch (Kontrollpersonen 1 bis 12, Schlangenängstliche 3 bis 27). Im Verhaltenstest, bei dem sich Versuchspersonen zur Validierung der drei Fragebögen einer lebenden Schlange nähern sollten, zeigten sich hohe Korrelationen der Annäherungsgeschwindigkeit mit den Werten in allen drei Fragebögen
VII. PAPER 6
161
Table VI.6: Interkorrelationen von SCANS, SCAF und SANA zu den zwei Messzeitpunkten (außerhalb der Hauptdiagonalen; davon fettgedruckt Retest-Reliabilitäten) sowie Interne Konsistenzen (Cronbachs Alpha; fett gedruckt auf der Hauptdiagonalen)
SCANS T1 SANA T1
SCANS SANA T1 T1 .89 .78 .89
SCAF T1
SCAF SCANS T1 T2 .76 .84
SANA SCAF T2 T2 .75 .74
.84
.77
.86
.80
.85
.72
.81
.89
.89
.84
.77
.93
.86
SCANS T2 SANA T2 SCAF T2
.86
Table VI.7: Interkorrelationen von SCANS, SCAF und SANA zu den zwei Messzeitpunkten (außerhalb der Hauptdiagonalen; davon fettgedruckt Retest-Reliabilitäten) sowie Interne Konsistenzen (Cronbachs Alpha; fett gedruckt auf der Hauptdiagonalen)
Fragebogen SCANS
Min.-Max. Werte Nichtängstliche Schlangenängstliche Summe der Ratings 1.5 18.3 0 - 23 (1.8) (2.3)
SANA
Summe der Ratings 0 - 26
5.6 (3.4)
18.5 (7.3)
SCAF
Summe der Ratings 0 - 20
4.2 (1.9)
12.6 (4.9)
(SCANS: r = −0.62; SANA: r = −0.80; SCAF: r = −0.81, alle p < .01).
Diskussion Ziel der Studie war die Ermittlung der Gütekriterien eines neu entwickelten, zeitökonomischen Instrumentes zur Erfassung von Schlangenangst (SCANS) sowie des sehr kurzen aus dem Englischen übernommenen ’Aspects of Snake Fear Questionnaire’ (Schlangenangstaspekte-Fragebogen, SANA) und deren Vergleich mit den Gütekriterien des ’Snake Anxiety Questionnaire’ (Schlangenangst-Fragebogen, SCAF). Für den sehr kurzen und damit zeitökonomischen SCANS ließen sich eine sehr gute interne Konsistenz und eine gute Retest-Reliabilität berichten. Das Instrument trennte sehr gut zwischen ängstlichen und nichtängstlichen Probanden. Jedoch korrelierte der Gesamtwert
VII. PAPER 6
162
nicht so hoch mit dem Verhalten wie SANA oder SCAF. Für die Einzelitems konnten aber durchgehend sowohl gute Retest-Reliabilitäten als auch gute Itemgesamtwertkorrelationen ermittelt werden. Mit der übersetzten Version des Aspects of Snake Anxiety Questionnaires (SANA) liegt uns ein Instrument vor, das sich durch eine sehr gute interne Konsistenz und eine gute Retest-Reliabilität auszeichnet und hoch mit dem Verhalten korreliert. Es ist aufgrund seiner Kürze zeitökonomisch einsetzbar. Darüber hinaus trennt es gut zwischen ängstlichen und nichtängstlichen Probanden. Wie beim SCANS sind Retest-Reliabilitäten und Itemgesamtwertkorrelationen auf Einzelitemebene zufriedenstellend. Die deutsche Version des SNAQ (SCAF) ist durch eine gute interne Konsistenz charakterisiert. Der deutsche Fragebogen korreliert - anders als die englischsprachige Form - hoch mit dem Verhalten und trennt sehr gut zwischen Ängstlichen und Nichtängstlichen. Ähnlich wie die Originalautoren (Klorman et al., 1974) und Hamm (2006) konnten wir auch eine sehr gute Retest-Reliabilität feststellen. Während die Einzelitemanalysen für SCANS und SANA zufriedenstellend ausfielen, deuteten sich für den SCAF in diesem Bereich jedoch Schwachstellen an. Für ein Item (Item 29) zeigte sich eine sehr geringe Retestreliabilität, für mehrere Items fanden wir nicht befriedigende Itemgesamtwertkorrelationen (Items 10, 12, 14, 24, 28, 29). Eine genauere Inspizierung dieser Items, die zum Beispiel die Haltung der Probanden zum Tragen von Schlangenhautgürteln oder das Lesen von Geschichten über Schlangen erfragen, legt nahe, dass diese Items weniger konkret phobische Angst adressieren (wie z.B. Item 21, vor einer Schlange wegrennen). In Hinblick auf den in englischen Studien häufig ermittelten niedrigen Zusammenhang zwischen Fragebogen- und Verhaltensdaten diskutiert Klieger (1994) die Ambiguität einzelner Items des SNAQ. So ist z.B. nicht eindeutig klar, ob ein Proband das Item ’Beim Tragen eines Schlangenhautgürtels würde ich mich unbehaglich fühlen.’ aufgrund der Angst oder aufgrund moralischer Bedenken bestätigt. Mittels der Initial Response Verification Methode, die solche Ambiguitäten in einem follow-up Interview zu klären versucht, konnte Klieger (1994) nachweisen, dass der SNAQ sehr stark von der Interpretation der Versuchsperson abhängt. Darüber hinaus liefert Klieger (1997) empirische Daten, die vermuten lassen, dass der SNAQ nicht nur Angst, sondern damit konfundiert auch Ekel erfasst. Unsere zum Teil nicht befriedigenden Einzelitemwerte für den SCAF legen eine Bedeutsamkeit der von Klieger diskutierten Messprobleme auch für die deutsche Version nahe. Aus den unterschiedlichen Gütekriterienmustern lassen sich individuelle Verwendungsempfehlungen ableiten. Insgesamt betrachtet erzielen SANA und SCANS bei deutlich niedrigerem Umfang ähnlich gute Ergebnisse wieder der SCAF. Der direkte Vergleich der Fragebögen SANA und SCAF legt die Empfehlung nahe, die Entscheidung für ein Instrument von zur Verfügung stehender Erhebungs- und Auswertungszeit und gewünschter
VII. PAPER 6
163
Informationsdifferenzierung abhängig zu machen. Beide Instrumente weisen eine ähnlich hohe interne Konsistenz, Konstruktvalidität, Kriteriumsvalidität und Retestreliablität auf, jedoch ist der SANA kürzer und damit schneller durchzuführen. Besteht die Möglichkeit einer Nachbesprechung der Itemlösungen, z.B. zu Beginn einer Psychotherapie, erachten wir den SCAF durchaus als informativ wertvoll, da er individualisiert die Möglichkeit bieten kann, aus vermiedenen Situationen ein Therapierational abzuleiten. Für eingangsdiagnostische Fragebogenbatterien im therapeutischen Setting und größere Screenings für wissenschaftliche Untersuchungen jedoch, die beide möglichst zeitökonomisch ablaufen sollen und aufgrund einer (noch) fehlenden therapeutischen Beziehung stärker auf die Compliance der Untersuchten angewiesen sind, bietet sich eher der SANA an. Da dieser jedoch zu relativ großen Überschneidungen der Punktverteilungen von Ängstlichen und Nichtängstlichen führt, schneidet der SCANS im Vergleich als Screeninginstrument etwas besser ab: er weist nahezu durchgehend gute Gütekriterien auf, differenziert gut zwischen Hoch- und Niedrigängstlichen und ist darüber hinaus sehr schnell anzuwenden und auszuwerten. Da sich die vier Items direkt an den relevanten Kriterien der DSM-Diagnose ’Spezifische Phobie’ für Schlangen orientieren, ist eine hohe inhaltliche Übereinstimmung gegeben. Durch separate Summierung der ersten 3 Items ist es darüber hinaus möglich, Probanden mit Schlangenangst statt einer ausgeprägten Phobie zu finden, wenn das Ausmaß der Beeinträchtigung für die geplante Untersuchung irrelevant ist. Da der SCANS jedoch im Vergleich zu den beiden anderen untersuchten Instrumenten geringer mit dem tatsächlichen Verhalten korreliert, empfiehlt sich dieses Instrument allein nicht für Therapieeffektstudien. Hierfür sollte der Untersucher bevorzugt auf den SANA oder SCAF zurückgreifen. Eine abschließende Diskussion der Grenzen und Einschränkungen der vorliegenden Studie bringt zuallererst die Aussagekraft der hier vorgestellten Instrumente in den Fokus der kritischen Aufmerksamkeit. Wie für alle Fragebogenverfahren gilt selbstverständlich auch hier, dass bei jeder Art des Einsatzes bedacht werden muss, dass kein einzelner Fragebogen den Anspruch erheben kann, eine sorgfältige Diagnose durch einen geschulten Diagnostiker zu ersetzen. Um dies zu gewährleisten, ist eine Ergänzung um Exploration, klinische Interviews und behaviorale bzw. physiologische Tests unerlässlich. Vielmehr können vorliegende Fragebögen und Screeninginstrumente ohne großen Aufwand für den Praktiker Verdachtsmomente schaffen und damit eine gründlichere Exploration im therapeutischen Rahmen bahnen oder eine erste Orientierung für die Vorauswahl von Hoch- und Niedrigängstlichen für experimentelle Studien liefern. Darüber hinaus sind weitere testtheoretische Studien, die sich vor allem auch der Differenzierung der Emotion Ekel widmen, wünschenswert. Eine klare Trennung der beiden Emotionen Angst und Ekel kann mit aktuell zur Verfügung stehenden Selbstbeurteilungsinstrumenten nicht gewährleistet werden. Das derzeitig florierende theoretische und empirisch-experimentelle Interesse am engen Zusammenspiel von Angst und Ekel bei Phobien (z.B. Sawchuk, Meunier, Lohr, & Westendorf,
VII. PAPER 6
164
2002; Woody & Teachman, 2000; de Jong & Merckelbach, 1998) sollte dazu ermutigen, auch differenziertere Fragebögen zu entwickeln. Eine Abgrenzung der beiden Emotionen sollte die Qualität von Entstehungsmodellen, Diagnostik und Therapie der Spezifischen Phobien entscheidend beeinflussen.
General Discussion
The aim of this work was to examine the missing link in the research on cognitive biases in specific anxiety: explicit visual working memory. Disorder-specific cognitive biases are discussed as relevant in the pathogenesis of anxiety by cognitive theories of anxiety (e.g., Mathews & Mackintosh, 1998; Mogg et al., 2004; Williams et al., 1997). So far, it has been convincingly postulated and empirically verified that anxiety disorders are characterized by biases of attention, implying fast detection of threatening material and distractibility from other stimuli or activities in the presence of threat (for a review, see Mathews & MacLeod, 2005). The existence of memory biases in anxiety disorders is, in contrast, still controversial. Empirical data on the topic is ambiguous, and none of the theories integrates all of the available findings. In view of a lack of consistency in empirical data and theoretical concepts concerning memory biases in anxiety, it is particularly surprising that no single study has addressed visual working memory biases in anxiety, and that none of the theories makes any predictions concerning this issue, despite VWM’s potential role in anxiety as discussed above. An important challenge throughout this thesis was to bridge this gap in research on cognitive biases in anxiety. To investigate the relevance of biased visual working memory in anxiety, the presented research focused in eight experiments on the following main research questions: (1) Is threat preferably stored in VWM for anxious individuals? (2) Does threat preference occur at the cost of storage for other items or is extra storage-capacity provided? (3) Would the appearance of threat cause the interruption of encoding for non-threatening items? (4) Does prioritized encoding of threat in anxiety occur strategically or automatically? (5) Are disorder-specific VWM biases material-specific? (6) Are VWM biases in anxiety modifiable through cognitive-behavioral therapy? In this final chapter, a summary of the aims, methods, and key results of the conducted studies is provided, followed by an integrated, critical consideration of the results against the background of cognitive theories of anxiety and suggestions for extensions of these models. Following this, limitations concerning methodological aspects of the experiments and the ability to draw conclusions are highlighted, along with recommendations for direction of future research.
165
VIII. GENERAL DISCUSSION
166
Summary of the Results In Papers 1, 2, and 3, a visual-working memory task adapted from experimental psychology (Wolfe et al., 2006) was conducted with spider fearfuls and non-anxious controls, testing for immediate memory for spider vs. non-spider items. This paradigm allows for loading of visual working memory, by subsequently cueing a subset of items with a high frequency through the exogenous sequential guidance of attention to specific contents of a broad stimulus field. Serial position effects in visual working memory can be determined via this technique. Wolfe et al. (2006) found higher memory performance for the final one or two cued and attended items and decreasing accuracy for earlier stored items, as well as very low memory for uncued items. An adaptation of the task for real object stimuli should clarify whether threatening items, such as a spider for a spider fearful, disrupts these general principles by being preferably memorized, independent of position within working memory or regardless of whether it was cued or not. The experimental task requires participants to maintain information in memory and then to retrieve it at the end of each trial, without elaboration. One may assume that the high cueing frequency does not allow for strategic processes such as verbalization or elaboration. It was therefore predicted that this paradigm would be suitable for measuring enhanced immediate memory for threatening materials in spider fearfuls. To investigate the usefulness of the task introduced in Wolfe et al. (2006) for the measurement of visual working memory biases in spider phobia, Paper 1 details the first application of this paradigm to participants with clinically-relevant anxiety using real-world pictorial stimuli of varied valence. The question at hand was whether spider fearfuls and non-anxious controls would differ with respect to their visual working memory for spider compared to non-spider images. In addition, the paradigm allowed for measurement of the effect of a negative item on the recall of an item following or preceding it and, thus, determination of possible distraction effects of any memory bias for threat. The results of Wolfe et al. (2006) were replicated. The data suggests clear serial position effects for non-negative items in spider-free trials. Participants exhibited the best memory for the two most recently attended items, and declining accuracy for earlier stored items. Moreover, the data revealed improved memory for cued spider images compared to cued non-spider images at the same serial position as well as decreased memory for the item following a spider image within the cue string. These effects occurred to a similar degree in both groups. Moreover, the importance of serial position for spider images was clearly reduced in both groups, as earlier cued spider images were reported with high probability. In contrast to cued spider images, reliable group differences occurred with respect to the recall of uncued spider images. The advantageous threat-effect for uncued spiders in spider
VIII. GENERAL DISCUSSION
167
fearfuls was as strong as the cueing effect for non-spider items, an advantage that did not come at a cost for recall of cued non-spider images. From the results of enhanced memory for cued spiders and proactive interference it was concluded that all participants had difficulties in disengaging attention from a cued spider image, and that this prolonged processing of the spider image interfered with attention to the subsequently cued image, but also led to enhanced memory for this spider picture. It was supposed that the lack of group differences in the cued-condition was related to the type of attentional focus. All participants were instructed to voluntarily focus attention on the cued images. In line with theoretical predictions (e.g., Mathews & Mackintosh, 1998) and empirical studies (e.g., Becker & Rinck, 2004; Hermans et al., 1999; Windman & Krueger, 1998), anxiety-linked biases seldom occur when the detection of threat-items requires voluntarily focused attention. Presumably NACs were able to compensate for possible threat effects of cued spiders in the SF group by voluntary allocating increased attention to these items as well. In contrast, the instructions did not emphasize attention to uncued items, thereby directing voluntary attention away from them. SFs and NACs both accurately reported the most recently attended, cued item in only 70%-80% of trials, from which we drew the conclusion that participants did not spend 100% of their attention on cued items, allocating some of their attention to uncued items. As there were 11 uncued items presented simultaneuously, these competed strongly for attention. Competing conditions such as this are accepted as being a prerequisite for finding attentional biases toward threat in anxiety patients (e.g., Mathews & Mackintosh, 1998; Williams et al., 1997). It was proposed that while NACs distributed their attention evenly among the uncued items, SFs attention was reflexively captured by the threatening stimulus and, thus, put into VWM. However, as Paper 1 tried to replicate the original task (Wolfe et al., 2006) as closely as possible, each trial started with a 500 ms orientation phase before the cueing procedure began. During this temporal frame, all display stimuli were visible. This may have allowed some sort of strategic pre-processing of spider images before the cue sequence started. This could lead to a misinterpretation of the increased recall for uncued spiders in the SFs as a disorder-specific VWM bias. Moreover, the lack of group differences in the recall of cued spider images in Paper 1 might be attributed to this long initial orientation time, because NACs may have used specific encoding strategies during this time to make up for any advantage that SFs might have. Thus, Paper 2 tested the presumption that the preferential encoding of uncued spider images in SFs or the enhanced encoding of cued spiders in the NACs happens during the first 500 ms orientation time allowed in Paper 1. A second goal of Paper 2 was to test whether SFs would show a memory bias for any threatening image, or only for disorder-specific
VIII. GENERAL DISCUSSION
168
spiders. Therefore, Experiment I of Paper 2 was conducted with both SFs and NACs, using a task nearly identical to the one used in Paper 1. However, the intial orientation time was shortened to 150 ms. In Experiment II of the paper, SFs and NACs, both without snake anxiety, performed the task described above with a snake instead of a spider image as the critical item. With a shortened initial orientation time, cued spider images were still preferably remembered in both groups, but now less pronounced in the NACs, leading to a significant group difference. A reduction of serial position effects for the spider condition was now observed only in SFs, and only the fearfuls still exhibited proactive interference effects, implying lower memory for a cued item when it was preceded by a spider item. Though the initial orientation time was shortened, the strong memory advantage for uncued spider images in the SF group observed in Paper 1 still occurred. In Experiment II of Paper 2, cued snake images were favorably memorized in both groups, without any differences and without a weakening of position effects. In both groups, proactive interference of a snake image to the recall of the item following it did not occur. Uncued snake images were reported as poorly as uncued non-critical images in both groups. It was therefore concluded that the memory advantage for uncued spider images in the SF group in Paper I was not based on strategic pre-processing of the spider image in this group before the cue sequence started. Rather, data indicates that NACs strategically focused attention on the spider image in the first 500 ms and, thus, compensated for disorder-specific threat-advantage to cued spiders in the SF group. In view of the results of Paper 2, the VWM effect for uncued spider images found in Paper I seems to indeed reflect an anxiety-linked VWM bias, not an artefact of the 500 ms initial orientation time. Moreover, the reduction of the initial orientation time revealed the existence of a VWM bias for cued spider images as well. The group differences regarding memory for uncued spider images support the assumption of disorder-specific spontaneous engagement of attention to threat in fearfuls (Williams et al., 1997), the observed group differences in memorizing images following a spider image support the notion of slower disengagement from threat (Fox et al., 2001). Moreover, it was concluded that an avoidance of the processing of threatening materials in terms of Williams et al. (1997) starts beyond working memory. Threatening materials are favorably processed in VWM, while avoidance might come into play at a later processing stage. The lack of any group differences in Experiment II when presented with a snake image suggest that the disorder-specific effects found in Paper 1 and Experiment I of Paper 2 were also material-specific, that is, group differences might be attributable to individual threat values of the spider image instead of mere psychophysical salience or evolutionary relevance. However, the effect of enhanced memory for spiders in the NACs and snake images in both groups in Experiment II without fear for these animals was interpreted as evolution-related. It might still be the case that stimuli of evolutionary relevance are preferably selected to enter VWM.
VIII. GENERAL DISCUSSION
169
In Paper 3, the question addressed was whether successful cognitive-behavioral therapy could not only reduce physiological anxiety response and avoidance, but also influence anxiety-specific cognitive biases such as the VWM biases reported above. If we assume that cognitive biases are involved in the pathogenesis of anxiety, can they be modified? Recent studies investigating the malleability of anxiety-linked cognitive biases have not provided evidence for changes in disorder-specific cognition through intervention (e.g., Huijding & deJong, in press; Thorpe & Salkovskis, 1997). This seemed surprising, as other studies have provided evidence that psychotherapy is able to modify neurochemical and neural correlates of specific phobia (e.g., Gaab, Jucker, Staub, & Ehlert, 2005; Straube, Glauer, Dilger, Mentzel, & Miltner, 2006). Therefore, in Paper 3, a study was conducted that aimed at circumventing the methodological limitations of prior research, for instance, the lack of suitable non-treatment control groups and the investigation of relatively small bias effects in both patients and controls. Two groups of spider fearfuls performed the VWM task presented in Experiment I of Paper 2 thrice. This task seemed advantageous in several ways. As the VWM bias of uncued spider images described in Papers 1 and 2 is highly specific to spider fearfuls and does not occur in non-anxious controls, one should expect a greater probability of finding intervention effects on the cognitive bias - if they exist. In addition, no study had investigated the malleability of memory biases or VWM biases in anxiety. Changes in the VWM bias for uncued vs. cued spider images were measured over three test sessions and compared between groups. The treatment group received a one-session cognitive-behavioral training (Oest, 1996) after the first test, the waiting group received the intervention after the second test. The results suggested poor intervention-related changes in the strategic working memory advantages, reflected in memory for cued spiders. In contrast, the results indicated clear malleability of the automatic and highly disorder-specific VWM biases reflected in a reduced memory advantage for uncued spider pictures after therapy. As an explanation for the differences in the malleability of the bias for cued vs. uncued threat images, it was thought that the disorder-specificity of a bias is relevant for the statistical detection of changes. While memory advantages to cued spiders occur in both fearfuls and controls with only slight differences, advantages for uncued spiders occur only in fearfuls. The greater the difference between fearfuls and controls before intervention, the greater is the scope of intervention-induced changes. Moreover, it was suggested that the treatment-sensitivity of uncued-threat-advantage for cued spider items reflects characteristics of the disorder that are specifically addressed in the intervention. Hypervigilance and reflexive orienting of attention to threatening stimuli are typical characteristics of a specific phobia. These actions carry particular weight in the presence of a spider image that is not task-related. While both fearfuls and controls strategically encode cued images,
VIII. GENERAL DISCUSSION
170
as it is required by the task instructions, fearfuls additionally reflexively attend to a spider image that is presented outside the cue string. This hypervigilance is therapeutically approached in exposure training, as patients experience habituation to the threatening stimulus. Presumably, this is the reason why intervention effects are especially strong in this experimental condition. On the other hand, the data suggests a rebound effect, where the VWM bias to uncued spider images increases rapidly within the follow-up period, although self-report questionnaires and behavioral approach tests reflect subjective satisfaction with therapeutic success. This observation is in line with research indicating that stable changes in automatic associations take longer than changes in intentional, self-reported associations (e.g., Strack & Deutsch, 2004). In addition, this is in accordance with clinical experience that a stabilization of the first, quick therapeutic successes requires continuous practicing with the threatening materials (Oest, 1996). It remains open whether the strength of this rebound effect is an indicator of future relapse. The remaining question, addressed in Paper 4, was whether the disorder-specific advantages observed in Papers 1 and 2 are exactly derived from faster automatic memory consolidation of the spider image in the fearful group, or from strategic storage of all spider images. Prior research suggests that disorder-specific VWM biases occur due to differences in voluntary vs. reflexive attention employed among groups. Both groups were instructed to direct voluntary attention to cued items, but uncued spiders were salient only for the fearfuls, whose attention was presumably reflexively captured. However, an alternative explanation remained. Fearfuls might have strategically encoded all spider images, both cued and uncued, because it was obvious to all participants that the study addressed fear of spiders. In Paper 4, a more temporally precise visual working memory paradigm from experimental psychology was adapted to real objects including one spider image to clarify this issue. As the original change-detection task presented by Luck and Vogel (1997), this paradigm consisted of three task versions. In the main task, a study display including several pictures was presented for 100 ms. A test display was then shown, with either the same images as the study display or with one item replaced with a new image. Participants were then required to decide whether the test display was the same as or different from the study display. In a second version, the study display was presented for 500 ms to exclude for perceptual difficulties rather than working memory capacity limitations leading to lower change detection performance in higher set sizes. In the third task, the study display was presented for 100 ms, but the test display depicted only one item, for which participants had to decide whether or not it had been presented earlier to exclude difficulties on the decision stage as an explanation for lower accuracy with higher set sizes. As Luck and Vogel (1997) using colored dots yielded the same accuracy results in all three task conditions, they concluded that this task indeed measures VWM. The main questions investigated in Paper 4 were: would high and low spider fearfuls differ
VIII. GENERAL DISCUSSION
171
in detection performance for the disappearance or appearance of a spider image, would this bias occur during a specific task version, would this bias be associated with poorer detection for changes applied to non-spider images in the presence of a spider image, and would the bias occur for spider images specifically or in general for other negative materials? Experiment I of Paper 4 involved the three versions of the task described above, and change-detection differences in spider vs. non-spider trials in SFs and NACs were compared. In Experiment II of Paper 4, only the main task was presented to SFs and NACs without snake anxiety, once with a spider image as the critical item, once with a snake image. Experiment I revealed that both groups more accurately detected changes to spider items compared to non-spider items, with an additional tendency to do so for the fearfuls group. Group differences were most pronounced with short study time and for trials in which a spider image disappeared during the transition from study to test display vs. when they appeared only on the test display. The presence of a spider image did not cause lower detection performance for changes applied to non-spider images when shown at the same time. In Experiment II, changes of spiders and snakes were noticed preferably in both groups, with an additional advantage for SFs only in the spider block. It was concluded that these group differences reflect VWM biases that are based on very quick, automatic attentional bias to the spider image. Presumably, 100 ms was sufficient for the SFs to reflexively detect and encode the threat item, while the NACs might have aimed at encoding as much as possible, without any automatic preference. With additional encoding time, the probability of encoding the spider increased in the NACs group, leading to the NACs catching up with the disorder-specific threat advantages observed at shorter presentation times. The observation that group differences were particularly strong in the detection of the disappearance of a spider image, but did not occur when a spider appeared in the test display indicates that disorder-specific biases exceed the processing level of attention, as the task required short-term retention of the spider image in working memory. As in previous research, the lack of any costs of these memory advantages was remarkable, but might be attributed to an additonal processing pathway (e.g., Cave & Batty, 2006) deriving from stronger connections between the high-level representation of the spider image and its specific visual features in SFs. While Papers 1 and 2 provided evidence that disorder-specific VWM biases in specific anxiety exist, particularly to threat items that require reflexive attention, and Paper 3 indicated that these biases are indeed based on automatic, rather than strategic encoding of threat, Paper 5 was intended to clarify the degree of preferential automatic selection of threat into VWM. Does it occur at the expense of stimuli undergoing the capacity-limited encoding process? Would the sudden appearance of a spider cause premature drop-out of
VIII. GENERAL DISCUSSION
172
an item currently in the processing channel? To address this question, a paradigm with high temporal, rather than spatial resolution was required, which included the distribution and competition of stimuli over time, but not over space. An Attentional Blink task specifically addresses the successive consolidation of items. In Experiment I of Paper 5, numerous pictorial stimuli were rapidly presented for 80 ms. The task was to identify the two target pictures indicated by a brighter background and report these items at the end of the trial. The first target (T1) was of neutral valence and had to be judged as kitchen-item vs. no-kitchen-item. The valence of the second target (T2) was varied as either neutral (mushroom), positive (blossom), or negative (spider), these targets had to be reported as mushroom, blossom, or spider. The distractors were neutral. In Experiment I, a group of randomly selected participants was tested to investigate whether any variations in the Attentional Blink with spider images correlated with the spider anxiety assessed with self-report questionnaires. Experiment II involved two extreme groups, SFs and NACs, both without snake anxiety, to test whether group differences in the Attentional Blink with spider targets occurred. The task was nearly the same as in Experiment I, but included two types of negative T2 targets, the disorder-related spiders, and the disorder-irrelevant snakes. In a classical Attentional Blink (AB) paradigm, the second target (T2) is reported with reduced probability when it appears within a specific temporal frame after the first target (T1; e.g., Shapiro, Raymond, & Arnell, 1994) in a rapid serial visual presentation. The extremely capacity-limited working memory consolidation process is proposed as causal in this pattern, as this resource is still working on the first target when a second target is presented. Until this process is finished for the first target, the second target is held in a preattentive, vulnerable state, in which it can be easily lost (e.g., Chun & Potter, 1995). However, when the second target is threatening, can it disrupt ongoing processing and subvert the limited resources? In Experiment I, significant AB effects were found in all T2 valence conditions between 160 and 320 ms, without any differences in onset or duration of the AB. Positive and negative T2 pictures were better reported than neutral images. However, the magnitude of the AB was significantly lower only in the spider condition, but the strength of this effect was not associated with individual spider anxiety. The report probability of T1 was not reduced when it was followed by a spider, ruling out a general preferential processing of spiders at the expense of items currently under processing. In Experiment II, SFs and NACs differed with respect to mean report probability of a spider T2 and the AB strength in spider curves in favor of the fearfuls. In addition, both groups revealed higher T1 accuracy in spider trials. Results were taken to indicate that participants in general preferably select emotional stimuli for processing. The lower AB to spiders in Experiment I might reflect either that the pre-encoding representation of a spider T2 is more durable and, thus, less prone
VIII. GENERAL DISCUSSION
173
to forgetting, or that additional processing resources, for instance derived from inherent vigilance for spiders (Seligman, 1971), accelerate the formation of a higher representation. The presented research was not designed to clarify this issue. Data from both experiments does not indicate that spider memory advantage occurs at the cost of the item currently undergoing processing. Rather, in particularly high and low anxious participants, the processing of the spider image seems to require even less resources. In Paper 6, an essential byproduct of the experimental work was presented. For the selection of suitable participants for experiments of Paper 2, 4, and 5, screenings reliably and economically assessing snake anxiety were required. When the studies were planned, German short-screening instruments measuring the verbal-cognitive aspect of snake fear were not available. Due to this situation, the Snake Anxiety Questionnaire (SNAQ; Klorman, Hastings, Weerts, Melamed, & Lang, 1974), which is an English 30-item self-report questionnaire, and the English 8-item Aspects of Snake Anxiety Questionnaire (Suedfeld & Hare, 1977) were translated and comparatively tested for reliability and validity. In addition, the Snake Anxiety Screening (Schlangenangst-Screening, SCANS) was developed in the style of the Spider Anxiety Screening (SAS; Rinck, Bundschuh, Engler, Mueller, Wissmann, Ellwart, & Becker, 2002) and tested for psychometric properties. With only 4 items, this instrument assesses the relevant criteria for a DSM-IV diagnosis snake phobia. The German version of the SNAQ was introduced as the Schlangenangstfragebogen (SCAF), and the German version of the Aspects of Snake Anxiety Questionnaire was presented as Schlangenangstaspekte-Fragebogen (SANA). The more extensive instrument SCAF yielded not only good internal consistency, but also very good test-retest-reliability. It clearly correlated with behavior and was excellent at differentiating between high- and low-anxious participants. For both shorter questionnaires SANA and SCANS, very good internal consistency and good test-retest-reliability were found. The SANA correlated highly with behavior in approaching a snake. In addition, it satisfactorily differentiated between groups, although the scores of the two groups were overlapping to a certain extent. Vice versa, the SCANS differentiated between the groups without any overlaps, but did not correlate as well with behavior as the other measures. Summarizing, the shorter economic instruments provide nearly as good psychometric properties as the much more extensive SCAF. While the SCANS is suggested as screening instrument for research or therapy, the SCAF and SANA are the better choice in intervention-effect studies, as they yield superior concurrent validity. As the results of Paper 6 are rather secondary to the discussion of the core of this work – the experimental results regarding visual working memory in specific anxiety – these are excluded from the following discussion of experimental data. An elaborate discussion of relevance and limitations of the study investigating the psychometric properties of the three snake anxiety
VIII. GENERAL DISCUSSION
174
questionnaires is provided in Chapter VII. The core results of this dissertation addressing VWM biases in specific fear in short: • Both anxious and non-anxious controls show VWM advantages for negative materials such as spider or snake images. • In addition, there are disorder-specific VWM biases, reflected in stronger magnitudes of effects that occur in non-anxious controls and in some effects that only occur in spider fearfuls. • Group differences and, thus, disorder-specifity are particularly pronounced under competitive circumstances, that is, under the condition of numerous stimuli competing for processing resources: when little orientation time is allowed, when little time is provided for selecting and encoding items and when VWM for the critical item requires reflexive, rather than voluntary attention. • Pronounced memory for task-relevant, voluntarily attended spiders is related to difficulties in disengaging attention from these items in the fearfuls group, reflected in reduced memory accuracy for the item following it. • Disorder-specific VWM biases seem to be based on attentional biases to threatening materials resulting in a very quick, automatic memory consolidation. • All reported disorder-specific VWM biases occur specifically with fear-related materials, not with all kind of negative materials. • Very automatic and highly disorder-specific fear-related VWM biases – but not strategic VWM biases occur in both groups - and are modifiable through cognitivebehavioral intervention.
Theoretical Implications In the introductory chapter, the most influential current cognitive theories of anxiety were reviewed and evaluated with respect to their value in explaining empirical research results. As indicated, predictions concerning anxiety-linked memory biases vary strongly between the models, and none of the approaches is able to integrate all the empirical data. The results of this dissertation indicate that current cognitive models of anxiety require specific refinements and need to be extended by predictions concerning VWM in particular. In the following section, three recommendations for extensions of the current theoretical approaches are given, based on the empirical results of this dissertation. It is suggested (1) to differentiate between working memory and longer-term storage, (2) to distinguish between
VIII. GENERAL DISCUSSION
175
the different components of attention - shift, engagement, and disengagement (Posner & Peterson, 1990), and (3) to consider different types of threat value, namely threat that derives from individual phobic anxiety vs. threat that derives from biological prepotency of stimuli. These recommendations are more extensively explained below and further integrated into a proposal for a contemporary cognitive model of anxiety. The model presented here requires consideration as merely a first draft of theoretical refinement. It does not claim complete integrity, as only a fraction of the topic of unexplained memory bias was addressed within this dissertation. Nevertheless, it refers to specific gaps and disadvantages in previous approaches and recommends extensions of the cognitive-theoretical conceptualization of anxiety based on the results of this work. First Recommendation for Extension: Inclusion of VWM Predictions So far, research on cognitive biases in anxiety either addressed biased attention or memory. While evidence for attentional preference of threatening materials in anxious individuals is well confirmed, results concerning memory biases in anxiety are inconsistent (for a review, see Mathews & MacLeod, 2005). This confusion is reflected in cognitive models of anxiety, which clearly differ with respect to memory bias predictions. Most of these approaches emphasize the relevance of the type of information-processing for the occurrence of memory biases. Nearly all models expect memory biases for threatening vs. non-threatening materials as long as the required elaborative processes are non-conceptual. Based on this prerequisite, Williams et al. (1997) predict implicit memory biases and disclaim the existence of explicit memory biases in anxiety. Other authors either do not exclude (Mathews & Mackintosh, 1998) or suggest the possibility of finding explicit memory biases as long as the elaborative processes are perceptual, rather than verbal-conceptual. In contrast, the vigilance-avoidance hypothesis (e.g., Mogg et al., 2004) assumes a very quick avoidance of further processing of threatening materials and, thus, predicts no anxiety-linked memory biases. Throughout this dissertation, several visual working memory tasks were applied that required visual-perceputal encoding and explicit retrieval. In addition to VWM advantages for threatening materials that occurred in both anxious and nonanxious participants, data provide clear support for the assumption that specific phobia is related to additional disorder-specific VWM biases. Therefore, the results conflict with some of the currently most influential cognitive theories of anxiety, particularly those that assume an early cognitive avoidance of threat that is associated with the prevention of elaboration of threatening contents (Mogg et al., 2004; Williams et al., 1997). Moreover, none of the existing models provides explicit predictions concerning visual working memory, leaving a wide gap in the theoretical conzeptualization of cognitive biases in anxiety.
VIII. GENERAL DISCUSSION
176
The results presented throughout this work suggest that avoidance of the processing of threatening materials in anxious participants (e.g., Mogg et al., 2004; Williams et al., 1997) does not start within visual working memory. Threatening stimuli are preferably kept in VWM by individuals with specific anxiety. Nevertheless, it remains possible that the assumed avoidance starts at a later stage of elaborative processing. Further resarch is required to determine the rubicon where hypervigilance gives way to an avoidance of deeper processing. Newer approaches suggest the differentiation of two types of encoding, perceptual vs. conceptual elaboration, as relevant in the prediction of memory biases in anxiety (e.g., Fox & Georgiou, 2004; Mathews & Mackintosh, 1998). This differentiation has proven of value, as research confirms that memory biases are more likely to occur after perceptual, rather than after conceptual elaboration (Russo, Fox, Bellinger, & Nguyenvan-Tam, 2001; Wilhelm et al., 1996). Moreover, these approaches are supported by this work, as explicit memory biases after perceptual encoding were found. Nevertheless, this single classification within memory seems insufficient in view of a broad continuum of memory, ranging from sensory storage and working memory to more permanent long-term memory. Working memory for threat implies that a threatening object is still present or at least was several seconds ago. In contrast, longer-term memory for a threatening object suggests that there is a temporal and presumably even emotional distance to the feared stimulus. In the first case, anxiety symptoms might be still active, while this is less likely in the second case. It becomes apparent that these two examples reflect very distinct aspects of information-processing that might be associated with different handling of threat. Therefore, the most relevant recommendation for an extension of cognitive models of anxiety is a more precise conzeptualization of memory within clinical-cognitive models. In particular, it is suggested to supplement a working memory module that is currently missing entirely. Second Recommendation for Extension: Engagement and Disengagement Another important distinction that is not considered by most current cognitive models of anxiety is that between the three separate components of attentional selection, the shift of attention towards an object within the external environment, the engagement of attention to that object, and the disengagement of attentional resources to move to another stimulus (Posner & Peterson, 1990). As outlined in the introductory chapter of this work, it has been empirically confirmed that anxiety is related to attentional biases for feared materials (for a review, see Mathews & MacLeod, 2005). Most models attribute attentional biases to an anxiety-related hypervigilance for threat that results in a quick shift and engagement of attentional resources to threat (e.g., Mathews & Mackintosh, 1998; Williams et al., 1997). In contrast, Fox and colleagues suggest increased dwelling on threat once it has been noticed as the cause for attentional biases instead (e.g., Fox, 1993; Fox & Georgiou, 2004). Most of the previous work concentrated on confirming one of the two hypotheses. There is obviously a lack of paradigms that allow the simultaneous measurement of both components.
VIII. GENERAL DISCUSSION
177
The paradigm presented in Papers 1 to 3 of this thesis allowed this possibility. The results indicate that not one or the other, but both components of attention might be relevant in anxiety. Fox and colleagues (e.g., Fox & Georgiou, 2004) hypothesize that anxious individuals let their attention wander through their environment the same way as non-anxious. While non-anxious controls disengage from detected threat as they would from unthreatening materials, the attention of anxious observers is confined to the threat stimulus for a longer moment. The results of the experiments presented in Papers 1 to 4 hold against this assumption and suggest that delayed disengagement alone is not capable of explaining all disorder-specific effects of attention and VWM. Both paradigms applied in Papers 1-4 make high demands on the attentional system. The quick cueing procedure in the experiment introduced in Paper 1 leaves only very little time for paying regard to uncued items visible within the display. The encoding time of 100 ms for a display filled with several images as detailed in Paper 4 also allows no extensive investigation of all display stimuli. Rather, a selection has to take place very quickly in both paradigms. Interestingly, fearfuls select the fear-related image in both paradigms. In the experiments described in Papers 1 to 3, fearfuls showed an outstanding memory advantage for uncued spider images. Also in Paper 4, differences between anxious and non-anxious control participants concerning the detection of spider changes were especially pronounced with the shorter encoding time, leaving little time for several attentional shifts. These results cannot be explained by delayed disengagement from threat, but merely by a quick attentional engagement to it. It seems conditions of extreme competition by stimuli for attentional resources are related to the occurrence of disorder-specific effects of attention and VWM, as these conditions might be still sufficient for anxious individuals to reflexively detect the threatening object and shift attention to it, but not for non-anxious controls. However, the paradigm specified in the first three papers additionally allowed for the observation of direct effects of encoding of a threatening cued image on memorization of the item following it. As outlined, spider fear was related to lower VWM for nonthreatening items following a spider image. This indicates that threat is not only reflexively attended in anxious observers, but that the attentional disengagement is additionally delayed. Therefore, a second recommendation resulting from data presented herein is to theoretically and empirically differentiate between the several components of attention. Of course, this dissertation makes only a small contribution to the debate on which attentional components are relevant for attentional biases and VWM biases. Nevertheless, it provides a promising basis for future research that should clarify whether indeed both engagement and disengagement play a role in anxiety-linked biases of attention and VWM. For instance, follow-up research might apply an Attentional Blink paradigm as described in Paper 5 with a spider as the first of two target images (T1) to investigate whether the proactive interference
VIII. GENERAL DISCUSSION
178
effects caused by spider images as observed in Papers 1 and 2 were indeed due to delayed disengagement and prolonged encoding. If so, employing a spider as the first of two targets should produce pronounced Attentional Blink effects. Research on eye movements has already shown that anxious individuals perform a quick eye movement to a threatening stimulus, but that fixation duration is only short (e.g., Hermans et al., 1999; Rinck & Becker, 2006). This observation argues against the relevance of difficulties in attentional disengagement in anxiety. However, an eye movement to a specific spatial position does not guarantee attention to that location at the same time. Taking the eye off of a threatening stimulus does not ensure that this object is completely out of attention. The present work adds to the eye tracking results by assessing covert instead of overt attention independent of eye movements. Third Recommendation for Extension: Evolutionary Relevance of Materials Along with the outlined disorder-specific VWM biases occuring only in the fearfuls group with feared materials, some group-independent effects were determined, suggesting a general influence for negative valence of the stimulus materials. Participants showed enhanced memory for spiders and snakes compared to other images even when they did not fear them. These results might be explained by theories assuming prepotency or preparedness (Seligman, 1971), whereas prepotency describes a greater alertness to evolutionary relevant stimuli, and preparedness implies an enhanced readiness for the conditioning of such materials. Possibly, the VWM preferences for spiders and snakes observed in the presented studies, even in participants not fearing these animals indeed trace back to their evolutionary relevance. Darwin (1877) assumed the existence and relevance of some kind of prepotent fears: ”May we not suspect that the [...] fears of children, which are quite independent of experience, are the inherited effects of real dangers [...] during ancient savage times?”. Also Marks (1987) suggests that such a biological priming effect would be highly efficient, as it would significantly contribute to the survival of the species: if each individual had to experience and learn danger cues on her or his own, this would increase the risk of extinction of the species. In accordance, fears start only at the age when a child is capable of moving autonomously, that is, at a time when fears start to be adaptive (see Marks, 1987). Interestingly, objects or situations of evolutionary relevance are indeed more often at the core of a phobia (e.g., DeSilva, Rachman, & Seligman, 1977; Guentuerkuen, 2000; McNally, 1987; Mineka, 1985; Oehman, Erixon, & Lofberg, 1975). Sometimes people fear evolutionary relevant objects, for instance snakes, although they have never had contact with them (Kirkpatrick, 1984). The observation that people more often develop spider phobias - despite rather harmless European spiders - than phobias concerning power-receptacles or weapons has led researchers to the assumption that both individual experience and a phylogenetic disposition cause phobic reactions (e.g., Seligman, 1970; DeSilva et al., 1977). Further support for this theoretical pathway derives from ”differential conditioning”
VIII. GENERAL DISCUSSION
179
experiments, implying increased physiological response - as for instance skin conductance - to evolutionary relevant stimuli such as snakes and spiders compared to flowers or mushrooms and an even more increased physiological response to these stimuli after aversive conditioning (e.g., Cook, Hodes, & Lang, 1986, Fredrikson, 1980; Hughdal & Kaerker, 1981; Oehman, Dimberg, & Oest, 1984). These results are in line with the observations in this dissertation that both spider fearfuls and non-anxious controls reveal VWM advantages for snakes and spiders even though they did not fear them. Still, some alternative hypotheses might explain the VWM advantage occuring for critical images in both groups. These issues are in more detail discussed at the end of this chapter. For instance, both the spider image and the snake image are psychophysically outstanding compared to most other images concerning the dark color or the typical patterns. Most of these alternatives were excluded throughout this dissertation. Nevertheless, a repetition of the experiments with negative images without evolutionary impact is still required. However, several other empirical studies explicitly considering methodological limitations of this work also indicate the importance of evolutionary relevance of stimuli for information-processing even in non-anxious observers (e.g., Oehman et al., 1984; Oehman, Flykt, & Esteves, 2001; Oehman & Soares, 1998). Some of the cognitive models of anxiety included these empirical observations in their conceptualization and postulate that not only highly feared stimuli but also biologically relevant materials may receive greater information processing priority, leading to attentional biases (e.g., Mathews & Mackintosh, 1998; Oehman, 1993). However, most cognitive theories of anxiety do not consider the prepotency value of stimuli (e.g. Williams et al., 1997), and so far none of the models provides predictions concerning prioritized VWM for prepotent materials. Therefore, a third recommendation for the revision of cognitive models of anxiety is to insert predictions concerning not only the prioritized attention to biologically relevant materials, but also the prioritized VWM retention of these stimuli. As detailed at the end of this chapter, further VWM tests with threatening materials without evolutionary relevance, for instance grenades, would be indispensable for investigating this recommendation. Draft of a Cognitive Model of Anxiety Considering the Results of this Thesis Based on the results of this thesis, which suggest VWM biases in specific phobia and with respect to the review of empirical research on cognitive biases reviewed in the introductory chapter, this section offers a proposal of an extended cognitive model of anxiety. As outlined above, current approaches require specific supplementations. The most relevant disadvantages of cognitive-theoretical approaches of anxiety identified throughout this thesis are: (1) None of the models provides predictions concerning biased processing of threatening materials in VWM or working memory in general. (2) With one exception (e.g., Fox & Georgiou, 2004), most of the clinical-cognitive views do not differentiate between
VIII. GENERAL DISCUSSION
180
attentional engagement to and attentional disengagement from threatening materials in the prediction of disorder-specific distortions of anxiety. (3) Most models provide no predictions for general biases concerning evolutionary relevant materials. Figure VIII.1 outlines a draft of an extended cognitive model of anxiety referring to the postulations and terms of Williams et al. (1997).
Affective Decision Mechanism
INPUT
PRIMING
Resource Allocation Mechanism
ATTENTION
ENGAGEMENT individual
threat value prepotency
Attentional Engagement Bias
DISENGAGEMENT Attentional Disengagement Bias
ENCODING perceptual
no
MEMORY
conceptual
SHORT-TERM
Perceptual WM Bias
Conceptual WM Bias
LONG-TERM
Perceptual Memory Bias
Conceptual Memory Bias
Figure VIII.5: Draft of a cognitive model of anxiety extended by a more detailed view of attention, a more elaborated classification of memory, including a working memory module, and a more precise view of the threat value of stimuli as evolutionary relevant vs. individually relevant.
The most remarkable extension in regards to the model of Williams et al. (1997) is a more detailed information-processing string. While Williams et al. (1997) suggested a simple classification of attentional vs. elaborative processes; the proposed model involves two different attentional components, namely engagement and disengagement, as well as two memorial components, namely short-term and long-term memory. The encoding component is the link between attention and memory. The model proposes that a preattentively working affective decision mechanism automatically evaluates the threat value of external stimuli. Threat is signaled when the stimulus is imprinted biologically or when the stimulus is associated with individual phobic anxiety. However, the more severe the threat value of a stimulus is, the faster the threat information is forwarded to the attentional system, as the detection threshold for these stimuli is reduced.
VIII. GENERAL DISCUSSION
181
Any registration of threat results in the automatic orientation of attentional resources to that stimulus. As visualized with the arrows of varying thickness emanating from the bar in the left of figure VIII.1, the following information-processing biases are more likely to occur and stronger for stimuli, respectively, that are linked to individual anxiety compared to stimuli with mere biological prepotency. The shift of attention, initiated by the resource allocation mechanism, to the negative or feared stimulus is followed by a delay in disengaging attention from that stimulus, but presumably only in phobic anxiety. Attention to a specific stimulus is synonymous with encoding it into working memory (e.g., Schneider, 1999). Therefore, attention and memory components are depicted as intersecting within the proposed model. Like Williams et al. (1997), the presented model suggests the differentiation between perceptual and conceptual encoding. A differentiation between explicit and implicit memory is no longer provided within this model, as previous studies have shown that the distinction between perceptual vs. conceptual encoding is more suitable for prediction of memory biases (e.g., Russo et al., 2001). The assumption that biased memory only occurs in implicit memory tasks (Williams et al., 1997) seems obsolete. More recent studies suggest that when materials are processed perceptually or shallowly, that is, ”at an incidental level” (Fox & Georgiou, 2004), biased explicit recall can reliably be measured (e.g., Russo et al., 2001; Wilhelm et al., 1996). However, in addition, the presented working model classifies several memory stores, a short-term working memory and a longer-lasting memory storage. As indicated, the presented model is a first proposal to more finely consider several aspects of attention and memory. The combinations of the two suggested memory-related classifications of perceptual vs. conceptual encoding on the one hand and short-term vs. longer-term storage on the other hand result in four possible types of memory biases: perceptual vs. conceptual short-term or working memory biases, and perceptual vs. conceptual longer-term memory biases. The shaded modules depicting biases of attentional engagement, attentional disengagement, and perceptual-visual working memory were addressed and empirically supported within this thesis. While the two types of attentional biases were already confirmed in earlier research (for reviews, see Fox & Georgiou, 2004; Mathews & MacLeod, 2005), the existence of VWM biases was for the first time supported within this dissertation. The unshaded modules depict research topics that were addressed in previous studies, but not within this thesis. Concerning these memory modules, evidence is very incoherent (for a review, see MacLeod & Mackintosh, 2004). Future research is necessary to shed more light on the preconditions for the inconsistencies within these three memory modules. The working model presented here is an initial suggestion for a cognitive model of anxiety extended by the aspects that were determined to be relevant throughout this work. Currently,
VIII. GENERAL DISCUSSION
182
it is clearly not able to integrate all available data on cognitive biases in anxiety. Nevertheless, it provides a depiction of a first research step in determining the interface within the information processing path where anxiety-related stimulus-orientation passes into avoidance. Future research has to clarify whether there is merely a horizontal interface within the model, separating perceptual and conceptual encoding, or whether there is also a vertical one defined by the storage duration. Thus, the model is an invitation for further research in defining exactly this point and, thus, refining the theoretical predictions. Possibly, further research will suggest an even more detailed differentiation of memory aspects or the inclusion of further factors relevant for the prediction of memory biases. However, the presented work indicates clear relevance of the shadded boxes, that is, VWM biases and attentional biases concerning engagement and disengagement, at least in specific anxiety. Whether the same will be true for other anxiety disorders requires further investigation.
Clinical Implications Although cognitive models of anxiety (e.g., Mathews & Mackintosh, 1998; Wells & Matthews, 1994; Williams et al., 1997) differ to some extent remarkably from each other concerning their specific postulations, they agree on the assumption that disorder-specific cognitive distortions play a causal role in emotional vulnerability. Therefore, a precise identification of the characteristics of these distortions of information-processing in a specific mental disorder might be particularly relevant for the theoretical overall conceptualization of the development of anxiety disorders, diagnostics including the measurement of therapeutic success and the prediction of risk of relapse. Papers 1 and 2 of this work reporting the application of a sequential cueing paradigm as well as Paper 4 describing a change detection paradigm confirmed that the detection and VWM storage of threat-relevant stimuli occurs very quick and reflexively in fearfuls. In addition, Paper 3 particularly indicated intervention-induced malleability of these highly automatic VWM biases, reflected in a reduction of the VWM advantage for uncued spiders after therapy. Interestingly, this advantage seemed to have returned to its initial value at follow-up. These results indicate that these automatic processing aspects might be a key to determining experimental parameters that might objectively measure symptom status, effects of intervention and future relapse in symptoms. However, the main aim of the work at hand was to investigate fundamentally the existence and nature of VWM biases in specific anxiety. This is only a first step on a long way to clinical application. Therefore, conclusions concerning the reliability of the VWM advantage for uncued threat images as a predictor of relapse can currently be made only very speculatively.
VIII. GENERAL DISCUSSION
183
Although Paper 3 indicated malleability of disorder-specific VWM biases through therapy, it is still not satisfactorily clarified whether these biases are causal factors in the development of specific fears or whether they are mere epiphenomena. The postulation that cognitive biases cause mental disorders implies that these biases should be modifiable in the treatment of the disorder. But still, pre-post-treatment investigations addressing participants featuring both, an anxiety disorder diagnosis and cognitive distortions characteristically for this disorder, do not allow conclusive predictions whether cognitive biases precede or merely accompany an anxiety disorder. Concerning both onset and maintenance of anxiety disorders, prospective studies assessing both cognitive characteristics and the development of an anxiety disorder over the course of time are required to conclusively clarify whether cognitive distortions play a causal or an epiphenomenal role in the etiology of anxiety disorders. Initial longitudinal studies – mostly addressing depressive disorders - are promising. There is evidence that a tendency to selectively interpret ambiguous information as negative predicts later dysphoric response to stress (Pury, 2002). Moreover, a tendency to produce negative sentences as reaction to a neutral cue word is a reliable predictor of fulfilling the criteria for a major depression diagnosis three years later (Rude, Vladez, Odom, & Ebrahimi, 2003). Concerning anxiety disorders, it has been indicated that anxiety sensitivity measures are capable of predicting a future onset of panic attacks (Ehlers 1995; Schmidt, Lerew, & Jackson, 1999).
Discussion and Limitations of Empirical Findings and Future Research Finally, some constraints concerning the explanatory power of the presented results require consideration. As more specific limitations concerning methods and interpretability are provided within the individual papers described, this section reflects more general topics of discussion and highlights possible sources of future research projects. Do Group Differences Reflect Response Biases instead of VWM Biases? An alternative explanation of the reported group differences interpreted as disorder-specific working memory biases might be that spider fearfuls rather produced a response bias. For instance, the extensive screening procedure for spider anxiety might have primed insights into the study aims and prompted ”compliant” behavior by fearfuls. However, in Paper 1, this alternative possibility was explicitly tested. Originally it was intended to determine the spider signal detection parameters d’ and ß, which was not possible, as false alarm rates were very low and even at zero for one third of participants. An informal inspection of the hits and false alarm rates rejects biased response as an alternative explanation for the group effects. On average, spider fearfuls exhibited similar false alarm rates as non-anxious
VIII. GENERAL DISCUSSION
184
controls, although their hit rate was significantly higher. Compatibility with Studies Suggesting Anxiety-Induced WM-Impairment In their processing efficiency theory, Eysenck and Calvo (1992) put forward the premise that chronically heightened levels of stress and anxiety might be associated with lower levels of working memory capacity. Indeed, empirical research confirms these postulations, as people with heightened trait-anxiety or more life stress perform worse in tasks measuring working memory capacity (e.g., Ashcraft & Kirk, 2001; Derakshan & Eysenck, 1998; Klein & Boals, 2001). Moreover, increased state anxiety seems to be related to lower working memory performance (e.g., Lavric, Rippon, & Gray, 2003; Schmader & Johns, 2003). How are these results in line with the results presented throughout this dissertation, suggesting enhanced working memory performance in fearfuls? Most importantly, all studies reporting impaired performance measure working memory for neutral materials. In these methodological designs, general working memory capacity is measured instead of memory for specific materials compared to others. That is, research suggesting impaired working memory addresses the distraction effects of anxiety. Although the authors ascribe their findings of reduced working memory capacity to stress- or anxietyrelated thoughts or objects consuming working memory capacity, the experimental designs do not allow for explicitly determining the preferential allocation of cognitive resources to the threatening objects or stress-related thoughts. In a strict sense, both strings of research, the one presented within this dissertation and the one assuming working memory capacity impairments at the presence of anxiety, emanate from very similar conceptualizations. Both postulate that cognitive resources, such as working memory capacity, are prioritized according to threat. This is related to costs concerning performance for non-threatening materials, as determined in lower performance in a neutral task or lower memory accuracy for the item following a threatening image in the task presented within this work in Papers 1 to 3. One might ask why the experiments presented in this work do not reveal stronger distraction effects for cued items in the presence of an uncued spider image. More relevantly, the fearful participants tested here were no more anxious in general than the control group; their anxiety was focused on one very specific threat. In contrast to participants with heightened trait-anxiety (Derakshan & Eysenck, 1998), chronic stress (Klein & Boals, 2001) or currently increased anxious arousal due to awaiting an electrical shock (Lavric et al., 2003), there was only one picture of their feared object instead of lots of negative thoughts or the expectation of pain. However, further research might combine both methodological conceptualizations and investigate visual working memory with the tasks introduced in this dissertation in either the presence or the absence of an external threat stimulus. It would be worthwhile to investigate whether the presence of a real spider in the experimental laboratory would have
VIII. GENERAL DISCUSSION
185
an influence on the results presented afore. Does additional state anxiety increase the threatpreference effect as suggested for attentional biases (e.g., MacLeod & Rutherford, 1992)? Would it lead to a general relocation of working memory resources away from the task? Or would we observe reduced memory for the threatening picture, implying its avoidance on the condition of symptom activation? Analogue Samples vs. Clinical Patients In the experiments reported above, mainly analogue participant samples were assessed, although spider fearfuls fulfilled relevant diagnostic criteria, they were not ”real” patients seeking treatment. Previous research suggests that it might be relevant whether treatment seekers vs. analogue participants are involved in the investigation. For instance, signal detection biases are only determined with treatment seekers (e.g., Litz, Weathers, Monaco, Herman, Wolfsohn, Marx, & Keane, 1986; Pérez-López & Woody, 2001), but not in participants merely fulfilling the diagnosis (e.g., Sawchuk et al., 2002). However, it seems that the inclusion of real patients merely causes intensified bias effects. As the tasks in this work determined effects with an analogue group of participants, the limitation of having tested analogue participants instead of treatment seekers seems relatively peripheral. Moreover, the investigation of clinical patients would involve problems of pronounced comorbidity of anxiety disorders with depressive disorders (e.g., Kessler, Nelson, McGonagle, Liu, Swartz, & Blazer, 1996). As cognitive biases in depression are in part contrary to those occuring in anxiety disorders, results interpretability would have suffered. Nevertheless, it would be worthwhile to repeat the Attentional Blink task presented in Paper 5 with treatment seeking spider fearfuls without any comorbid depressive disorders to determine whether group differences would be more pronounced. Psychophysical Uniqueness instead of Evolutionary Relevance? Above, it was suggested that the enhancement effects observed for spider images or snake picture even when these were not feared might be attributable to the evolutionary meaning of these stimuli and an ancient survival relevance for quickly detecting such stimuli. An alternative explanation is related to psychophysical features of these stimuli. Both pictures are, compared to most other images presented during the experiments, particularly salient due to their dark color, specific shape and their depiction as animals. As presented in detail in Paper 1, this explanation was tested for the spider image. The hit rate for spider images was compared to the hit rate for butterfly images, which were similarly dark and characterisitic in shape. Moreover, it also depicted an animal, but one without any evolutionary relevance. The analysis indicated a significant greater hit rate for spiders, disclaiming mere psychophysical salience as causal for the results observed in both groups for spiders. However, it may also be that other salient visual features of the images, for instance the shape or more subtle
VIII. GENERAL DISCUSSION
186
characteristics, might have contributed to the effects. Although it is difficult to exclude all alternative explanations, as snakes and spiders necessarily look different from other animals and objects, it should be possible to control for the most salient features, as for instance shape, in future research. The Problem of Experimental Frequency Manipulation In the task presented in Papers 1 to 3, an adaptation of the sequential cueing paradigm of Wolfe et al. (2006), and the task presented in Paper 4, adapted in accordance to Luck and Vogel (1997), the critical spider item (and snake image, respectively) is most often the core of a probe or a change compared to all of the non-critical items. That is, in the first task it would be adaptive to respond with the spider response as often as possible, and in the second task it would be a good strategy to concentrate on the spider image within the study display and monitor whether changes occur or not. It might even be that participants somehow manage to process the critical images more efficient during the session due to their frequent occurence. As both tasks revealed significant group differences, that is, greater report probability or change detection concerning the spider image in the fearfuls group, we are not given reason to doubt the existence of disorder-specific VWM biases measured with these tasks. However, it remains possible that the memory preference effects found in both groups for spiders and snakes even when these are not feared actually trace back to such a frequency saliency instead of evolutionary relevance. To test this alternative explanation, the same tasks could be re-run with a positive, evolutionary irrelevant stimulus as the critical item. The remaining stimuli should be neutral in valence to ensure that the critical stimulus is outstanding in terms of valence as in the experiments presented throughout this work. Thus, the positive critical stimulus would occupy the same frequency saliency as the spider image and the snake picture tested before. However, if the positive target is not preferrentially stored in VWM, the hypothesis of frequency salience as an alternative explanation for the prioritized storage of negative pictures would be eliminated. Still, the possibility remains that observers would preferrably store all kind of negative materials, even those without any evolutionary importance. Therefore, tasks might be repeated with a negative image, depicting a modern threat, as for instance a grenade or a weapon. If these items are not at all preferably memorized, the assumption of evolutionary relevance as being relevant for the enhancement effects observed in both groups would be supported. The Composition of VWM Items – Whole Objects vs. Single Features In the literature on visual working memory, the structure of the storage contents is still controversial. Do the four supposed storage slots hold bound, integrated objects (e.g.,
VIII. GENERAL DISCUSSION
187
Ceraso, 1985) or simple features like color and shape (e.g., Heathcote, Walker, & Hitch, 1994)? On the one hand, there is evidence for an object-based deployment of attention, suggesting that attending to one feature of an item allows access to all features of that object (Duncan, 1984). Moreover, Vogel, Woodman, and Luck (2001) compared performances in change-detection tasks as described at the beginning of this dissertation for dots consisting of one color vs. dots consisting of two colors. In light of the same accuracy values seen for displays arranged by single-colored items versus bi-colored conjunctions, the authors concluded that the ”capacity of the visual working memory must be understood in terms of integrated objects rather than individual features” (p.92). In addition, Wolfe et al. (2006) reported similar visual working memory performance for simple colored squares vs. real objects, also suggesting that VWM consists of bound objects. On the other hand, there is data that suggests that VWM is arranged by parallel, independent feature stores with dimension-specific, limited capacity (e.g., Magnussen, Greenlee, & Thomas, 1996). For instance, Wheeler and Treisman (2002) failed to replicate the results of Vogel et al. (2001), using the same method. Here, change-detection accuracy was lower for displays arranged by bi-colored dots vs. displays consisting of single-colored items. The authors concluded that VWM consists of parallel feature stores (e.g., one for color, one for shape, etc.), and that each of these has a size of about 4. This means that VWM might store four types of shapes in different colors, but only approximately two bi-colored forms. Moreover, the authors postulate an additional resource-limited mechanism for binding the information stored in the independent feature-stores. So far, the discussion regarding units of VWM is not conclusively finished. However, the work at hand was not designed to clarify whether the units of VWM are bound objects or single features. Instead, accuracy differences between anxious and non-anxious individuals were the main interest, which were tested in order to shed light on the question whether anxiety is associated with distorted VWM in the presence of threat.
Final Conclusions The aim of this dissertation was to investigate an unexplored portion of the informationprocessing string in specific anxiety, visual working memory. Cognitive theories of anxiety and clinical-experimental research on disorder-specific biases have both extensively addressed biased attention and biased memory. Although the monitoring of threat stimuli, even without permament or fixed attention, seems disorder-relevant in several anxiety disorders, the exploration of visual working memory in its role in anxiety remained completely uninvestigated. This dissertation sheds light on that gap by addressing the important question: Is specific anxiety related to biased visual working memory?
VIII. GENERAL DISCUSSION
188
The results presented throughout this work support the idea that specific anxiety is associated with enhanced visual working memory for threatening objects. Data indicate that disorder-specific distortions of VWM are particularly pronounced when numeruous stimuli are either spatially or temporally competing for processing resources. This suggests a highly automatic selection of threatening items for short-term storage. Moreover, these fear-related VWM biases proved to be modifiable through therapeutic treatment. Therefore, this research provides important additional information about informationprocessing distortions related to specific anxiety. With the experimental investigation of biased visual working memory, initial work has been performed to fill a gap in research on cognitive biases in anxiety. Moreover, this dissertation contributes to cognitive models of anxiety by proposing several recommendations for refinement of current theoretical approaches. Most important, suggestions are made to extend existing models by a more detailed consideration of attention and memory. In view of numerous prior studies on the topic and the conclusions of this dissertation, a differentiation of the attentional engagement and disengagement components appears inevitable. Even more importantly, in view of the presented data, predictions concerning visual working memory for threatening materials need to be taken into account. In addition, suggestions are provided for the differential consideration of biases occuring from prepotent threat value of negative stimuli vs. individual phobic threat value. A draft of a cognitive model of anxiety extended by each of these aspects is provided to serve as an invitation for further steps in the investigation of the nature of memory biases in anxiety disorders.
IX. References
Agras, S., Sylvester, D., Oliveau, D. (1969). The epidemiology of common fears and phobia. Comprehensive Psychiatry, 10, 151-156. American Psychiatric Association (1980). Diagnostic and statistical manual of mental disorders (3th ed.). Washington, D.C.: American Psychiatric Association. American Psychiatric Association (1994). Diagnostic and statistical manual of mental disorders (4th ed.). Washington, D.C.: American Psychiatric Association. Amir, N., Coles, M.E., Brigidi, B., & Foa, E.B. (2001). The effect of practice on recall of emotional information in individuals with generalized social phobia. Journal of Abnormal Psychology, 110, 76-82. Amir, N., Foa, E.B., & Coles, M.E. (1998). Automatic activation and strategic avoidance of threat-related information in social phobia. Journal of Abnormal Psychology, 107, 285-290. Amir, N., Foa, E.B., & Coles, M.E. (2000). Implicit memory bias for threat-relevant information in individuals with generalized social phobia. Journal of Abnormal Psychology, 109, 713-720. Amir, N., McNally, R.J., Riemann, B.C., & Clement, C. (1996). Implicit memory bias for threat in panic disorder: Application of the ”white noise” paradigm. Behaviour Research and Therapy, 34, 157-162. Amir, N., McNally,R.J., & Wiegartz, P.S. (1996). Implicit memory bias for threat in posttraumatic stress disorder. Cognitive Therapy and Research, 20, 625-635. Anderson, A.K. (2005). Affective influences on the attentional dynamics supporting awareness. Journal of Experimental Psychology: General, 134, 258-281. Anderson, A. K., & Phelps, E. A. (2001). Lesions of the human amygdala impair enhanced perception of emotionally salient events. Nature, 411, 305-309. Andlin-Sobocki, P., & Wittchen, H.-U. (2005). Cost of anxiety disorders in Europe. European Journal of Neurology, 12, 39-44.
189
IX. REFERENCES
190
Arend, I., & Botella, J. (2002). Emotional stimuli reduce the attentional blink in sub-clinical anxious subjects. Psicothema, 14(2), 209-214. Armfield, J. (2006). Cognitive vulnerability: A model of the etiology of fear. Clinical Psychology Review, 26, 746-768. Armfield, J.M., & Mattiske, J.K. (1996). Vulnerability representation: The role of perceived dangerousness, uncontrollability, unpredictability and disgustingness in spider fear. Behaviour Research and Therapy, 34, 899-909. Ashcraft, M.H., & Kirk, E.P. (2001). The relationship among working memory, math anxiety, and performance. Journal of Experimental Psychology: General, 130, 224-237. Atkinson, R.C., & Shiffrin, R.M. (1968). Human memory: A proposed system and its control processes. In K.W. Spence (Ed.), The psychology of learning and motivation: Advances in research and theory (Vol. 2, pp. 89- 195). New York: Academic Press. Atkinson, R.C., & Shiffrin, R.M. (1971). The control of short- term memory. Scientific American, 225, 82- 90. Baddeley, A.D. (1986). Working memory. Oxford: Oxford University Press. Baddeley, A. D. (1992). Is working memory working? The fifteenth Bartlett lecture. Quarterly Journal of Educational Psychology, 44A(1), 1-31. Baddeley, A.D. (2000). The episodic buffer: A new component of working memory? Trends in Cognitive Sciences, 4, 417-423. Baddeley, A.D., & Hitch, G.J. (1974). Working memory. In G.H. Bower (Ed.), The psychology of learning and motivation (Vol. 8, pp. 47- 90). New York: Academic Press. Baddeley, A.D., & Logie, R.H. (1999). Working memory: The multiple-component model. In A. Miyake & P. Shah (eds.), Models of working memory. New York: Cambridge University Press. Baddeley, A.D., & Warrington, E.K. (1970). Amnesia and the distinction between long-term and short-term memory. Journal of Verbal Learning and Verbal Behavior, 9, 176- 189. Bandura, A. (1977). Self-efficacy: Towards a unifiying theory of behavior change. Psychological Review, 84, 191-215. Barker, K., & Robertson, N. (1997). Selective processing and fear of spiders: use of the Stroop task to assess interference for spider-related, movement, and disgust information. Cognition and Emotion, 11, 331-336.
IX. REFERENCES
191
Barlow, D.H. (1988). Anxiety and its disorders: the nature and treatment of anxiety and panic. New York: The Guilford Press. Baylis, G.C., & Driver, J. (1995a). One- sided edge assignment in vision: 1. Figure–ground segmentation and attention objects. Current Directions in Psychological Science, 4(5), 140- 146. Baylis, G.C., & Driver, J. (1995b). One- sided edge assignment in vision: 2. Part decomposition, shape discrimination, and attention to objects. Current Directions in Psychological Science, 4(6), 201- 206. Beck, A.T., & Clark, D.A. (1997). An information processing model of anxiety: Automatic and stratgic processes. Behaviour Research and Therapy, 35, 49-58. Beck, A.T., & Emery, G. (with Greenberg, R.) (1985). Anxiety disorders and phobias: A cognitive perspective. New York: Basic Books. Beck, A.T., & Steer, R.A. (1987). Manual for the revised Beck Depression Inventory. San Antonio, TX: The Psychological Corporation. Becker, E. S., & Rinck, M. (2004). Sensitivity and response bias in fear of spiders. Cognition and Emotion, 7, 961-976. Becker, E.S., Rinck, M., & Margraf, J. (1999). Memory bias on panic disorder. Journal of Abnormal Psychology, 103, 396-399. Becker, E.S., Roth, W.T., Andrich, M., & Margraf, J. (1999). Explicit memory in anxiety disorders. Journal of Abnormal Psychology, 108, 153-163. Becker, E.S., Tuerke, V., Neumer, S., Soeder, U., Krause, P., & Margraf J. (2000). Incidence and prevalence rates of mental disorders in a community sample of young women: Results of the ”Dresden Study”. In: R. Manz & W. Kirch (Ed.), Public Health Research and Practice: Report of the Public Health Research Association Saxony, Vol. II. (pp. 259-291). Regensburg: S. Roederer Verlag. Bland, R.C., Newman, S.C., & Orn, H. (1988). Period of prevalence of psychiatric disorders in Edmonton. Acta Psychiatrica Scandinavica, 77, 33-42. Borden, J.W. (1992). Behavioral treatment of simple phobia. In S.M. Turner, K.S. Calhoun & H.E. Adams (eds.), Handbook of clinical behavior therapy (2nd Ed.). New York: Wiley. Bourdon, K.H., Boyd, J.H., Rae, D.S., Burns, B.J., Thompson, J.W., & Locke, B.Z. (1988). Gender differences in phobias: results of the ECA community survey. Journal of Anxiety Disorders, 2, 227-241.
IX. REFERENCES
192
Bower, G.H. (1981). Mood and memory. American Psychologist, 36, 129-148. Bower, G.H. (1987). Commentary on mood and memory. Behaviour Research and Therapy, 25, 443-456. Bowers, D., Bauer, R.M., Coslett, H.B., & Heilman, K.M. (1985). Processing of faces by patients with unilateral hemisphere lesions: Dissociations between judgements of facial affect and facial identity. Brain and Cognition, 4, 258-272. Boyd, J. H., Rae, D. S., Thompson, J.W., Burns, B. J., Bourdon, K., Locke, B. Z. & Regier, D. A. (1990). Phobia: prevalence and risk factors. Social Psychiatry and Psychiatric Epidemiology, 25, 314-323. Bradley, B.P., Mogg, K., & Williams, R. (1995). Implicit and explicit memory for emotioncongruent information in clinical depression and anxiety. Behaviour Research and Therapy, 33, 755-770. Brainard, D. H. (1997). The Psychophysics Toolbox. Spatial Vision, 10(4), 443-446. Broadbent, D. (1958). The role of auditory localization in attention and memory span. Journal of Experimental Psychology, 47, 191-196. Broadbent, D.E., & Broadbent, M.H.P. (1987). From detection to identification: Response to multiple targets in rapid serial visual presentation. Perception & Psychophysics, 42, 105-113. Bundesen, C. (1990). A theory of visual attention. Psychological Review, 97, 523-547. Bundesen, C. (1998). A computational theory of visual attention. Philosophical Transactions of the Royal Society of London, Series B, 353, 1271-1281. Buttle, H., & Raymond, J.E, (2003). High familiarity enhances visual change detection for face stimuli. Perception & Psychophysics, 65(8), 1296-1306. Byrne, A., & Eysenck, M. W. (1995). Trait anxiety, anxious mood, and threat detection. Cognition and Emotion, 9, 549-562. Calvo, M.G., Eysenck, M.W., & Castillo, D.M. (1997). Interpretation bias in test anxiety: The timecourse of predictive interferences. Cognition and Emotion, 11, 43-63. Carretie L., Mercado, F., Hinojosa, J.A., Martin-Loeches, M., & Sotillo,M. (2004). Valencerelated vigilance biases in anxiety studied through event-related potentials. Journal of Affective Disorders, 78, 119-130.
IX. REFERENCES
193
Cave, K. R., & Batty, M. J. (2006). From searching for features to searching for threat: Drawing the boundary between preattentive and attentive vision. Visual Cognition, 14(4-8), 629-647. Ceraso, J. (1985). Unit formation in perception and memory. Psychology of Learning and Motivation: Advances in Research and Theory, 19, 179- 210. Chambless, D.L., Caputo, G.C., Bright, P., Gallagher, R. (1984). Assessment of fear of fear in agoraphobics: The Body Sensations Questionnaire and the Agoraphobic Cognitions Questionnaire. Journal of Consulting and Clinical Psychology, 52, 1090-1097. Chambless, D.L., & Gillis, M.M. (1993). Cognitive therapy of anxiety disorders. Journal of Consulting and Clinical Psychology, 61, 248-260. Chun, M.M. (1997). Types and tokens in visual processing: A double dissociation between the attentional blink and repetition blindness. Journal of Experimental Psychology: Human Perception and Performance, 23, 738-755. Chun, M.M., & Potter, M.C. (1995). A two-stage model for multiple target detection in rapid serial visual presentation. Journal of Experimental Psychology: Human Perception and Performance, 21, 109-127. Clark, D.M. (1997). Panic disorder and social phobia. In D. Clark and C. Fairburn (eds.), Science and practice of cognitive behaviour therapy. Oxford: Oxford University Press. Clark, D.M. & Wells, A. (1995). A cognitive model of social phobia. In R.G. Heimberg, M.R. Liebowitz, D.A. Hope & F.R. Schneider (eds.), Social phobia: Diagnosis, assessment and treatment. New York: Guilford Press. Cloitre, M., Cancienne, J., Heimberg, R.G., Holt, C.S., & Liebowitz, M.R. (1995). Case histories and shorter communications: Memory bias does not generalize across anxiety disorders. Behaviour Research and Therapy, 33, 305-307. Cohen, J. (1988). Statistical power analysis for the behavioral sciences. Hillsdale, NJ: Erlbaum. Coles, M. E., & Heimberg, R. G. (2002). Memory biases in the anxiety disorders: Current status. Clinical Psychology Review, 22, 587-627. Constans, J.I., Foa, E.B., Franklin, M.E., & Mathews, A. (1995). Memory for actual and imagined events in OC checkers. Behaviour Research and Therapy, 33, 665-671. Constantine, R., McNally, R.J., Hornig, C.D. (2001). Snake fear and the pictorial emotional stroop paradigm. Cognitive Therapy and Research, 25, 757-764.
IX. REFERENCES
194
Cook, E., Hodes, R., & Lang, P.J. (1986). Preparedness and phobia: Effects of stimulus content on human visceral conditioning. (unpublished manuscript). Cook, M., & Mineka, S. (1991). Selective associations in the origins of phobic fears and their implications for behavior therapy. In P. Martin (ed.): Handbook of behavior therapy and psychological science: An integrative approach (pp. 413-434). Oxford, UK: Pergamon Press. Cowan, N. (1995). Attention and Memory. An integrated framework. New York: Oxford University Press. Cowan, N. (2001). The magical number 4 in short-term memory: A reconsideration of mental storage capaciry. Behavioral and Brain Sciences, 24, 87-185. Craik, F. & Lockhart, R. (1972). Levels of processing: A framework for memory research. Journal of Verbal Learning & Verbal Behavior, 11, 671-684 Craske, M.G., Barlow, D.H., Clark, D.M., Curtis, G.C., Hill, E.M., Himle, J.A., Lee, Y.J., Lewis, J.A., McNally, R.J., Oest, L.G., Salkovskis, P.M., & Warwick, H.M.C. (1996). Specific (simple) phobia. In T.A. Widiger, A.J. Frances, H.A. Pincus, M.R. Ross, M.B. First, & W.W. Davis (eds.), DSM-IV Source Book, Vol.2. Washington: APA. Craske, M. & Rowe, M. (1997). A comparison of cognitive and behavioral treatment of phobias. In G. Davey (Ed.), Phobias: Description, Treatment, and Theory. Wiley Series on Clinical Psychology. New York: Wiley. Craske, M.G., Sanderson, W.C., & Barlow, D.H. (1987). The relationships among panic, fear, and avoidance. Journal of Anxiety Disorders,1, 153-160. Craske, M.G., & Sipsas, A. (1992). Animal phobias versus claustrophobias: Exteroceptive versus interoceptive cues. Behaviour Research and Therapy, 30, 569-581. Curtis, G.C., Magee, W.J., Eaton, W.W., Wittchen, H.-U., & Kessler, R.C. (1998). Specific fears and phobias. Epidemiology and classification. British Journal of Psychiatry, 173, 212-217. Darwin, C. (1877). A biographical sketch of an infant. Mind, 2, 285-294. Davidson, R.J. (1992). Emotion and affective style: Hemispheric substrates. Psychological Science, 3, 39-43. De Houwer, J. (2003). The Extrinsic Affective Simon Task. Experimental Psychology, 50, 77-85.
IX. REFERENCES
195
de Jong, P.J., & Martens, S. (in press). Detection of emotional expressions in rapidly changing facial displays in high- and low-socially anxious women. Behaviour Research and Therapy. de Jong, P.J., & Merckelbach, H. (1998). Blood-injection-injury phobia and fear of spiders: domain specific individual differences in disgust sensitivity. Personality and Individual Differences, 24, 153-158. de Jong, P.J., Peters, M., & Vanderhallen, I. (2002). Disgust and disgust sensitivity in spider phobia: Facial EMG in response to spider and oral disgust imagery. Journal of Anxiety Disorders, 16, 477-493. Derakshan, N., & Eysenck, M.W. (1998). Working memory capacity in high trait-anxious and repressor groups. Cognition and Emotion, 12, 697-713. Derryberry, D., & Reed, M.A. (2002). Anxiety-related attentional biases and their regulation by attentional control. Journal of Abnormal Psychology, 111, 225-236. DeSilva, P., Rachman, S.J., & Seligman, M.E.P. (1977). Prepared phobias and obsessions: Therapeutic outcome. Behaviour Research and Therapy, 15, 65-77. Dilling, H., Mombour, W., & Schmidt, M.H. (2004). Internationale Klassifikation psychischer Stoerungen. ICD-10 Kapitel V (F). Klinisch-diagnostische Leitlinien. Bern: Huber. DiNardo, P. A., Brown, T. A., & Barlow, D. H. (1994). Anxiety Disorders Interview Schedule for DSM-IV: Lifetime Version (ADIS-IV-L). Albany, NY: Graywind Publications. Duncan, J. (1984). Selective attention and the organization of visual information. Journal of Experimental Psychology: General, 113, 501- 517. Edwards, S., & Salkovskis, P.M. (2006). An experimental demonstration that fear, but not disgust, is associated with return of fear in phobias. Journal of Anxiety Disorders, 20, 58-71. Ehlers, A. (1995). A 1-year prospective study of panic attacks: clinical course and factors associated with maintenance. Journal of Abnormal Psychology, 104, 164-172. Ehlers, A., Margraf, J., & Chambless, D.L. (1993). Fragebogen zu koerperbezogenen Aengsten, Kognitionen und Vermeidung (AKV). Weinheim: Beltz. Ehlers, A., Margraf, J., Davies, S., & Roth, W.T. (1988). Selective processing of threat cues in subjects with panic attacks. Cognition & Emotion, 2, 101-220.
IX. REFERENCES
196
Ellwart, T., Becker, E.S. & Rinck, M. (2005). Activation and measurement of threat associations in fear of spiders: An application of the Extrinsic Affective Simon Task. Journal of Behavior Therapy and Experimental Psychiatry, 36, 281-299. Ellwart, T., Rinck, M., & Becker, E. (2006). From fear to love: Implicit and explicit associations towards spiders. Emotion, 6, 18-27. ESEMeD/ MHEDEA 2000 Investigators (2004). Prevalence of mental disorders in Europe: results from the European study of the epidemiology of mental disorders (ESEMeD) project. Acta Psychiatrica Scandinavica, 109, 21-27. Essau, C.A. (1999). Angst und Depression bei Jugendlichen: Habilitationsschrift [Anxiety and depression in adolescents]. Postdoctoral dissertation, Universitaet Bremen, Bremen, Germany. Essau, C.A. (2003). Comorbidity of anxiety disorders in adolescents. Depression and Anxiety, 18, 1-6. Essau, C.A., Conradt, J., & Petermann, F. (2000). Frequency, comorbidity, and psychosocial impairment of specific phobia in adolescents. Journal of Clinical Psychology, 29, 221231. Eysenck, M.W. (1982). Springer.
Attention and arousal: Cognition and performance.
Berlin:
Eysenck, M. (1992). Anxiety: the cognitive perspective. Hove, England: Erlbaum. Eysenck, M.W., & Calvo, M.G. (1992). Anxiety and performance: The processing efficiency theory, Cognition & Emotion, 6, 409-434. Foa, E.B., Amir, N., Gershuny, B., Molnar, C., & Kozak, M.J. (1997). Implicit and explicit memory in obsessive-compulsive disorder. Journal of Anxiety Disordrs, 11, 119-129. Foa, E.B., Ilai, D., McCarthy, P.R., Shoyer, B., & Murdock, T. (1993). Information processing in obsessive-compulsive disorder. Cognitive Therapy and Research, 17, 173-189. Foa, E.B., & Kozak, M.J. (1986). Emotional processing of fear: exposure to corrective information. Psychological Bulletin, 99, 20-35. Fox, E. (1993). Attentional bias in anxiety: Selective or not? Behaviour Research and Therapy, 31, 487-493. Fox, E. & Georgiou, G.A. (2004). The nature of attentional bias in human anxiety. In Engle, Sedek, Hecker, & Macintosh (eds), Cognitive Limitations in Aging and Psychopathology. Cambridge: Cambridge University Press.
IX. REFERENCES
197
Fox, E., Russo, R., Bowles, R.J., & Dutton, K. (2001). Do threatening stimuli draw or hold visual attention in sub-clinical anxiety? Journal of Experimental Psychology: General, 130, 681-700. Fox, E., Russo, R., & Dutton, K. (2002). Attentional bias for threat: Evidence for delayed disengagement from emotional faces. Cognition and Emotion, 16, 355-379. Fox, E., Russo, R., & Georgiou, G.A. (2005). Anxiety modulates the degree of attentive resources required to process emotional faces. Cognitive, Affective, & Behavioral Neuroscience, 5, 396-404. Franklin, M.E., Huppert, J., Langner, R., Leiberg, S., & Foa, E.B. (2005). Interpretation bias: A comparison of treated social phobics, untreated social phobics and controls. Cognitive Therapy and Research, 29, 289-300. Fredrikson, M. (1981). Orientating and defensive reactions to feared and conditioned stimuli in phobic and normal subjects. Psychophysiology, 18, 456-465. Fredrikson, M. (1983). Reliability and validity of some specific fear questionnaires. Scandinavian Journal of Psychology, 24, 331-334. Fredrikson, M., Annas, P., Fischer, H., & Wik, G. (1996). Gender and age differences in the prevalence of specific fears and phobias. Behaviour Research and Therapy, 34, 33-39. Fredrikson, M., Wik, G., Greitz, T., Eriksson, L., Stone-Elander, S., Ericson, K., & Sedvall, G. (1993). Regional cerebral blood flow during experimental phobic fear. Psychophysiology, 30, 126-130. Frick, R.W. (1984). Using both an auditory and a visual short–term store to increase digit span. Memory and Cognition, 12, 507- 514. Friedman, B.H., Thayer, J.F., & Borkovec, T.D. (2000). Explicit memory bias for threat words in generalized anxiety disorder. Behavior Therapy, 31, 745-756. Gaab, J., Jucker P., Staub, F., & Ehlert, U. (2005). Mind over matter: Psychobiologische Effekte einer Konfrontationstherapie bei Spinnenangst. Zeitschrift fuer Klinische Psychologie und Psychotherapie, 34(2), 121-132. Geer, J.H. (1964). The development of a scale to measure fear. Behaviour Research and Theory, 3, 45-53. Gelernter, J., Page, G., Bonvicini, K., Woods, S.W., Pauls, D.L., & Kruger, S. (2003). A chromosome 14 risk locus for simple phobia: results from a genomewide linkage scan. Molecular Psychiatry, 8, 71-82.
IX. REFERENCES
198
Georgiou, G.A., Bleakley, C., Hayward, J., Russo, R., Dutton, K., Eltiti, S., & Fox, E. (2005). Focusing on fear: Attentional disengagement from emotional faces. Visual Cognition, 12 (1), 145-158. Gerull, F.C., & Rapee, R.M. (2002). Mother knows best: Effects of maternal modeling on the acquisition of fear and avoidance behaviour in toddlers. Behaviour Research and Therapy, 40, 279-287. Globisch, J., Hamm, A.O., Esteves, F., Oehman, A. (1999). Fear appears fast: Temporal course of startle reflex potentiation in animal fearful subjects. Psychophysiology, 36, 66-75. Graf, P., & Schachter, D.L. (1985). Implicit and explicit memory for new associations in normal and amnesic subjects. Journal of Experimental Psychology: Learning, Memory, and Cognition, 11, 501-518. Gray, J.R. (2001). Emotional modulation of cognitive control: Approach-withdrawal states double-dissociate spatial from verbal two-back task performance. Journal of Experimental Psychology: General, 130, 436-452. Greenwald, A. G., McGhee, D., & Schwartz, J. (1998). Measuring individual differences in implicit cognition: The implicit association test. Journal of Personality and Social Psychology, 74, 1464-1480. Grimes, J. (1996). On the failure to detect changes in scenes across saccades. In K. Akins (Ed.), Perception (pp. 89- 110). New York: Oxford University Press. Guentuerkuen, O. (2000). Evolution der Angst. In G. Lazarus-Mainka & S. Siebeneick (eds), Angst und Aengstlichkeit. Goettingen: Hogrefe. Hamann, S.B., & Squire, L.R. (1996). Level-of-processing effects in word-completion priming: A neuropsychological study. Journal of Experimental Psychology: Learning, Memory, and Cognition, 22, 933-947. Hambleton, R.K. (1994). Guidelines for adapting educational and psychological tests: A progress report. European Journal of Psychological Assessment, 10, 229-244. Hamm, A. (2006). Spezifische Phobien. Goettingen: Hogrefe. Hansen, C. H., & Hansen, R. D. (1988). Finding the face in the crowd: An anger superiority effect. Journal of Personality and Social Psychology, 54, 917-924. Harvey, A.G., Bryant, R.A., & Rapee, R.M. (1996). Preconscious processing of threat in post-traumatic stress disorder. Cognitive Therapy and Research, 20, 613-623.
IX. REFERENCES
199
Hautzinger, M., Bailer, M., Worall & H., Keller, F. (1994). Beck-Depressions-Inventar (BDI). Bearbeitung der deutschen Ausgabe. Testhandbuch. Bern, Goettingen, Toronto, Seattle: Huber. Heathcote, D., Walker, P., & Hitch, G.J. (1994). Feature independence and the recovery of feature conjunctions. Journal of General Psychology, 121, 253- 266. Hellige, J.B. (1993). Hemispheric assymetry. Cambridge, MA: Harvard University Press. Hellstroem, K., & Oest, L.-G. (1996). Prediction of outcome in the treatment of specific phobia. A cross-validation study. Behaviour Research and Therapy, 34, 403-411. Hermans, E.J., & Van Honk, J. (2006). Toward a framework for detective emotion processing in social phobia. Cognitive Neuropsychiatry, 11, 307-331. Hermans, D., Vansteenwegen, D., & Eelen, P. (1999). Eye movement registration as a continuous index of attention deployment: Data from a group of spider anxious students. Cognition and Emotion, 13, 419-434. Hiller, W., Zaudig, M., & Mombour, W. (1997). IDCL - Internationale Diagnosen Checklisten fuer DSM-IV und ICD-10 (Manual, 31 Checklisten nach DSM-IV und ScreeningBlatt). [International diagnosis checklists for DSM-IV and ICD-10]. Goettingen, Germany: Hogrefe. Hintzman, D.L. (1978). The psychology of learning and memory. San Francisco: Freeman. Hollingworth, A., & Henderson, J. M. (2002, May). Sustained insensitivity to incremental scene rotation: A dissociation between explicit change detection and visual memory. Paper presented at the 2nd Annual Meeting of the Vision Sciences Society, Sarasota, FL. Hope, D.A., Rapee, R.M., Heimberg. R.G., & Dombeck, M.J. (1990). Representations of the self in social phobia: Vulnerability to social threat. Cognitive Therapy and Research, 14, 177-189. Horowitz, T.S., & Wolfe, J.M. (1998).Visual search has no memory. Nature, 394, 575- 577. Hughdal, K. & Kaerker, A.-C. (1981). Biological vs. experiental factors in phobic conditioning. Behaviour Research and Therapy, 19, 109-115. Hughdal, K., & Oest, L.-G. (1985). Subjectively rated physiological and cognitive symptoms in six different clinical phobias. Personality and Individual Differences, 6, 175-188. Huijding, J., & de Jong, P. (in press). Beyond fear and disgust: The role of (automatic) contamination-related associations in spider phobia. Journal of Behaviour Therapy and Experimental Psychiatry.
IX. REFERENCES
200
Intraub, H. (1985). Visual dissociation: An illusory conjunction of pictures and forms. Journal of Experimental Psychology: Human Perception and Performance, 11, 431-442. Irwin, D. E. (1991). Information integration across eye movements. Cognitive Psychology, 23, 420-456. Irwin, D.E., & Andrews, R.V. (1996). Integration and accumulation of information across saccadic eye movements. In T. Inui & J.L. Mc Clelland (Eds.), Attention and performance 16 (pp. 125- 155). Cambridge, MA: MIT Press. Irwin, D. E., & Zelinsky, G. J. (2002). Eye movements and scene perception: Memory for things observed. Perception & Psychophysics, 64(6), 882-895. Izard, C.E. (1972). Patterns of emotions: A new analysis of anxiety and depression. London: Academic Press. Jacoby, L.L., & Witherspoon, D. (1982). Remembering without awareness. Canadian Journal of Psychology, 36, 300-324. James, W. (1892). Psychology. Briefer Course. New York: Henry Holt and Company. Janca, A., Robins, L. N., Buchholz, K. K., Eerly, T. S., & Shayka, J. J. (1992). Comparison of Composite International Diagnostic Interview and clinical DSM-III-R criteria checklist diagnosis. Acta Psychiatrica Scandinavica, 85(6), 440-443. Johnson, M.K., & Hirst, W. (1993). MEM: Memory subsystems as processes. In A.F. Collins, S.E. Gathercole, M.A. Conway, & P.E. Morris (eds.), Theories of Memory. Hove: Erlbaum. Jolicoeur, P. (1999). Concurrent response-selection demands modulate the attentional blink. Journal of Experimental Psychology: Human Perception and Performance, 25, 10971113. Jolicoeur, P., & Dell’Acqua, R. (1998). The demonstration of short- term consolidation. Cognitive Psychology, 36, 138- 202. Jolicoeur, P., & Dell’Acqua, R. (2000). Selective influence of second target exposure duration and task load effects in the attentional blink phenomenon. Psychonomic Bulletin and Review, 7, 472-479. Jones, B.T., Jones, B.C., Smith, H., & Copley, N. (2003). A flicker paradigm for inducing change blindness reveals alcohol and cannabis information processing biases in social users. Addiction, 98, 235-244.
IX. REFERENCES
201
Jonides, J. (1981). Voluntary versus automatic control over the mind’s eye’s movement. In J. B. Long & A. D. Baddeley (eds.), Attention and performance IX. Hillsdale, NJ: Erlbaum. Jonides, J, Smith, E.E., Koeppe, R.A., Awh, E., Minoshima, S., & Mintun, M.A. (1993). Spatial working memory in humans as revealed by PET. Nature, 363, 623- 625. Kahnemann, D., & Treisman, A. (1984). Changing views of attention and automaticity. In R. Parasuraman & D.R. Davies (eds.), Varieties of Attention, Orlando, FL: Academic Press. Kahnemann, D., Treisman, A., & Burkell, J. (1983). The cost of visual filtering. Journal of Experimental Psychology: Human Perception and Performance, 9, 510-522. Kanwisher, N.G. (1987). Repetition blindness: Type recognition without token individuation. Cognition, 27, 117-143. Keil, A., & Ihssen, N. (2004). Identification facilitation for emotionally arousing verbs during the attentional blink. Emotion, 4(1), 23-35. Kendler, K.S., Neale, M.C., Kessler, R.C., Heath, A.C., & Eaves, L.J. (1992). The genetic epidemiology of phobias in women. Archives of General Psychiatry, 49, 273-281. Kensinger, E. A., & Corkin, S. (2003). Effect of negative emotional content on working memory and long-term memory. Emotion, 3, 378-393. Kessler, R.C., McGonagle, K.A., Zhao, S., Nelson, C.B., Hughes, M., Eshleman, S., Wittchen, H.-U., & Kendler, K.S. (1994). Lifetime and 12-month prevalence of DSMIII-R psychiatric disorders among persons aged 15-54 in the United States: Results from the National Comorbidity Survey. Archives of General Psychiatry, 51, 8-19. Kessler, R.C., Nelson, C.B., McGonagle, K.A., Liu, J., Swartz, M., & Blazer, D.G. (1996). Comorbidity of DSM-III-R major depressive disorder in the general population: results from the US National Comorbidity Survey. British Journal of Psychiatry, 168, 17-30. Kessler, R.C., Crum, R.M., Warner, L.A., Nelson, C.B., Schulenberg, J., & Anthony, J.C. (1997). Lifetime co-occurrence of DSM-III-R alcohol abuse and dependence with other psychiatric disorders in the National Comorbidity Survey. Archives of General Psychiatry, 54, 313-321. Kindt, M., & Brosschot, J.F. (1997). Phobia-related bias for pictorial and linguistic stimuli. Journal of Abnormal Psychology, 106, 644-648. Kindt, M., & Brosschot, J.F. (1998). Cognitive avoidance in phobia. Journal of Psychopathology and Behavioral Assessment, 20, 43-55.
IX. REFERENCES
202
Kindt, M., & Brosschot, J.F. (1999). Cognitive bias in spider-phobic children: Comparison of a pictorial and a linguistic spider Stroop. Journal of Psychopathology and Behavioral Assessment, 21, 207-220. Kirkpatrick, D.R. (1984). Age, gender, and patterns of common intense fears among adults. Behaviour Research and Therapy, 22, 141-150. Klein, K., & Boals, A. (2001). The relationship of life-event stress and working memory capacity. Applied Cognitive Psychology, 15, 565-579. Klieger, D.M. (1987). The Snake Anxiety Questionnaire as a measure of ophidiophobia. Educational and Psychological Measurement, 47, 449-459. Klieger, D.M. (1994). A new approach to the measurement of ophidiophobia. Personality and Individual Differences, 16(3), 505-508. Klieger, D.M. (1997). Disgust as the source of false positive effects in the measurement of ophidiophobia. The Journal of Psychology, 131(4), 371-382. Klorman, R., Hastings, J.E., Weerts, T.C., Melamed, B.G., & Lang, P.J. (1974). Psychometric description of some specific-fear questionnaires. Behavior Therapy, 5, 401-409. Koivisto, M., & Revonsuo, A. (2005). Prechange event-related potentials predict change blindness in various attention conditions. Cognitive Neuroscience and Neuropsychology, 16(8), 869-873. Kringlen, E., Torgersen, S., & Cramer, V. (2006). Mental illness in a rural area - A Norwegian psychiatric epidemiological study. Social Psychiatry and Psychiatric Epidemiology, 41, 713-719. Kuehner, C. (1997). Fragebogen zur Depressionsdiagnostik nach DSM-IV (FDD-DSM-IV). [Questionnaire for DSM-IV depression diagnosis]. Goettingen, Germany: Hogrefe. Kulas, J.F., Conger, J.C., & Smolin, J.M. (2003). The effects of emotion on memory: An investigation of attentional bias. Journal of Anxiety Disorders, 17, 103-113. Lang, P.J. (1993). From emotional imagery to theoretical organization of emotion in memory. In N. Birbaumer & A. Oehman (eds.), The structure of emotion. Goettingen: Hogrefe. Laux, L., Glanzmann, P., Schaffner, P., & Spielberger, C. D. (1981). STAI:Das State-TraitAngstinventar. [STAI: The state-trait-anxiety inventory]. Weinheim, Germany: Beltz. Lavric, A., Rippon, G., & Gray, J.R. (2003). Threat-evoked anxiety disrupts spatial working memory performance: An attentional account. Cognitive Therapy and Research, 27, 489-504.
IX. REFERENCES
203
Lavy, E.H., van Oppen, P., & van den Hout, M. (1994). Selective processing of emotional information in obsessive compulsive disorder. Behaviour Research and Therapy, 32, 243-246. LeDoux, J. (1996). The emotional brain. New York: Simon & Schuster. Lewinsohn, P.M., Zinbarg, R., Seeley, J.R., Lewinsohn, M., & Sack, W.H. (1997). Lifetime comorbidity among anxiety disorders and between anxiety disorders and other mental disorders in adolescents. Journal of Anxiety disorders, 11, 377-394. Lichtenstein, P., & Annas, P. (2000). Heritability and prevalence of specific fears and phobias in childhood. Journal of Child Psychology and Psychiatry, 41, 927-937. Lipp, O.V., & Derakshan, N. (2005). Attentional bias to pictures of fear-relevant animals in a dot probe task. Emotion, 5, 365-369. Litz, B.T., Weathers, F.W., Monaco, V., Herman, D.S., Wolfsohn, M., Marx, B., & Keane, T.M. (1986). Attention, arousal, and memory in posttraumatic stress disorder. Journal of Traumatic Stress, 9, 497-520. Luck, S.J., Vogel, E.K., & Shapiro, K.L. (1996). Word meanings are accessed but cannot be reported during the attentional blink. Nature, 383, 616-618. Luck, S.J., & Vogel, E.K. (1997). The capacity of visual working memory for features and conjunctions. Nature, 390, 279- 281. Lundh, L.-G., & Oest, L.-G. (1996). Recognition bias for critical faces in social phobics. Behaviour Research and Therapy, 34, 787-794. Lundh, L.-G., Thulin, U., Czyzykow, S., & Oest, L.-G. (1998). Recognition bias for safe faces in panic disorder with agoraphobia. Behaviour Research and Therapy, 36, 323337. Lundh, L.-G., Wikstroem, J., Westerlund, J., & Oest, L.-G. (1999). Preattentive bias for emotional information in panic disorder with agoraphobia. Journal of Abnormal Psychology, 108, 222-232. Mack, A., & Rock, I. (1998a). Inattentional Blindness. Cambridge, MA: MIT Press. Mack, A., & Rock, I. (1998b). Inattentional blindness: Perception without attention. In R. D. Wright (Ed.), Visual Attention (Vol. 8, pp. 55-76). New York: Oxford. MacLeod, C., & Mathews, A. (2004). Selective memory effects in anxiety disorders: An overview of research findings and their implications. In D. Reisberg & P. Hertel (eds.), Memory and Emotion. Oxford: Oxford University Press.
IX. REFERENCES
204
MacLeod, C., Mathews, A., & Tata, P. (1986). Attentional bias in emotional disorders. Journal of Abnormal Psychology, 95, 15-20. MacLeod, C., & McLaughlin, K. (1995). Implicit and explicit memory bias in anxiety: A conceptual replication. Behaviour Research and Therapy, 33, 1-14. MacLeod, C., & Rutherford, E.M. (1992) Anxiety and the selective processing of threatening information: mediating roles of awareness, trait and state variables, and personal relevance of stimulus materials. Behaviour Research and Therapy, 30, 479-491. Magee, W.J., Eaton, W.W., Wittchen, H.-U., McGonagle, K.A., & Kessler, R.C. (1996). Agoraphobia, simple phobia, and social phobia in the national comorbidity survery. Archives of General Psychiatry, 53, 159-168. Magnussen, S., Greenlee, M.W., & Thomas, J.P. (1996). Parallel processing in visual shortterm memory. Journal of Experimental Psychology: Human Perception and Performance, 22, 202- 212. Maljkovic, V., & Martini, P. (2005). Short-term memory for scenes with affective content. Journal of Vision, 5, 215-229. Mansell, W., Clark, D.M., Ehlers, A., & Chen, Y.-P. (1999). Social anxiety and attention away from emotional faces. Cognition & Emotion, 13, 673-690. Margraf, J., Schneider, S., Soeder, U., Neumer, S., & Becker, E. S. (1996). Diagnostisches Interview bei psychischen Stoerungen (F-DIPS). [Diagnostic interview for mental disorders (F-DIPS)]. Unpublished manual. Marks, I.M. (1987). Fears, phobias, and rituals. New York: Oxford University. Marks I.M., & Gelder, M.G. (1966). Different ages of onset in varieties of phobias. American Journal of Psychiatry, 123, 218-221. Martin, M., Horder, P., & Jones, G.V. (1992). Integral bias in naming of phobia-related words. Cognition & Emotion, 6, 479-486. Martin, M., Williams, R.M., & Clark, D.M. (1991). Does anxiety lead to selective processing of threat-related information? Behaviour Research and Therapy, 29, 147-160. Marzillier, S.L., & Davey, G.C.L. (2005). Anxiety and disgust: Evidence for a unidirectional relationship. Cognition and Emotion, 19, 729-750. Matchett, G., & Davey, G.C. (1998). A test of the disease-avoidance model of animal phobias. Behaviour Research and Therapy, 29, 91-94.
IX. REFERENCES
205
Mathews, A., Fox, E., Yiend, J., & Calder, A. (2003). The face of fear: effects of eye gaze and emotion on visual attention. Visual Cognition, 10, 823-835. Mathews, A., & Mackintosh, B. (1998). A cognitive model of selective processing in anxiety. Cognitive Therapy and Research, 22(6), 539-560. Mathews, A.M., & MacLeod, C. (1985). Selective processing of threat cues in anxiety states. Behaviour Research and Therapy, 23, 563-569. Mathews, A., & MacLeod, C. (2005). Cognitive vulnerability to emotional disorders. Annual Review of Clinical Psychology, 1, 167-195. Mathews, A., Mogg, K., May, J., & Eysenck, M.W. (1989). Memory bias in anxiety. Journal of Abnormal Psychology, 98, 236-240. Mathews, A., Richards, A., & Eysenck, M. (1989). Interpretation of homophones related to threat in anxiety states. Journal of Abnormal Psychology, 95, 15-20. Mathews, A.M. & Sebastian, S. (1993). Suppression of emotional Stroop effects by fear arousal. Cognition and Emotion, 7, 517-530. Matthews, G., & Wells, A. (2000). Attention, automaticity, and affective disorder. Behavior Modification, 24, 69-93. Mattia, J.I., Heimberg, R.G., & Hope, D.A. (1993). The revised Stroop color-naming task in social phobics. Behaviour Research and Therapy, 31, 305-313. Mayer, B., Muris, P., Vogel, L., Nojoredjo, I., & Merckelbach, H. (2005). Fear-relevant change detection in spider-fearful and non-fearful participants. Journal of Anxiety Disorders, 20(4), 510-519. McNally, R.J. (1987). Preparedness and phobias: A review. Psychological Bulletin, 101, 283-303. McNally, R.J., & Steketee, G.S. (1985). Etiology and maintenance of severe animal phobias. Behaviour Research and Therapy, 23, 431-435. McNally, R.J., English, G.E., & Lipke, H.J. (1993). Assessment of intrusive cognition in PTSD: use of the modified Stroop paradigm. Journal of Traumatic Stress, 6, 233-241. McNally, R.J., Kaspi,S.P., Rieman, B.C., & Zeitlin, S.B. (1990). Selective processing of threat cues in post-traumatic stress disorder. Journal of Abnormal Psychology, 99, 398-402.
IX. REFERENCES
206
Merckelbach, H., de Jong, P.J., Arntz, A., & Schouten, E. (1993). The role of evaluative learning and disgust sensitivity in the etiology and treatment of spider phobia. Advances in Behaviour Research and Therapy, 15, 243-255. Merckelbach, H., de Jong, P.J., Muris, P., & van den Hout, M.A. (1996). The etiology of specific phobias: A review. Clinical Psychology and Review, 16, 337-361. Milner, B. (1958). The memory defect in bilateral hippocampal lesions. Psychiatry Research Reports, 11, 43- 58. Mineka, S. (1985). Animal modes of anxiety-based disorders. In A. Tuma & J. Maser (eds.), Anxiety and the anxiety disorders. Hillsdale: Lawrence Erlbaum Associates Inc. Mogg, K., Baldwin, D.S., Brodrick, P., & Bradley, B.P. (2004). Effect of short-term SSRI treatment on cognitive bias in generalised anxiety disorder. Psychopharmacology, 176, 466-470. Mogg, K., & Bradley, B.P. (1998). A cognitive-motivational view analysis of anxiety. Behaviour Research and Therapy, 36, 809-848. Mogg, K., & Bradley, B.P. (2006). Time course of attentional bias for fear-relevant pictures in spider-fearful individuals. Behaviour Research and Therapy, 44, 1241-1250. Mogg, K., Bradley, B.P., Miles, F., & Dixon, R. (2004). Time course of attentional bias for threat scenes: Testing the vigilance avoidance hypothesis. Cognition and Emotion, 18(5), 689-700. Mogg, K., Bradley, B.P., Millar, N., & White, J. (1995). A follow-up study of cognitive bias in generalized anxiety disorder. Behavior Research and Therapy, 33, 927-935. Mogg, K., Mathews, A.M., & Weinman, J. (1987). Memory bias in clinical anxiety. Journal of Abnormal Psychology, 96, 94-98. Mogg, K., Mathews, A.M., & Weinman, J. (1989). Selective processing of threat cues in anxiety states: a replication. Behaviour Research and Therapy, 27, 317-323. Mogg, K., Millar, N., & Bradley, B.P. (2000). Biases in eye movements to threatening facial expressions in generalized anxiety disorder. Journal of Abnormal Psychology, 109, 695-704. Mowrer, O.H. (1939). A stimulus-response analysis of anxiety and its role as a reinforcement agent. Psychological Review, 46, 553-556. Mueller, H.J., & Rabbitt, P.M. (1989). Reflexive and voluntary orienting of attention: Time course of activation and resistance to interruption. Journal of Experimental Psychology: Human Perception and Performance, 15, 315-330.
IX. REFERENCES
207
Murdock, B.B. (1962). The serial position effect of free recall. Journal of Experimental Psychology, 62, 618-625. Oehman, A. (1993). Fear and anxiety as emotional phenomena. In M. Lewis & J. Haviland (eds), Handbook of emotions. New York: Guilford Press. Oehman, A., Dimberg, U., & Oest, L.-G. (1984). Animal and social phobias: Biological constraints in learned fear responses. In S. Reiss & R.R. Bootzin (eds), Theoretical issues in behavior therapy. New York: Academic. Oehman, A., Erixon, G., & Lofberg, I. (1975). Phobias and preparedness: Phobic vs. neutral pictures as continued stimuli for human autonomic responses. Journal of Abnormal Psychology, 84, 41-45. Oehmman, A., Flykt, A., & Esteves, F. (2001). Emotion drives attention: Detecting the snake in the grass. Journal of Experimental Psychology: General, 130(3), 466-478. Oehman, A., Lundquist, D., & Esteves, F. (2001). The face in the crowd revisited: A threat advantage with schematic stimuli. Journal of Personality and Social Psychology, 80, 381-396. Oehman, A., & Mineka, S. (2001). Fear, phobias, and preparedness: Toward an evolved module of fear and fear learning. Psychological Review, 108, 483-522. Oehman, A., & Mineka, S. (2003). The malicious serpent: Snakes as a prototypical stimulus for an evolved module of fear. Current Directions in Psychological Science, 12, 5-9. Oehman, A., & Soares, J.J.F. (1998). Emotional conditioning to masked stimuli: Expectancies for aversive outcomes following non-recognized fear-relevant stimuli. Journal of Experimental Psychology: General, 127, 69-82. Osswald, S., Reinecker, H., (2004) Der Zusammenhang von Ekel und Ekelempfindlichkeit mit Spinnen- und Blut-Spritzen-Verletzungsaengsten. Verhaltenstherapie; 14, 23-33. Oest, L.-G. (1978). Fading vs. systematic desensitization in the treatment of snake and spider phobia. Behaviour Research and Therapy, 16, 379-389. Oest, L.-G. (1987). Age of onset in different phobias. Journal of Abnormal Psychology, 93, 223-229. Oest, L.-G. (1996). One-session group treatment of spider phobia. Behaviour Research and Therapy, 34, 707-715. Oliva, A., Wolfe, J.M., & Arsenio, H.C. (2001). Memory as an internal vision. 1st Annual meeting of the Vision Sciences Society, Sarasota, FL, May 2001.
IX. REFERENCES
208
Olson, I.R., Chun, M.M, & Anderson, A.K. (2001). Effects of phonological length on the attentional blink. Journal of Experimental Psychology: Human Perception and Performance, 27, 1116-1123. O’Regan, J.K., Rensink, R.A., & Clark, J.J. (1999). Change blindness as a result of ”mudplashes”. Nature, 398, 34. Palmer, J., & Ames, C. T. (1992). Measuring the effect of multiple eye fixations on memory for visual attributes. Perception & Psychophysics, 52, 295-306. Panksepp, J. (1998). Affective neurosciences: The foundations of human and animal emotions. Oxford: Oxford University Press. Parkin, A. (1999). Memory. A Guide for Professionals. John Wiley & Sons. Pashler, H. (1988). Familiarity and visual change detection. Perception and Psychophysics, 44(4), 369- 378. Pashler, H. (1993). Dual-task interference and elementary mental mechanisms. In D.E. Meyer & S. Kornblum (eds.), Attention and performance 14: Synergies in Experimental Psychology, Artificial Intelligence and Cognitive Neuroscience. Cambridge, MA: Bradford. Paquette, V., Levesque, J., Mensour, B., Leroux, J.-M., Beaudoin, G., Bourgouin, P., & Beauregard, M. (2002). ”Change the mind and you change the brain”: effects of cognitive-behavioral therapy on the neural correlates of spider phobia. Neuroimage, 18, 401-409. Pelli, D. G. (1997). The Video Toolbox software for visual psychophysics: Transforming numbers into movies. Spatial Vision, 10(4), 437-442. Perrez-Lopez, J.R., & Woody, S.A. (2001). Memory for facial expressions in social phobia. Behaviour Reseach and Therapy, 39, 967-975. Pflugshaupt, T., Mosimann, U.P., von Wartburg, R., Schmitt, W., Nyffeler, T., & Muri, R.M. (2005). Hypervigilance-avoidance pattern in spider phobia. Journal of Anxiety disorders, 19, 105-116. Phillips, W.A. (1974). On the distinction between sensory storage and short-term visual memory. Perception and Psychophysics, 16(2), 283- 290. Posner, M.I. (1980). Orienting of attention. Quarterly Journal of Experimental Psychology, 32, 3-25.
IX. REFERENCES
209
Posner, M.I., & Peterson, S.E. (1990). The attention system of the human brain. Annual Review of Neuroscience, 13, 25-42. Posner, M.I., & Snyder, C.R.R. (1975). Facilitation and inhibition in the processing of signals. In P. M. Rabbitt & S. Dornic (Eds.), Attention and performance, Vol. 5. San Diego, CA: Academic Press. Potter, M.C., Staub, A., & O’Connor, D.H. (2002). The time course of competition for attention: Attention is initially labile. Journal of Experimental Psychology: Human Perception and Performance, 28(5), 1149-1162. Poulton, R., & Menzies, R.G. (2002). Fears born and bred: toward a more inclusive theory of fear acquisition. Behaviour Research and Therapy 40, 197-208. Power, M., & Dalgleish, T. (1997). Cognition and emotion: From order to disorder. Hove: Psychology Press. Prabhakaran, V., Narayanan,K., Zhao, Z., Gabrielli, J.D.E. (2000). Integration of diverse information in working memory in the frontal lobe. Nature Neuroscience, 3, 85-90. Pury, C.L.S. (2002). Information-processing predictors of emotional response to stress. Cognition and Emotion, 16, 667-683. Rachman, S. (1978). Fear and courage. San Francisco: Freeman and Company. Rachman, S. (1998). Anxiety. London: Psychology Press. Radomsky, A.S., & Rachman, S. (1999). Memory bias in obsessive-compulsive disorder (OCD). Behaviour Research and Therapy, 37, 605-618. Rapee, R.M., McCallum, S.L., Melville, L.F., Ravenscroft, H., & Rodney, J.M. (1994). Memory bias in social phobia. Behaviour Research and Therapy, 32, 89-99. Raymond, J. (2003). New objects, not new features, trigger the attentional blink. Psychological Science, 14(1), 54-59. Raymond, J.E., Shapiro, K.L., & Arnell, K.M. (1992). Temporary suppression of visual processing in an RSVP task: An attentional blink? Journal of Experimental Psychology: Human Perception and Performance, 18, 849-860. Reeves, A., & Sperling, G. (1986). Attention gating in short-term visual memory. Psychological Review, 93, 180-206. Regier, D.A., Rae, D.S., Narrow, W.E, Kaelber, C.T., & Schatzberg, A.F. (1998). Prevalence of anxiety disorders and their comorbidity with mood and addictive disorders. British Journal of Psychiatry, 173, 24-28.
IX. REFERENCES
210
Reinecke, A., Becker, E.S., & Rinck, M. (manuscript submitted-a). Selective visual working memory in fear of spiders: The role of automaticity and disorder-specificity. Reinecke, A., Becker E.S., & Rinck, M. (manuscript submitted-b). Two short-screenings measuring fear of snakes: reliability and validity by contrast with the SNAQ. Reinecke, A., Becker, E.S., & Rinck, M. (manuscript submitted-c). Visual working memory for threat: Spider fearfuls show disorder-specific change detection.. Reinecke, A., Rinck, M., & Becker E.S. (2006). Spiders crawl easily through the bottleneck: Visual working memory for negative stimuli. Emotion, 6, 438-449. Reinecker, H. (1993). Phobien: Agoraphobie, soziale und spezifische Aengste. Goettingen: Hogrefe. Rensink, R.A. (1997). How much of a scene is seen? The Role of attention in Scene Perception. Investigative Ophthalmology and Visual Science, 38, S707. Rensink, R.A., O’Regan, J.K., & Clark, J.J. (1995). Image flicker is as good as saccades in making large scene changes invisible. Perception, 24, 26- 27. Rensink, R.A., O’Regan, J.K., & Clark, J.J. (1997). To see or not to see: The need for attention to perceive changes in scenes. Psychological Science, 8, 368-373. Restorff, H. von (1933). Analyse von Vorgaengen im Spurenfeld [Analysis of processes in the trace field]. Psychologische Forschung, 18, 299-342. Rinck, M., & Becker, E. S. (2005). A comparison of attentional biases and memory biases in women with social phobia and major depression. Journal of Abnormal Psychology, 114, 62-74. Rinck, M., & Becker, E.S. (2006). Spider fearful individuals attend to threat, then quickly avoid it: Evidence from eye movements. Journal of Abnormal Psychology, 115, 231238. Rinck, M., Bundschuh, S., Engler, S., Mueller, A., Wissmann, J., Ellwart, T., & Becker, E. S. (2002). Reliability and validity of German versions of three instruments measuring fear of spiders. Diagnostica, 48, 141-149. Rinck, M., Reinecke, A., Ellwart, T., Heuer, K., & Becker, E. (2005). Speeded detection and increased distraction in fear of spiders: Evidence from eye movements. Journal of Abnormal Psychology, 114, 235-248. Ro, T., Russell, C., & Lavie, N. (2001). Changing faces: A detection advantage in the flicker paradigm. Psychological Science, 12(1), 94-99.
IX. REFERENCES
211
Rolls, E.T. (1999). The brain and emotion. Oxford: Oxford University Press. Rude, S.S., Vladez, C.R., Odom, S., & Ebrahimi, A. (2003). Negative cognitive biases predict subsequent depression. Cognitive Therapy and Research, 27, 415-429. Russo, R., Fox, E., Bellinger, L., & Nguyen-van-Tam, P. (2001). Mood-congruent free recall bias in anxiety. Cognition and Emotion, 15, 419-433. Rusted, J.L., & Dighton, K. (1991). Selective processing of threat-related material by spider phobics in a prose recall task. Cognition & Emotion, 5, 123-132. Salkovskis, P. (1985). Obsessional-compulsive problems: A cognitive-behavioural analysis. Behaviour Research and Therapy, 23, 571-583. Salkovskis, P. (1996). The cognitive approach to anxiety. In P. Salkovskis (ed.), The frontiers of cognitive therapy, New York: Guilford Press. Sass H., Wittchen, H.-U., & Zaudig, M. (2003). Diagnostisches und Statistisches Manual Psychischer Stoerungen. (DSM-IV-TR). Goettingen: Hogrefe. Sawchuk, C.N., Lohr, J.M., Lee, T.C., & Tolin, D.F. (1999). Exposure to disgust-evoking imagery and information processing biases in blood-injection-injury phobia. Behaviour Research and Therapy, 37, 249-257. Sawchuk, C.N., Lohr, J.M., Tolin, D.F., Lee, T.C., & Kleinknecht, R.A. (2000). Disgust sensitivity and contamination fears in spider and blood-injection-injury phobias. Behaviour Research and Therapy, 38, 753-762. Sawchuk, C.N., Meunier, S.A., Lohr, J.M., & Westendorf, D.H. (2002). Fear, disgust, and information processing in specific phobia: The application of signal detection theory. Journal of Anxiety Disorders, 16, 495-510. Schmader, T., & Johns, M. (2003). Converging evidence that stereotype threat reduces working memory capacity. Journal of Personality and Social Psychology, 85, 440-452. Schmidt, N.B., Lerew, D.R., & Jackson, R.J. (1999). Prospective evaluation of anxiety sensitivity in the pathogenesis of panic: replication and extension. Journal of Abnormal Psychology, 108, 532-537. Schneider, W.X. (1999). Visual-spatial working memory, attention, and scene representation: A neuro-cognitive theory. Psychological Research, 62, 220-236. Schneider, W., & Shiffrin, R.M. (1977). Controlled and automatic human information processing: Detection, search and attention. Psychological Review, 84, 1-66.
IX. REFERENCES
212
Schwartz, J.M., Stoessel, P.W., Baxter, L.R., Martin, K.M., & Phelps, M.E. (1996). Systematic changes in cerebral glucose metabolic rate after successful behavior modification treatment of obsessive-compulsive disorder. Archives of General Psychiatry, 53, 109113. Scott-Brown, K.C. & Orbach, H.S. (1998). Contrast discrimination, non-uniform patterns and change blindness. Proceedings of the Royal Society, B, 265, 2159-2166. Seligman, M. (1970). On the generality of the laws of learning. Psychological Review, 77, 406-418. Seligman, M.E.P. (1971) Phobias and preparedness. Behavior Therapy, 2, 307-320. Shapiro, K. L., Raymond, J. E. & Arnell, K. M. (1994). Attention to visual pattern information produces the attentional blink in rapid serial visual presentation. Journal of Experimental Psychology: Human Perception and Performance, 20(2), 357-371. Shiffrin, R.M. (1976). Capacity limitations in information processing, attention and memory. In W.K. Estes (ed.), Handbook of learning and cognitive processes, Vol. 4. Hillsdale, NJ: Lawrence Erlbaum. Simons, D.J. (1996). In sight, out of mind: When object representations fail. Psychological Science, 7(5), 301- 305. Simons, D.J., & Ambinder, M.S. (2005). Change Blindness. Theory and consequences. Current Directions in Psychological Science, 14(1), 44-48. Simons, D. J., & Chabris, C. F. (1999). Gorillas in our midst: Sustained inattentional blindness for dynamic events. Perception, 28, 1059- 1107. Simons, D.J., & Levin, D.T. (1998). Failure to detect changes to people in a real-world interaction. Psychonomic Bulletin & Review, 5, 644-649. Smith, E.E., & Jonides, J. (1997). Working memory: A view from neuroimaging. Cognitive Psychology, 33, 5-42. Smith, E.E., Jonides, J., & Koeppe, R.A. (1996). Dissociating verbal and spatial working memory using PET. Cerebral Cortex, 6, 11-20. Smith, S.D., Most, S.B., Newsome, L.A., & Zald, D.H. (2006). An emotion-induced attentional blink elicited by aversively conditioned stimuli. Emotion, 6, 523-527. Sperling, G. (1967). Successive approximations to a model for short- term memory. Acta Psychologica, 27, 285- 292.
IX. REFERENCES
213
Strack, F. & Deutsch, R. (2004). Reflective and impulsive determinants of social behaviour. Personality and Social Psychology Review, 8, 220-247. Straube, T., Glauer, M., Dilger, S., Mentzel, H.-J., & Miltner, W.H.R. (2006). Effects of cognitive-behavioral therapy on brain activation in specific phobia. Neuroimage, 29, 125-135. Suedfeld, P., & Hare, R.D. (1977). Sensory deprivation in the treatment of snake phobia: behavioral, self-report, and physiological effects. Behavior Therapy, 8, 240-250. Szymanski, J., & O’Donohue, W. (1995). Fear of Spiders Questionnaire. Journal of Behavior Therapy and Experimental Psychiatry, 26, 31-34. Teachman, B.A., & Woody, S.R. (2003). Automatic Processing in spider phobia: Implicit fear associations over the course of treatment. Journal of Abnormal Psychology, 112, 100-109. Thorpe, S.J., & Salkovskis, P.M. (1997). The effect of one-session treatment for spider phobia on attentional bias and beliefs. British Journal of Clinical Psychology, 36, 225-241. Thorpe, S.J., & Salkovskis, P.M. (1998a). Information processing in spider phobics: the Stroop colour naming task may indicate strategic but not automatic attentional bias. Behaviour Research and Therapy, 35, 131-144. Thorpe, S.J., & Salkovskis, P.M. (1998b). Studies on the role of disgust in the acquisition and maintenance of specific phobias. Behaviour Research and Therapy, 36, 877-893. Thorpe, S.J., & Salkovskis, P.M. (2000). Recall and recognition memory for spider information. Journal of Anxiety Disorders, 14, 359-375. Tipper, S.P., & Weaver, P.B. (1996). The medium of attention: Location-based, object-based, or scene-based? In R. Wright (Ed.), Visual attention. Oxford: Oxford University Press. Tolin, D.F., Lohr, J.M., Lee, T.C., & Sawchuk, C.N. (1999). Visual avoidance in specific phobia. Behavior Research and Therapy, 37, 63-70. Tolin, D.F., Lohr, J.M., Sawchuk, C.N., & Lee, T.C. (1997). Disgust and disgust sensitivity in blood-injection-injury and spider phobia. Behaviour Research and Therapy, 35, 949-953. Treisman, A. (1996). The binding problem. Current Opinion in Neurobiology, 6, 171- 178.
IX. REFERENCES
214
Treisman, A., & Gelade, G. (1980). A feature- integration theory of attention. Cognitive Psychology, 12, 97- 136. Torgersen, S. (1988). Genetics. In C.G. Last & M. Hersen (eds.), Handbook of anxiety disorders. New York: Pergamon Press. van den Hout, M., Tenney, N., Huygens, K., & deJong, P. (1997). Preconscious processing bias in specific phobia. Behaviour Research and Therapy, 35, 29-34. Van der Hejden, A.H.C. (1981). Short-term visual information forgetting, London: Routledge & Kegan Paul. Vogel, E.K., & Luck, S.J. (2002). Delayed working memory consolidation during the attentional blink. Psychonomic Bulletin and Review, 9, 739-743. Vogel, E.K., Luck, S.J., & Shapiro, K.L. (1998). Electrophysiological evidence for a postperceptual locus of suppression during the attentional blink. Journal of Experimental Psychology: Human Perception and Performance, 24, 1656-1674. Vogel, E.K., Woodman, G.F., & Luck, S.J. (2001). Storage of Features, Conjunctions, and Objects in Visual Working Memory. Journal of Experimental Psychology: Human Perception and Performance, 27(1), 92- 114. Vrana, S.R., Roodman, A., & Beckham, J.C. (1995). Selective processing of traumarelevant words in post-traumatic stress disorder. Journal of Anxiety Disorders, 9, 515-530. Watts, F.N. (1986). Cognitive processing in phobias. Behavioural Psychotherapy, 14, 295301. Watts, F.N., & Dalgleish, T. (1991). Memory for phobia-related words in spider phobics. Cognition & Emotion, 5, 313-329. Watts, F.N., McKenna, F.P., Sharrock, R., & Tresize, L. (1986). Colour naming of phobia related words. British Journal of Psychology, 77, 97-108. Watts, F.N., Tresize, L., & Sharrock, R. (1986). Processing of phobic stimuli. British Journal of Clinical Psychology, 25, 253-261. Weichselgartner, E., & Sperling, G. (1987). Dynamics of automatic and controlled visual attention. Science, 238, 778-780. Weissman, M.M. (1985). The epidemiology of anxiety disorders. In A.H. Tuma & J.D. Maser (eds.), Anxiety and the anxiety disorders. Hillsdale, NJ: Erlbaum.
IX. REFERENCES
215
Wells, J.E., Browne, M.A.O., Scott, K.M., McGee, M.A., Baxter, J., & Kokaua, J. (2006). Prevalence, interference with life, and severity of 12 month DSM-IV disorders in Te Rau Hinengaro: The New Zealand Mental Health Survey. Australian and New Zealand Journal of Psychiatry, 40, 845-854. Wells, A., & Matthews, G. (1994). Attention and emotion: A clinical perspective. Hove: Erlbaum. Werner, S. & Thies, B. (2000). Is ”change blindness” attenuated by domain-specific expertise? An expert-novices comparison of change-detection in football games. Visual Cognition, 7, 163-174. Wessel, I., & Merckelbach, H. (1997). The impact of anxiety on memory for details in spider phobics. Applied Cognitive Psychology, 11, 223-231. Wessel, I., & Merckelbach, H. (1998). Memory for threat-relevant and threat-irrelevant cues in spider-phobics. Cognition and Emotion, 12, 93-104. Westling, B.E., & Oest, L.G. (1995). Cognitive bias in panic disorder patients and changes after cognitive-behavioral treatments. Behavior Research and Therapy, 33, 585-588. Wheeler, M.E., & Treisman, A. (2002). Binding in Short- Term Visual Memory. Journal of Experimental Psychology: General, 131(1), 48- 64. Wikstroem, J., Lundh, L.-G., Westerlund, J., Hoegman, L. (2004). Preattentive bias for snake words in snake phobia. Behavior Research and Therapy, 42, 949-970. Wilhelm, S. McNally, R.J., Baer, L., & Florin, I. (1996). Directed forgetting in obsessivecompulsive disorder. Behaviour Research and Therapy, 34, 633-641. Williams, J.M.G., Mathews, A., & MacLeod, C. (1996). The emotional stroop task and psychopathology. Psychological Bulletin, 120, 3-24. Williams, J.M.G., Watts, F.N., MacLeod, C., & Mathews, A. (1988). Cognitive psychology and emotional disorders. Chichester: John Wiley. Williams, J.M.G., Watts, F.N., MacLeod, C., & Mathews, A. (1997). Cognitive psychology and emotional disorders. Chichester: John Wiley. Wilson, E., & MacLeod, C. (2003). Contrasting two accounts of anxiety-linked attentional bias: selective attention to varying levels of stimulus threat intensity. Journal of Abnormal Psychology, 112, 212-218. Windmann, S., & Krueger, T. (1998). Subconscious detection of threat as reflected by an enhanced response bias. Consciousness and Cognition, 7, 603-633.
IX. REFERENCES
216
Wittchen, H.-U-, Essau, C.A., & Krieg, C. (1991). Anxiety disorders: Similarities and differences of treated and untreated groups. British Journal of Psychiatry, 159, 23-33. Wittchen, H.-U., Hand, I., & Hecht, H. (1989). Praevalenz, Komorbiditaet und Schweregrad von Angststoerungen. Zeitschrift fuer Klinische Psychologie, 18(2), 117-133. Wittchen, H.U., & Jacobi, F. (2005). Size and burden of mental disorders in Europe: A critical review and appraisal of studies. European Journal of Neuropsychopharmacology, 15(4), 357-376. Wittchen, H.-U., Nelson, C.B., & Lachner, G. (1998). Prevalence of mental disorders and psychosocial impairments in adolescents and young adults. Psychological Medicine, 28, 109-126. Wittchen, H.-U., & Vossen, A. (1996). Komorbiditaetsstrukturen bei Angststoerungen. Haeufigkeit und moegliche Implikationen. In J. Margraf (ed.), Lehrbuch der Verhaltenstherapie, Vol. 1. Berlin, Heidelberg, New York: Springer. Wolfe, J.M. (1997). Post- attentive vision. Investigative Ophthalmology and Visual Science, 37(3), 214. Wolfe, J.M. (1999). Inattentional Amnesia. In V. Coltheart (ed.), Fleeting Memories (pp. 71- 94). Cambridge, MA: MIT Press. Wolfe, J.M., & Bennett, S.C. (1997). Preattentive Object Files: Shapeless bundles of basic features. Vision Research, 37(1), 25- 44. Wolfe, J.M., Klempen, N., & Dahlen, K. (2000). Post-attentive vision. Journal of Experimental Psychology: Human Perception and Performance, 26(2), 693- 716. Wolfe, J. M., Reinecke, A., & Brawn, P. (2006). Why don’t we see changes? The role of attentional bottlenecks and limited visual memory. Visual Cognition, 14, 749-780. Woody, S.R., McLean, C., & Klassen, T. (2005). Disgust as a motivator of avoidance of spiders. Journal of Anxiety Disorders, 19, 461-475. Woody, S.R., & Teachman, B.A. (2000). Intersection of disgust and fear: Normative and pathological views. Clinical Psychology: Science & Practice, 7, 291-311. Yiend, J., & Mathews, A. (2001). Anxiety and attention to threatening pictures. Quarterly Journal of Experimental Psychology, 54A, 665-681. Yonelinas, A.P., & Jacoby, L.L. (1995). Dissociating automatic and controlled processes in a memory search task: beyond implicit memory. Psychological Research, 57, 156-165.
IX. REFERENCES
217
Young, J.E. (1999). Cognitive therapy for personality disorders: A schema-focused approach (3rd ed.). Sarasota, FL: Professional Resource Press/ Professional Resource Exchange. Zimmermann, M., Coryell, W., Wilson, S., & Corenthal, C. (1986). A self-report scale to diagnose Major Depressive Disorder. Archives of General Psychiatry, 43, 1076-1081. Zuvic, S.M., Visser, T.A.W., & DiLollo, V. (2000). Direct estimates of processing delays in the attentional blink. Psychological Research, 63, 192-198.
X. Appendix
Table X.1: Paper 1: Mean valence judgments (scale from 1=unpleasant to 9=pleasant) and arousal judgments (scale from 1=low to 9=high) and standard deviations separated for the both groups. Significances of t-test between the groups (df=44) < 0.05 are bold. Means significantly different from the neutral mean 5 are underlined.
Valence NAC
Arousal SF
NAC
SF
apple
7.4 (1.4) 7.7 (1.4) 4.5 (1.8) 4.0 (1.6)
backpack bag
5.4 (1.4) 5.4 (1.1) 5.3 (0.8) 4.8 (0.7) 5.7 (1.1) 5.6 (1.4) 5.0 (0.9) 5.0 (0.7)
basketball basket beagle
5.6 (1.3) 6.3 (1.4) 5.3 (1.0) 5.4 (0.9) 5.5 (1.1) 5.3 (1.0) 4.8 (1.0) 4.9 (0.6) 7.9 (1.4) 7.8 (1.0) 4.4 (2.3) 3.5 (1.9)
blanket blossom
5.5 (1.5) 5.2 (1.1) 4.7 (1.3) 4.7 (1.2) 8.1 (1.1) 8.5 (0.7) 4.2 (2.0) 2.8 (1.8)
box bugle butterfly
5.2 (1.3) 5.0 (0.9) 5.1 (0.8) 5.1 (0.3) 5.9 (1.5) 5.7 (1.3) 5.4 (1.2) 5.1 (0.6) 6.7 (1.6) 7.3 (1.4) 4.7 (1.8) 3.1 (1.5)
cactus candle
5.7 (1.4) 7.3 (1.3) 5.3 (1.1) 4.9 (0.8) 6.6 (1.2) 7.0 (1.2) 3.7 (1.8) 3.1 (1.5)
carton ceramic vase cheese
4.9 (1.1) 4.9 (0.8) 5.4 (1.0) 5.1 (0.5) 5.5 (1.3) 5.4 (0.8) 4.5 (1.3) 4.7 (0.6) 6.8 (1.5) 6.6 (1.6) 4.6 (1.3) 4.5 (1.0)
coffee mill cup
6.0 (1.3) 6.0 (1.2) 4.7 (1.5) 4.3 (1.1) 7.0 (1.3) 7.5 (1.3) 4.0 (2.0) 3.4 (1.6)
drums fan gardenhose
6.2 (1.0) 5.8 (1.3) 4.6 (1.5) 5.0 (1.1) 5.0 (1.4) 5.3 (1.1) 5.4 (1.0) 5.1 (0.9) 5.2 (1.2) 5.1 (0.8) 5.0 (1.0) 5.0 (0.3)
hat kettle, blue
5.2 (1.0) 4.9 (0.8) 4.9 (0.9) 5.0 (0.4) 6.3 (1.6) 5.7 (1.0) 4.5 (1.3) 4.7 (0.8)
kettle, yellow 5.7 (1.2) 5.4 (1.1) 4.7 (1.2) 4.7 (0.6) mushroom 5.9 (1.1) 5.9 (1.5) 4.8 (1.0) 4.7 (0.8) 218
X. APPENDIX
219 Valence NAC
Arousal SF
NAC
SF
pan picnic basket pig
5.1 (1.3) 5.1 (0.7) 5.0 (0.7) 4.9 (0.5) 5.8 (1.4) 6.4 (1.4) 4.9 (1.0) 4.3 (1.1) 5.4 (1.7) 5.6 (1.5) 4.9 (1.0) 4.6 (1.1)
salad spider
6.5 (1.3) 6.7 (1.5) 4.8 (1.2) 4.4 (1.1) 4.6 (1.4) 1.5 (0.8) 5.4 (1.0) 7.7 (2.3)
stool sugar can sunlounger
5.4 (1.1) 5.0 (1.0) 4.7 (1.3) 5.0 (0.7) 4.6 (1.5) 5.1 (0.9) 5.4 (0.8) 5.1 (0.3) 6.9 (1.4) 7.2 (1.5) 3.9 (1.5) 3.1 (1.4)
toycar tree wardrobe
5.7 (1.8) 6.0 (1.1) 5.4 (1.3) 5.0 (1.0) 7.0 (1.2) 7.4 (1.5) 3.7 (1.7) 3.2 (1.7) 6.1 (1.2) 5.5 (0.9) 4.4 (1.3) 4.8 (0.5)
Table X.2: Paper 2, Experiment 2: Mean valence judgments (scale from 1=unpleasant to 9=pleasant) and arousal judgments (scale from 1=low to 9=high) and standard deviations separated for the both groups. Significances of t-test between the groups (df=35) < 0.05 are bold. Means significantly different from the neutral mean 5 are underlined.
Valence NAC SF
Arousal NAC SF
apple backpack
7.7 (1.3) 7.4 (1.8) 3.6 (1.8) 5.6 (1.9) 5.5.(1.0) 4.4 (1.2)
3.8 (1.3) 4.9 (0.5)
bag basketball
5.6 (1.4) 5.7 (1.5) 6.4 (2.1) 6.4 (1.0)
5.0 (0.5) 4.7 (1.4)
4.8 (0.8) 5.2 (1.2)
basket beagle blanket
6.0 (1.3) 4.8 (1.1) 7.7 (1.7) 8.2 (1.5) 5.3 (1.6) 4.9 (1.8)
4.2 (1.5) 3.3 (2.2) 4.5 (1.0)
4.8 (0.8) 2.4 (1.3) 4.4 (1.2)
blossom box
8.2 (1.1) 8.1 (1.1) 4.8 (1.1) 5.1 (0.6)
3.8 (2.3) 5.1 (0.5)
3.2 (1.6) 4.9 (0.6)
bugle butterfly cactus
5.7 (1.6) 5.7 (1.7) 7.1 (1.6) 6.6 (1.7) 6.2 (1.5) 5.7 (1.3)
4.7 (1.4) 3.8 (1.6) 4.6 (1.2)
5.3 (1.1) 3.6 (1.5) 4.5 (1.2)
candle carton
6.1 (2.1) 6.8 (1.4) 5.5 (1.4) 4.8 (1.2)
3.7 (1.5) 4.8 (1.1)
2.9 (1.5) 4.7 (0.9)
ceramic vase cheese
5.8 (1.7) 5.9 (1.2) 7.2 (1.7) 6.2 (1.7)
4.6 (0.8) 4.2 (1.6)
4.6 (0.6) 4.9 (1.2)
X. APPENDIX
220 Valence NAC
Arousal SF
NAC
SF
coffee mill cup drums
6.2 (1.6) 5.3 (1.2) 7.5 (1.7) 6.8 (1.6) 6.3 (1.8) 6.5 (1.3)
4.4 (1.1) 3.2 (1.8) 4.2 (1.6)
4.5 (1.1) 3.4 (1.5) 4.8 (1.3)
fan gardenhose
5.7 (2.1) 5.6 (1.8) 5.1 (0.9) 4.7 (1.2)
4.7 (1.3) 4.6 (1.0)
4.7 (0.9) 5.1 (0.3)
hat 5.1 (1.6) 5.2 (1.1) kettle, blue 6.3 (1.6) 5.2 (1.3) kettle, yellow 5.8 (1.7) 5.2 (1.1)
4.5 (1.0) 4.1 (1.0) 4.2 (1.0)
4.6 (1.2) 4.9 (0.7) 5.0 (1.0)
mushroom pan picnic basket
6.0 (1.9) 5.9 (1.7) 6.0 (1.4) 4.8 (0.8) 6.7 (1.6) 6.0 (1.5)
4.1 (1.7) 4.2 (1.2) 4.0 (1.4)
4.7 (0.7) 5.0 (0.8) 4.3 (1.1)
pig salad
6.2 (2.0) 6.0 (1.6) 7.3 (1.6) 6.0 (1.8)
4.7 (1.6) 4.2 (1.5)
4.4 (1.0) 4.6 (1.2)
snake spider stool
5.2 (2.1) 4.9 (1.6) 5.0 (1.5) 1.9 (1.7) 5.6 (1.3) 5.0 (0.8)
5.5 (0.9) 5.5 (0.8) 4.3 (1.2)
6.1 (0.9) 8.2 (0.9) 4.8 (0.8)
sugar can sunlounger
5.3 (1.6) 4.7 (1.1) 7.1 (2.3) 7.1 (1.3)
4.6 (0.8) 3.2 (1.8)
4.9 (1.2) 3.4 (1.5)
toycar tree wardrobe
6.1 (1.7) 5.8 (1.4) 7.4 (1.6) 7.0 (1.6) 5.7 (1.6) 4.9 (1.3)
4.3 (1.1) 2.5 (1.4) 4.4 (1.3)
4.6 (1.1) 2.8 (1.6) 4.5 (1.3)
X. APPENDIX
221
apple
backpack
beagle
blanket
cheese
gardenhose
pan
spider
tree
bag
blossom
coffee mill
cup
hat
kettle, blue
picnic basket
stool
pig
sugar can
basketball
box
drums
kettle, yellow
salad
sunlounger
basket
bugle
fan
mushroom
snake
toycar
wardrobe
Figure X.1: Stimuli used in Paper 1 (except the snake image), Paper 2, Paper 3 (except the snake image), and Paper 4; Note: Actual stimuli were in color.
X. APPENDIX
222
boxes
casserole
coffee machine
cutlery
dishes
eggbeater
grater
kettle blue
knife
masher
pan2
pan3
pestle
spoon
pan1
toaster
Figure X.2: Paper5: T1-stimuli (kitchen items); Note: Actual stimuli were in color.
binocular
bugle
gardenhose
glasses
helmet
screw
microscope
shoe
bulb
football
glue strip
hat
paint
saw
stapler
suitcase
Figure X.3: Paper 5: T1-stimuli (non-kitchen items); Note: Actual stimuli were in color.
X. APPENDIX
223
mushroom1
blossom1
mushroom2
mushroom3
mushroom4
blossom2
blossom3
blossom4
spider3
spider4
spider1
spider2
snake1
snake2
snake3
snake4
Figure X.4: Paper 5: T2-stimuli; Note: Actual stimuli were in color.
X. APPENDIX
224
asparagus
bag
basket1
binde
box2
box3
brush
bucket1
bucket2
carton
ceramic
clipboard
container
dog bowl
fish
gauze
glove
onions
pitcher
safe
stop watch
hot-water bottle
sandglass
toothpicks
fan
iron
bottle 2
basket3
beet
easter egg
bottle 1
basket2
saw
shoes
stool
telephone
vase
yarn1
box1
yarn2
Figure X.5: Paper 5: Distractor stimuli; Note: Actual stimuli were in color.
Internationale Diagnosen Checkliste für DSM-IV
Spezifische Phobie A
Code: ___________________ Alter: ____Datum:__________
Ausgeprägte und anhaltende Angst, die Angst: übertrieben oder unbegründet ist, ausgelöst durch spezifische Objekte gar nicht oder Situationen oder deren Antizipation. 0
1
Spinnen
D sehr schwer 2
3
4
5
6
7
8
Wie ist Deine Einstellung zu Spinnen? Angst? Wie sieht das aus?
B
Die Konfrontation mit dem phobischen Reiz ruft fast immer eine unmittelbare Angstreaktion hervor (die in Form einer situationsgebundenen oder situationsbegünstigten Panikattacke auftreten kann).
Die phobischen Situationen werden Vermeidung: vermieden oder nur unter starker Angst oder starkem Unbehangen gar nicht ertragen. Kannst Du Dir Spinnen im Zoo/ Film etc. ansehen? Gefühl dabei? Anfassen? Jemanden besuchen, der Haus/ Garten/ Spinne als Haustier etc. besitzt?
E Ja
Verdacht Nein
Stell Dir vor, hinter dem Tisch würde plötzlich eine große Spinne hochkrabbeln...Reaktion (Schwitzen, Herzklopfen, Übelkeit etc.)? Gartenparty, Zelten...?
X. APPENDIX
ICDL
0
1
2
3
4
5
6
7
8
Vermeidungsverhalten, ängstliche Belastung: Erwartungshaltung oder starkes gar nicht Unbehagen in den gefürchteten 0 1 2 3 4 5 6 7 8 Situationen beeinträchtigen deutlich die normale Lebensführung, die beruflichen (oder schulischen) Leistungen oder sozialen Aktivitäten Beeinträchtigung: oder Beziehungen, oder die Phobie gar nicht verursacht erhebliches Leiden für 0 1 2 3 4 5 6 7 8 die Person. Verzicht auf bestimmten Urlaub? Spielzeugspinnen?
C
Die Person erkennt, dass ihre Angst übertrieben oder unbegründet ist. Würden andere Personen in der Situation auch so reagieren?
Ja
Verdacht Nein
F
Die Angst, Panikattacken oder Vermeidungsverhalten gegenüber den spezifischen Objekten oder Situationen werden durch eine andere psychische Störung besser erklärt. (z.B. Zwangsstörung, PTB etc.)
Spezifische Phobie:
Ja
Verdacht Nein
Ende
Ja
Nein
Figure X.6: The adapted ICDL diagnosis checklist for specific phobia (spiders) used in Papers 1 to 5.
225
Internationale Diagnosen Checkliste für DSM-IV
Spezifische Phobie A
Code: ___________________ Alter: ____Datum:__________
Ausgeprägte und anhaltende Angst, die Angst: übertrieben oder unbegründet ist, gar nicht ausgelöst durch spezifische Objekte 0 1 2 3 4 5 6 7 8 oder Situationen oder deren Antizipation.
Schlangen
sehr schwer
D
Die Konfrontation mit dem phobischen Reiz ruft fast immer eine unmittelbare Angstreaktion hervor (die in Form einer situationsgebundenen oder situationsbegünstigten Panikattacke auftreten kann).
Die phobischen Situationen werden Vermeidung: vermieden oder nur unter starker Angst oder starkem Unbehangen gar nicht ertragen. 0 1 2 3 4 5 6 7 8 Kannst Du Dir Schlangen im Zoo/ Film etc. ansehen? Gefühl dabei? Anfassen? Jemanden besuchen, der Schlange besitzt?
Wie ist Deine Einstellung zu Schlangen? Angst? Wie sieht das aus?
B
X. APPENDIX
ICDL
E Ja
Verdacht Nein
Stell Dir vor, auf dem Fensterbrett würde Terrarium stehen (ohne, dass Du es wusstest)...Reaktion (Schwitzen, Herzklopfen, Übelkeit etc.)? Stell Dir vor, Du würdest im Wald auf Schlange stoßen...?
Vermeidungsverhalten, ängstliche Belastung: Erwartungshaltung oder starkes gar nicht 0 1 2 3 4 5 6 7 8 Unbehagen in den gefürchteten Situationen beeinträchtigen deutlich die normale Lebensführung, die beruflichen (oder schulischen) Leistungen oder sozialen Aktivitäten Beeinträchtigung: oder Beziehungen, oder die Phobie gar nicht verursacht erhebliches Leiden für 0 1 2 3 4 5 6 7 8 die Person. Verzicht auf bestimmten Urlaub? Spielzeugschlangen?
C
Die Person erkennt, dass ihre Angst übertrieben oder unbegründet ist. Würden andere Personen in der Situation auch so reagieren?
Ja
Verdacht Nein
F
Die Angst, Panikattacken oder Vermeidungsverhalten gegenüber den spezifischen Objekten oder Situationen werden durch eine andere psychische Störung besser erklärt. (z.B. Zwangsstörung, PTB etc.)
Spezifische Phobie:
Ja
Verdacht Nein
Ende
Ja
Nein
Figure X.7: The adapted ICDL diagnosis checklist for specific phobia (snakes) used in Papers 2, 4, and 5.
226
Summary
BACKGROUND. One group of theories aiming at providing a framework explaining the etiology, maintenance and phenomenology of anxiety disorders is classified as cognitive models of anxiety. These approaches assume that distortions in specific levels of informationprocessing are relevant for the onset and maintenance of the disorder. A detailed knowledge about the nature of these distortions would have important implications for the therapy of anxiety, as the implementation of confrontative or cognitive elements precisely fitting the distortions might enhance efficacy. Still, these models and related empirical evidence provide conflicting assumptions about the nature of disorder-linked processing distortions. Many cognitive models of anxiety (e.g., Fox, Russo, & Dutton, 2002; Mathews & Mackintosh, 1998; Williams, Watts, MacLeod, & Mathews, 1997) postulate that anxiety-linked biases of attention imply hypervigilance to threat and distractibility from other stimuli in the presence of feared materials. This is convincingly confirmed by various experimentalclinical studies assessing attention for threat in anxious participants compared to non-anxious controls (for a review, see Mathews & MacLeod, 2005). In contrast, assumptions concerning anxiety-linked biased memory for threat are less convincing; based on the shared tendency for avoidance of deeper elaboration in anxiety disorders, some models predict memory biases only for implicit memory tasks (Williams et al., 1997) or even disclaim the relevance of memory in anxiety at all (e.g., Mogg, Bradley, Miles, & Dixon, 2004). Other theories restrict the possibility of measuring disorder-specific memory biases to tasks that require merely perceptual encoding of the materials instead of verbal-conceptual memory (e.g., Fox et al., 2002; Mathews & Mackintosh, 1998). On the one hand, none of these models has integrated all the inconsistencies in empirical data on the topic. On the other hand, the numerous empirical studies on memory in anxiety that have been conducted with varying materials, anxiety disorders, encoding and retrieval conditions do not allow final conclusions about the prerequisites for finding memory biases (for a review, see MacLeod & Mathews, 2004). A more detailed investigation of the complete spectrum of memory for threat utilizing carefully controlled variations of depth of encoding and materials is needed. In view of these inconsistencies, it is all the more surprising that one important part of this spectrum has so far remained completely uninvestigated: visual working memory (VWM). No study has ever differentially addressed VWM for threat in anxious vs. nonanxious participants and none of the cognitive models of anxiety provides any predictions concerning this stage of information processing. Research on cognitive biases in anxiety
227
SUMMARY
228
has thus far only addressed the two extremes of the processing continuum: attention and longer-term memory. In between, a gap remains, the bridging of which might bring us closer to defining the prerequisites of memory biases in anxiety. As empirical research has provided substantial and coherent knowledge concerning attention in anxiety, and as attention and VWM are so closely linked (see, for instance, Cowan, 1995), the thorough investigation of VWM may provide important clues for models of anxiety. Is anxiety related to VWM biases favoring the processing of threatening information, or does the avoidance presumed by cognitive models of anxiety already begin at this stage? RESEARCH AIMS. To investigate the relevance of biased VWM in anxiety, the present research focused in eight experiments on the following main research questions: (1) Is threat preferably stored in VWM in anxious individuals? (2) Does threat preference occur at the cost of the storage of other items, or is extra storage capacity provided? (3) Would the appearance of threat interrupt ongoing encoding of non-threatening items? (4) Does prioritized encoding of threat in anxiety occur strategically or automatically? (5) Are disorder-specific VWM biases also materials-specific? (6) Are VWM biases in anxiety modifiable through cognitive-behavioral therapy? METHODS. In Experiments 1-4, a spatial-sequential cueing paradigm was used. A subset of real-object display items was successively cued on each trial by a sudden change of the picture background for 150 ms each. After the cueing, one of the display pictures was hidden and probed for a memory test. On most trials, a cued item was tested, and memory accuracy was determined depending on the item’s position within the cue string and depending on its valence. In some cases, memory for an uncued item was tested. Experiment 1 and 2 were directed at discovering whether spider fearfuls and non-anxious controls would differ with respect to the accuracy in memorizing cued spiders and uncued spiders and, thus, reveal disorder-specific biases of VWM. In addition, the question whether the presence of a spider image is related to costs for the memorization of other images was tested. Experiment 3 addressed whether any disorder-specific VWM biases found earlier were specific to the feared spiders. Therefore, the critical stimuli here were a snake and a spider. Participants were spider fearfuls and non-anxious controls, both without snake anxiety. In Experiment 4, it was tested whether disorder-specific biases found in Experiment 1 and 2 were modifiable through cognitive-behavioral treatment. The critical stimulus was a spider image. Spider fearfuls were tested three times. Half of them received a cognitive-behavioral intervention after the first test, the other half only after the second test. In two additional experiments, VWM was assessed with a change-detection paradigm. The main aim was to clarify whether disorder-specific effects found in the previous experiments were associated with automatic or with strategic selective encoding of threatening materials, and whether any group differences in spider change detection were materials-specific
SUMMARY
229
to spiders, but not to snakes. In Experiment 5, several images were presented simultaneously in a study display for either 100 or 500 milliseconds. After a short interruption, a test display was presented including either the same items as the first one or one changed item. Participants’ accuracy in determining whether displays were the same or different was measured depending on the valence of the changed item, set size, and presentation time of the display. There were trials with and without spiders. If a change was made, it could involve either a non-spider or a spider item. Of specific interest was the condition in which a spider image was presented initially, but not in the test phase, as noticing this specific change would require storage of that image in VWM. Would group differences be particularly pronounced in the shorter encoding condition suggesting automatic encoding of threat, or would they occur in the longer encoding condition, suggesting strategic encoding of spiders? In Experiment 6, change detection accuracy for spiders vs. snakes was tested. The participants in both experiments were spider fearfuls vs. controls, but those of Experiment 6 were additionally required to lack snake anxiety. Moreover, a temporal VWM paradigm - an attentional blink task - was applied to assess whether a biased encoding of spider images in spider fearfuls would occur at the expense of non-threatening items undergoing concurrent processing, and whether this effect was specific to spiders, but not to snakes. Series of real-object pictures were presented at rates of 80 ms at the display center. The observer’s task was to identify and report the two target pictures indicated by a brighter background. In Experiment 7, the first target always depicted a neutral item. The valence of the second target was varied - either negative depicting a spider, positive, or neutral. Participants varied with respect to their spider anxiety. In Experiment 8, spider fearfuls and non-anxious controls, both without snake anxiety, were tested. The experiment was nearly the same as the previous one, but two negative target types were tested: disorder-relevant spiders and negative but not feared snakes. Of specific interest was whether the appearance of a threatening target would reduce the report probability of the earlier attended target, indicating the interruption of its VWM encoding in favor of the threat item. RESULTS. (1) Both anxious and non-anxious controls, showed VWM advantages for negative materials such as spider or snake images. (2) In addition, there were disorderspecific VWM biases: some effects were larger in spider fearfuls than in non-anxious controls and some effects occurred exclusively in spider fearfuls. (3) Group differences and, thus, disorder-specificity were particularly pronounced under competitive circumstances, that is, under the condition of numerous stimuli competing for processing resources: when only little orientation time was allowed, when only little time was provided for selecting and encoding items from a crowd, and when VWM for the critical item required reflexive instead of voluntary attention. (4) Pronounced memory for task-relevant, voluntarily attended spiders was related to difficulties in disengaging attention from these items in the fearful group,
SUMMARY
230
reflected in reduced memory accuracy for the item following it. (5) Disorder-specific VWM biases seem to be based on attentional biases to threatening materials resulting in a very quick, automatic memory consolidation. However, this preferential encoding was not at the cost of neutral materials currently undergoing encoding processes. (6) All disorder-specific VWM biases occured only with fear-related materials, not with other negative materials. (7) Automatic and highly disorder-specific fear-related VWM biases – but not strategic VWM biases occuring in both groups - were modifiable through cognitive-behavioral intervention. CONCLUSIONS. This work provides additional information about informationprocessing distortions related to specific anxiety. With the experimental investigation of biased VWM, this work has been performed to fill a gap within research on cognitive biases in anxiety. Moreover, this dissertation contributes to cognitive theories of anxiety by proposing several recommendations for refinements of current theoretical approaches. Most important, it was suggested to extend existing models by a more detailed consideration of attention and memory. In view of numerous previous empirical studies on the topic and the conclusions of this dissertation, a differentiation of the attentional engagement and disengagement component appears inevitable. Even more important, in view of the data presented here predictions concerning VWM for threatening materials need to be taken into account. In addition, suggestions are provided for the differential consideration of biases occuring from prepotent threat value of negative stimuli vs. individual threat value. A proposal for a cognitive model of anxiety extended by all these aspects is provided to serve as an invitation of further research in the investigation of the nature of memory biases in anxiety disorders. REFERENCES: Cowan, N. (1995). Attention and Memory. An integrated framework.New York: Oxford University Press. Fox, E., Russo, R., & Dutton, K. (2002). Attentional bias for threat: Evidence for delayed disengagement from emotional faces. Cognition and Emotion, 16, 355-379. MacLeod, C., & Mathews, A. (2004). Selective memory effects in anxiety disorders: An overview of research findings and their implications. In D. Reisberg & P. Hertel (eds.), Memory and Emotion. Oxford: Oxford University Press. Mathews, A., & Mackintosh, B. (1998). A cognitive model of selective processing in anxiety. Cognitive Therapy and Research, 22 (6), 539-560. Mathews, A., & MacLeod, C. (2005). Cognitive vulnerability to emotional disorders. Annual Review of Clinical Psychology, 1, 167-195.Mathews, Mogg, May, & Eysenck (1989). Mogg, K., Bradley, B.P., Miles, F., & Dixon, R. (2004). Time course of attentional bias for threat scenes: Testing the vigilance avoidance hypothesis. Cognition and Emotion, 18(5), 689-700. Williams, J.M.G., Watts, F.N., MacLeod, C., & Mathews, A. (1997). Cognitive psychology and emotional disorders. Chichester: John Wiley.