Citation: Firme, G. F., E. L. Rue, D. A. Weeks, K. W. Bruland, and D. A. Hutchins, Spatial and temporal variability in phytoplankton iron limitation along the ...
GLOBAL BIOGEOCHEMICAL CYCLES, VOL. 17, NO. 1, 1016, doi:10.1029/2001GB001824, 2003
Spatial and temporal variability in phytoplankton iron limitation along the California coast and consequences for Si, N, and C biogeochemistry Giselle F. Firme1 College of Marine Studies, University of Delaware, Lewes, Delaware, USA
Eden L. Rue, Debra A. Weeks, and Kenneth W. Bruland Institute of Marine Sciences, University of California at Santa Cruz, Santa Cruz, California, USA
David A. Hutchins College of Marine Studies, University of Delaware, Lewes, Delaware, USA Received 1 November 2001; revised 29 April 2002; accepted 1 July 2002; published 18 February 2003.
[1] Iron limitation was investigated along the Northern California coast in the summer of
1999. Small-volume (1 l) shipboard iron addition bottle experiments were performed at 44 stations to gain the greatest possible temporal and spatial coverage of the area. Parameters measured in these 4-day incubations included size-fractionated chlorophyll a and particulate nutrients (C, N, and Si). Degrees of community iron limitation were quantified and compared using various iron limitation indexes, calculated as the ratio of chlorophyll a, particulate organic nitrogen, or particulate organic carbon produced in Fe-amended bottles to the amounts produced in controls. Iron limitation occurred most frequently and was most severe on stations off the continental shelf, away from sedimentary sources of iron, as well as during relaxation events in aged upwelled water. Size-fractionated chlorophyll a data did not suggest large Fe-mediated changes in phytoplankton community composition. Fe limitation reduced phytoplankton production of particulate organic nitrogen and carbon, but had much less effect on biogenic silica production. The result is an increase in particulate Si:N and Si:C ratios of control samples, which were frequently double those of Fe-amended samples. Particulate C:N ratios also decreased under Fe limitation, indicating that iron availability exerts a strong control on C, N, and Si elemental composition of phytoplankton, and thus on the biogeochemical INDEX TERMS: 4279 cycling of these nutrients in the California upwelling region. Oceanography: General: Upwelling and convergences; 4805 Oceanography: Biological and Chemical: Biogeochemical cycles (1615); 4845 Oceanography: Biological and Chemical: Nutrients and nutrient cycling; 4875 Oceanography: Biological and Chemical: Trace elements; KEYWORDS: iron limitation, coastal upwelling, nutrient ratios, phytoplankton, nitrate, silicate Citation: Firme, G. F., E. L. Rue, D. A. Weeks, K. W. Bruland, and D. A. Hutchins, Spatial and temporal variability in phytoplankton iron limitation along the California coast and consequences for Si, N, and C biogeochemistry, Global Biogeochem. Cycles, 17(1), 1016, doi:10.1029/2001GB001824, 2003.
1. Introduction [2] Areas of active coastal upwelling constitute only 1% of the ocean’s surface area, but are responsible for the highest areal primary productivity rates in the ocean [Chavez and Barber, 1987; Toggweiler and Carson, 1995]. Upwelling off California is most intense during the spring and summer, when predominant winds blow southward. These 1
Now at University of Hawaii, Honolulu, Hawaii, USA.
Copyright 2003 by the American Geophysical Union. 0886-6236/03/2001GB001824
seasonal winds displace the surface coastal water offshore and supply nutrients to the euphotic zone by Ekman transport [Dever, 1997]. Because upwelling events are not constant, the system goes through intercalating upwelling and relaxation events that can last up to 3 weeks [Dugdale and Wilkerson, 1989]. During upwelling, nutrients are plentiful in the euphotic zone, but turbulence and deep mixing can prevent phytoplankton blooms from occurring until relaxation occurs. Diatoms are usually the dominant phytoplankton group following an upwelling event, and these extensive blooms eventually exhaust nitrate, phosphate, and silicic acid from surface waters [Brzezinski et al., 1997; Bruland et al., 2001]. At this point, community structure often switches
16 - 1
16 - 2
FIRME ET AL.: SPATIAL AND TEMPORAL VARIABILITY IN PHYTOPLANKTON IRON
to a nanoplankton dominated phytoplankton community growing primarily on recycled nutrients [Hutchins and Bruland, 1998]. [3] Until recently, most work in coastal upwelling systems did not consider the effects of phytoplankton iron limitation because upwelling, river outflows, and continental atmospheric dust were assumed to supply ample inputs of iron to the system. We now know that iron limitation can affect productivity in both the California region [Hutchins and Bruland, 1998; Hutchins et al., 1998; Bruland et al., 2001] and the Peru upwelling [Hutchins et al., 2002] because iron inputs during the upwelling season are limited. [4] Riverine outflow in the summer is at a minimum, and sedimentary iron from shelf areas entrained during upwelling is the primary source of iron. Iron supply thus depends on the degree of interaction between the upwelled water parcel and the continental shelf [Johnson et al., 1999, 2001; Bruland et al., 2001]. Wide ranges of Fe availability are expected off the California coast, since its bathymetry is not uniform. The shelf is relatively wide and shallow in areas such as Monterey Bay, off San Francisco Bay, and Point Arena (PA). In other areas the shelf is much narrower and drops off quickly, reaching 500 m depth within 3 km off the coast of Big Sur (BS). The water parcel being upwelled will have a limited interaction with narrow shelves compared with wide shelves, leading to large variations in the amount of iron being carried into lighted surface waters. Narrow shelf areas are likely to become Fe-limited once phytoplankton blooms develop and deplete the relatively small amount of iron available [Hutchins et al., 1998; Johnson et al., 2001; Bruland et al., 2001]. [5] In previous shipboard incubation experiments in parts of the Northern California coast where the shelf is narrow, phytoplankton growth rates and biomass in bottles with Fe added were higher than in controls. Molar Si:N (silicic acid:nitrate) uptake ratios in control samples were at least twice those of Fe-amended samples [Hutchins and Bruland, 1998; Hutchins et al., 1998]. Because Fe limitation appears to reduce nitrate uptake and carbon fixation rates much more than silicic acid uptake rates, Fe-limited diatoms often have much higher Si:N and Si:C uptake ratios in both laboratory studies and in Fe-limited regimes [Hutchins and Bruland, 1998; Takeda, 1998; Franck et al., 2000]. Iron-replete diatoms often have a molar Si:N uptake ratio close to 1 [Brzezinski, 1985], whereas iron-limited diatoms frequently have a much higher (2 – 3�) ratio [Hutchins and Bruland, 1998]. However, a quantitative relationship between the extent of diatom Fe limitation and variations in particulate Si:N and Si:C production ratios has not been established. [6] The variability in phytoplankton Fe limitation and nutrient drawdown ratios in the California upwelling region is likely to be large, since the system is highly heterogeneous in both space and time. Hutchins et al. [1998] suggested that this region is a complex ‘‘mosaic’’ of iron availabilities that results in a broad range of biological effects, from ironreplete to severely iron-starved conditions. This previous incubation work demonstrating Fe limitation in the region, however, focused on only a few selected stations and could give little indication of how important this process is over
larger scales. Here, we use a ‘‘mapping’’ approach to examine the varying degrees of iron limitation on much larger temporal and spatial scales, and the resulting consequences for phytoplankton community Si:N, Si:C, and C:N ratio variability along the California coast. [7] Survey approaches have been used to examine phytoplankton Fe limitation over regional scales in the past. In particular, the diagnostic indicator Fv/Fm, representing the photosynthetic electron transfer efficiency of algal photosystem II, has been assessed by shipboard fast repetition rate fluorometry (FRRF) in order to map the extent of Fe limitation in surface waters [Kolber et al., 1994; Behrenfeld and Kolber, 1999]. Although Fv/Fm is a sensitive, noninvasive way to interrogate the phytoplankton community, it cannot predict the effects of varying degrees of iron limitation on major nutrient biogeochemistry and algal elemental stoichiometry. To do this, iron addition experiments are necessary. [8] Our approach was to generate an extensive spatial and temporal coverage of the central California upwelling area by performing as many Fe addition experiments as possible during a 5-week occupation of the region. This mapping approach allowed us to examine fine-scale variability in Fe limitation effects, and to correlate these quantitatively with the observed response of major nutrient biogeochemistry. Experiments were carried out at both near-shore and offshore stations, and during active upwelling and full relaxation. [9] It has become evident that phytoplankton iron limitation is not a simple ‘‘on and off’’ phenomenon but is more accurately represented as a wide gradient from completely iron-sufficient to severely iron-starved conditions [Hutchins et al., 1998]. In order to quantify the degree of iron limitation in our experiments and correlate this with nutrient utilization ratios, an index was designed to compare parameter values between +Fe and control treatments. The iron limitation index (ILI) was defined as the ratio of the production of chl a (ILIChl), PON (ILIPON), or POC (ILIPOC) in the +Fe bottles to the change in the same parameters in the controls. An ILI value of one represents no difference between amounts of chlorophyll (chl), particulate organic nitogen (PON), or particulate organic carbon (POC) produced in iron-amended and control bottles, and therefore no Fe limitation. Higher values of these three types of ILI indicate progressively greater degrees of iron limitation. The results of these experiments are intended to provide a much more comprehensive and quantitative view of coastal upwelling iron limitation than had been previously available. The relationship between ambient Fe concentrations and the extent to which phytoplankton communities are Fe-limited is examined over large temporal and spatial scales. Control of phytoplankton elemental ratios by iron availability has global biogeochemical consequences [Boyle, 1998], and this work thus also contributes to the emerging picture of the effects of iron on major nutrient utilization and carbon cycling throughout the world ocean.
2. Methods [10] The California coast was studied for 5 weeks on two different occasions. During the first leg of the cruise
FIRME ET AL.: SPATIAL AND TEMPORAL VARIABILITY IN PHYTOPLANKTON IRON
(CIRCUS), from 3 to 17 June, 25 stations were sampled. The second leg of the cruise (SQUIRTS) took place between 23 June and 11 July, when 19 more stations were studied. To differentiate between experiments started at different stations, CIRCUS growouts are numbered sequentially and SQUIRTS experiments are designated GO (for growout) followed by the station number. [11] The extensive spatial and temporal coverage of the area was achieved by simple 4-day, 1-l bottle incubations begun at as many as five stations each day, with up to 10 experiments carried out concurrently. Near-surface water (5 – 10 m) was collected for the incubation experiments using an acid-washed all-teflon Osmonic Bruiser diaphragm pump system [Hutchins et al., 1998; Bruland et al., 2001]. Collected water was homogenized in a 50-l acid-washed carboy using trace metal clean techniques, and dispensed into acidwashed 1 l polycarbonate control and +Fe bottles. During the first leg all experiments were performed in triplicates, and during the second leg duplicate control and Fe-amended samples were used. Iron was added at 2.5 nM as inorganic FeCl3 in 0.1 M Ultrex HCl. Experiments were incubated for 4 days in spectrally corrected flow-through deckboard incubators at 40% of incident light at ambient sea-surface temperatures [Laws et al., 1990; Hutchins et al., 1993]. At the beginning and end of each experiment, we measured sizefractionated chlorophyll a by filtering water through 0.2, 1.0, and 8.0 mm polycarbonate filters, followed by extraction in 90% acetone for 24 hours and shipboard fluorescence measurements [Yentsch and Menzel, 1963] using a Turner AU-10 fluorometer. [12] Samples for dissolved nutrients (nitrate + nitrite and silicic acid) were filtered through a 0.2 mm filter and frozen for analysis on shore using a Technicon II Autoanalyzer [Friederich and Whitledge, 1972] during the first leg. During the second leg nutrients were measured on board using a Lachat autoanalyzer. Particulate nutrient (CHN) samples were filtered through precombusted 13-mm GF/F glass filters and the filters were frozen for analysis on shore according to the method described by Sharp [1991], using a Carlo Erba, Inc., CHNS-O EA 1108 Elemental Analyzer [Hutchins et al., 1998]. [13] Samples for biogenic silica (BSi) were filtered through 0.6-mm polycarbonate filters and dried at 65�C on board for 48 hours before being stored at room temperature [Franck et al., 2000]. Biogenic silica samples were analyzed on shore by digesting filters in 0.2 M NaOH at 95�C for 1 hour [Paasche, 1973] followed by the addition of 1N HCl to stop the reaction. The resulting dissolved silicic acid was then determined according to the method of Strickland and Parsons [1972], as modified by Brzezinski and Nelson [1995]. BSi:PON, BSi:POC, and PON:POC production ratios were then calculated and compared between treatments and stations [Hutchins and Bruland, 1998]. These data sets were also compared with those from the same experiments for ILI. [14] ILIs were determined by calculating the increases in chlorophyll a, PON, and POC in the +Fe and control samples, and dividing the resulting +Fe values by the control values, yielding a +Fe/control production ratio for each parameter (ILIChl, ILIPON, and ILIPOC). Although any ILI value >1 indicates greater production in the +Fe bottles than in the
16 - 3
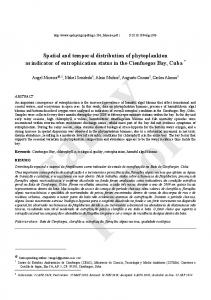
Figure 1. Iron limitation indexes (ILI) using (a) chlorophyll a, (b) particulate organic nitrogen, and (c) particulate organic carbon versus ambient dissolved iron concentration during the CIRCUS cruise. The ILI is defined as the ratio of the change in these parameters in the +Fe treatments to the change in the controls. Note the scale difference in Figure 1c. controls, we considered only experiments with ILI values >1.3 to be significantly iron limited. This cutoff value was determined by statistical tests of the 44 experiments using ANOVA, and represents a 90% confidence level. [15] Dissolved iron concentrations for the first leg of the cruise (CIRCUS) were measured by flow injection analysis [Weeks and Bruland, 2002]. During SQUIRTS, total dissolved iron was measured by cathodic stripping voltammetry methods [Rue and Bruland, 1995, 1997]. In both cases, seawater samples for total dissolved Fe measurements were 0.2 mm-filtered, acidified to pH 1.7 – 1.8, and microwaved prior to analysis [Bruland and Rue, 2001], releasing even relatively refractory (i.e., colloidal) Fe for analysis.
3. Results 3.1. Iron Limitation Indexes [16] ILI values versus dissolved iron concentrations for the CIRCUS leg are presented in Figure 1 and for SQUIRTS in
16 - 4
FIRME ET AL.: SPATIAL AND TEMPORAL VARIABILITY IN PHYTOPLANKTON IRON
ity responded to iron deprivation. We do not believe this difference is due to an analytical artifact or contamination. There may have been actual differences in iron concentrations between the two occasions the California coast was sampled, and/or in biological communities and their response to Fe additions. For instance, higher total Fe values similar to those of CIRCUS were observed during the second leg of SQUIRTS (data not shown), although incubation experiments were not carried out during this later part of the cruise, since there was insufficient time to complete the incubations.
Figure 2. ILI using (a) chlorophyll a, (b) particulate organic nitrogen, and (c) particulate organic carbon versus ambient dissolved iron concentration during the SQUIRTS cruise. Note the scale difference in Figure 2a. Figure 2. There is a strong relationship between dissolved iron concentrations and ILIChl (Figures 1a and 2a), ILIPON (Figures 1b and 2b), and ILIPOC (Figures 1c and 2c). In all three cases there were no differences between treatments at iron concentrations >0.6 nM on the CIRCUS leg and >0.2 nM on the SQUIRTS leg. However, when concentrations were