Kohyama et al. Zoological Letters (2015) 1:13 DOI 10.1186/s40851-015-0013-4
RESEARCH ARTICLE
Open Access
Spatial and temporal variation at major histocompatibility complex class IIB genes in the endangered Blakiston’s fish owl Tetsuo I Kohyama1, Keita Omote2, Chizuko Nishida1, Takeshi Takenaka3, Keisuke Saito4, Satoshi Fujimoto5 and Ryuichi Masuda1*
Abstract Introduction: Quantifying intraspecific genetic variation in functionally important genes, such as those of the major histocompatibility complex (MHC), is important in the establishment of conservation plans for endangered species. The MHC genes play a crucial role in the vertebrate immune system and generally show high levels of diversity, which is likely due to pathogen-driven balancing selection. The endangered Blakiston’s fish owl (Bubo blakistoni) has suffered marked population declines on Hokkaido Island, Japan, during the past several decades due to human-induced habitat loss and fragmentation. We investigated the spatial and temporal patterns of genetic diversity in MHC class IIβ genes in Blakiston’s fish owl, using massively parallel pyrosequencing. Results: We found that the Blakiston’s fish owl genome contains at least eight MHC class IIβ loci, indicating recent gene duplications. An analysis of sequence polymorphism provided evidence that balancing selection acted in the past. The level of MHC variation, however, was low in the current fish owl populations in Hokkaido: only 19 alleles were identified from 174 individuals. We detected considerable spatial differences in MHC diversity among the geographically isolated populations. We also detected a decline of MHC diversity in some local populations during the past decades. Conclusions: Our study demonstrated that the current spatial patterns of MHC variation in Blakiston’s fish owl populations have been shaped by loss of variation due to the decline and fragmentation of populations, and that the short-term effects of genetic drift have counteracted the long-term effects of balancing selection. Keywords: Balancing selection, Bubo blakistoni, Genetic drift, MHC class IIβ, Pyrosequencing
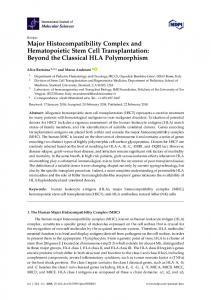
Introduction Blakiston’s fish owl (Bubo blakistoni Seebohm; hereafter ‘fish owl’), the world’s largest owl, is currently categorized as ‘Endangered’ on the IUCN Red List of Threatened Species [1]. This owl is non-migratory and endemic to northeastern Asia, comprising two subspecies: B. b. blakistoni in central and eastern Hokkaido and the southern Kuril islands; B. b. doerriesi in continental Asia, including the Russian Far East, northeastern China, and probably North Korea (Figure 1) [2]. Unlike many other owl species, the fish owl is specialized to aquatic prey, mainly * Correspondence:
[email protected] 1 Department of Natural History Sciences, Faculty of Science, Hokkaido University, Sapporo 060-0810, Japan Full list of author information is available at the end of the article
freshwater fishes, and thus its habitat is limited to areas close to lakes, rivers, springs, and shoals that do not freeze in winter. In addition, it requires large, old trees with large cavities for nesting [2-4]. Over the last several decades, riparian old-growth forests, the preferred habitat for the fish owl, have been decimated due to human land use, causing a rapid decline in fish owl populations. The current population size of the fish owl is estimated to be 120–150 individuals in Hokkaido, 70–85 in the southern Kuril Islands, and a few thousand in continental Asia [2,3,5]. The fish owl was widespread in Hokkaido until the middle of the 20th century [3,6], but its population has decreased markedly over the last several decades due to human-induced habitat loss and fragmentation, and probably fell to fewer than 100
© 2015 Kohyama et al.; licensee BioMed Central. This is an Open Access article distributed under the terms of the Creative Commons Attribution License (http://creativecommons.org/licenses/by/4.0), which permits unrestricted use, distribution, and reproduction in any medium, provided the original work is properly credited. The Creative Commons Public Domain Dedication waiver (http://creativecommons.org/publicdomain/zero/1.0/) applies to the data made available in this article, unless otherwise stated.
Kohyama et al. Zoological Letters (2015) 1:13
60˚N (A) Continental Asia
Page 2 of 12
(B) 400
0 Km
0
Sea of Okhotsk 50 100 Km
SR Kuril Islands
Hokkaido 50˚N
Sea of Japan AK
DS
KS
HD
40˚N
Pacific Ocean 130˚E
140˚E
150˚E
Figure 1 Distribution of Blakiston’s fish owl and sampling sites of the populations investigated. (A) Global distribution of Blakiston’s fish owl (dark area), modified from Slaght and Surmach [2]. (B) Sampling sites in the present study. Population abbreviations: SR, Shiretoko; KS, Konsen; AK, Akan; DS, Daisetsu; HD, Hidaka.
individuals in the 1970–80s [7]. A project began in the early 1980s aimed at conservation of the fish owl, through the installation of nest boxes and artificial feeding. Thanks to these efforts, the Hokkaido population is now gradually recovering, but the risk of extinction remains high due to the loss of adaptive genetic variation and inbreeding depression in highly fragmented populations. Recent population genetic studies using selectively neutral markers such as mitochondrial DNA (mtDNA) sequences and microsatellite genotypes revealed low overall genetic diversity in Hokkaido fish owl populations [8,9]. These studies also detected genetic differentiation among fragmented populations, indicating limited movement of owls between areas. In contrast, mtDNA sequence analyses of historical specimens, including taxidermied specimens and archaeological bones, indicated that gene flow had occurred over a broad area of Hokkaido until the middle of the 20th century [9]. Both the mtDNA and microsatellite data showed a sharp reduction in genetic diversity after around 1980 [9]. The low levels of genetic variation and genetic differentiation among subpopulations currently inhabiting Hokkaido are probably due to genetic drift and inbreeding resulting from habitat loss and fragmentation. The major histocompatibility complex (MHC) is a multigene family that plays a crucial role in the vertebrate immune system. It contains genes coding for cellsurface glycoproteins, the MHC class I and II molecules, each of which is specifically involved in presenting antigen peptides derived from intra- or extracellular pathogens to T cells, initiating the adaptive immune response [10]. These genes are among the most polymorphic in
the vertebrate genome, exhibiting high allelic diversity [11]. MHC polymorphism is generated by frequent gene duplications and deletions, intra- and inter-locus recombination or gene conversion, and the accumulation of de novo mutations [12,13]. In addition, the enormous variation in MHC genes is probably maintained by pathogen-driven balancing selection, mediated through either heterozygote advantage or negative frequencydependent selection, and by sexual selection via MHCmediated disassortative mating (reviewed in [14-17]). Although balancing selection shapes MHC polymorphism to a great extent over the long term, MHC variation is often substantially reduced in populations that have undergone extreme bottlenecks (e.g., [18-21]). Habitat fragmentation may further accelerate the reduction in MHC diversity by strengthening the effects of genetic drift (e.g., [22-24]). Although the effects of reduced MHC diversity on the long-term viability of populations that undergo bottlenecks has remained unclear (reviewed in [25]), the example of contagious cancer in Tasmanian devils (Sarcophilus harrisii) strongly supports the possibility that populations with low MHC diversity are more vulnerable to outbreaks of novel infectious diseases (reviewed in [26]). Quantifying MHC diversity can thus provide an indirect measure of the immunological fitness (i.e. the potential of resistance to novel infectious diseases) of a population, and should thus be incorporated into studies of endangered species aimed at establishing conservation plans [27,28]. The first comprehensive information on the genomic structure of the MHC in birds came from studies of the domestic chicken, Gallus gallus [29]. The chicken MHC
Kohyama et al. Zoological Letters (2015) 1:13
is more compact than the mammalian MHC; it has only two classical MHC class I and II genes, which is referred as ‘the minimal essential MHC’ [29]. This compact MHC structure has been reported in various bird lineages (e.g., [30-35]), but is not universal in birds. The Japanese quail (Coturnix japonica) appears to have a more complex MHC structure [36] than the chicken, even though the two belong to the same family. A highly complex MHC structure has been reported in passerine species, which commonly have many copies of both class I and II MHC genes and a large number of pseudogenes (e.g., [37-40]). The considerable variation among bird taxa suggests that the avian MHC structure is evolutionarily labile, probably due to recent gene duplications and pseudogene formation [41]. In the present study, we investigated the genetic diversity of the MHC class IIβ loci in Hokkaido fish owl populations, based on samples collected from 1963 to 2012. We used massively parallel pyrosequencing [42,43] for exhaustive genotyping of the fish owl MHC class IIβ loci. Our aims were (1) to describe the polymorphism at second exon of MHC class IIβ genes in the fish owl, and (2) to elucidate spatial and temporal patterns in the MHC diversity in order to assess how the recent population decline associated with habitat loss and fragmentation have affected variation in these functional genes.
Materials and methods Sampling and DNA extraction
From 1963 to 2012, blood or skin tissue samples were collected from 200 individuals of the fish owl from five geographically isolated populations across Hokkaido: Shiretoko (SR), Konsen (KS), Akan (AK), Daisetsu (DS), and Hidaka (HD) populations (Figure 1). Most samples were from firstyear juveniles, though some were from adults. All blood samples were non-invasively collected from owls by a veterinarian in the activity for conservation of the Blakiston’s fish owl by the Ministry of the Environment, Japan. Some drops of the blood samples were preserved in 99.9% ethanol or dried on filter paper, and stored at −20°C. Fibroblasts were cultured from skin tissue samples according to the method described in Nishida et al. [44]. Total genomic DNA was extracted from blood and fibroblasts with the DNeasy Blood & Tissue Kit (Qiagen). RNA extraction and cDNA synthesis
For expression analysis, total RNA was extracted with the RNeasy Mini Kit (Qiagen) from skin fibroblasts from 16 Hokkaido individuals. First-strand cDNA was synthesized from 1 μg of total RNA using the oligo-(dT)20 primer with the Superscript III First-strand Synthesis System (Invitrogen). The expression of MHC class II molecules in skin fibroblasts was confirmed through polymerase chain reaction (PCR) using the primers
Page 3 of 12
Sf-ex1F (5′-CAC TGG TGG TGC TGG GAG CC-3′) and Tyal-ex3-3′R (5′-AGG CTG ACG TGC TCC ACC TG-3′), which bind in conserved regions of exons 1 and 3 of owl MHC class II loci [32,45]. Primer design
To develop specific primers for pyrosequencing, complete and partial sequences of the second exon of the MHC class IIβ loci were amplified from several individuals from different populations in Hokkaido and from different years by using the primer sets Sf-ex1F and Tyal-ex3-3′R, and Stri2FC (5′-CMC ACA CAG GGG TTT TCC-3′) and Stri2RC (5′-AAC GYG YGG CCA CGC GCT CA −3′) [30]. Six cDNA and 10 genomic DNA samples were used as PCR templates. PCR amplifications were performed in 25-μl reaction volumes, each containing 0.5 units of high-fidelity PrimeSTAR GXL DNA Polymerase (TaKaRa Bio), 1 × PrimeSTAR GXL buffer, 200 μM each dNTP, 1 μM each primer, and approximately 200 ng of cDNA or 50 ng of genomic DNA. Cycling conditions were 98°C/1 min, 28 × (98°C/ 10 s, 68°C/30 s), 68°C/3 min for Sf-ex1F and Tyal-ex3-3′R; and 98°C/1 min, 28 × (98°C/10 s, 58°C/10 s, 68°C/30 s), 68°C/3 min for Stri2FC and Stri2RC. Because the genomic sequences of the MHC class IIβ region are extraordinarily GC-rich in avian species, we used high annealing temperature to increase the efficiency of amplifications as recommended in Burri et al. [46]. PCR products were cloned using the Zero Blunt TOPO PCR Cloning Kit (Invitrogen), and 24–48 clones per sample were sequenced with the BigDye Terminator v3.1 Cycle Sequencing Kit (Applied Biosystems) and an ABI 3730 DNA Analyzer (Applied Biosystems). From consensus sequences for the sequences obtained, specific primers were designed to amplify part of the second exon of the fish owl MHC class IIβ loci. Preparation of an amplicon library and pyrosequencing
Pyrosequencing was performed on 242 amplicons obtained from 200 genomic DNA samples and 16 cDNA samples. To generate an amplicon library, fusion primers were designed that contained the GS FLX Titanium primer sequence (A in forward, B in reverse primers) at the 5′ end, followed by a 10-bp multiplex identifier (MID) sequence and the sequence of a gene-specific primer. The MID sequences were chosen from the Extended MID Set (Roche) and were used to distinguish amplicons obtained from different PCR reactions. For genomic DNA samples, newly designed primers BublIIb2F (5′-GAG TGT CAG YAC CTY RAY RG-3′) and BublIIb2R (5′-CTT TCY TCT SCS TGA YGW AGG-3′) were used as forward and reverse gene-specific primers to amplify 203-bp fragments of the second exon of MHC class IIβ loci ([see Additional file 1: Figure S1]). Ten genomic DNA samples were amplified and sequenced twice to estimate
Kohyama et al. Zoological Letters (2015) 1:13
the genotyping error. For cDNA samples, we used 2 reverse primers (BublIIb2-3R1, 5′-TTC CAC CTC GGG CGG GAC TTT C-3′; BublIIb2-3R2, 5′-CCT CAC CTT GGG CTG AAC TTT C-3′) that spanned the exon-exon junction between the second and third exons. PCR was conducted twice for each cDNA sample to amplify 213-bp fragments, using the fusion primer pairs containing the sequences of BublIIb2F/BublIIb2-3R1 and BublIIb2F/ BublIIb2-3R2. PCR conditions were 98°C/1 min, 28 × (98°C/10 s, 58°C/ 10 s, 68°C/30 s), and 68°C/3 min. PCR amplicons were purified by using the MinElute PCR Purification Kit (Qiagen). After quantification by agarose-gel electrophoresis, the purified amplicons were pooled in approximately equimolar quantities. The amplicon library was commercially sequenced on a 1/4 Titanium Pico Tire Plate with the GS FLX Titanium Sequencing Kit XLR70 (Roche) at Hokkaido System Science Co. (Sapporo, Japan). MHC genotyping
SFF Tools 2.8 (Roche) was used to assign the processed reads to respective individuals based on the MID sequences in the forward and reverse fusion primers, and seq_crumbs 0.1.8 (available from http://bioinf.comav.upv.es/seq_crumbs/) was used to trim and filter sequence reads based on quality and sequence length. Allele detection and genotyping were performed with the recently developed pipeline ngs_genotyping 0.9.0 ([47]; available from https://github.com/enormandeau/ ngs_genotyping). This pipeline uses an iterative procedure in three successive steps. The first step generates putative allele sequences for each individual. The second step combines and strengthens these into the global alleles for all individuals. The third step then genotypes each individual. Prior to these steps, sequence reads were iteratively cleaned and aligned by means of the MUSCLE algorithm [48]. Throughout the text, unique sequence variants are referred to as ‘alleles’ for convenience, although this is not strictly correct, as these sequences represent multiple loci. The following parameters were used with a hierarchical clustering analysis in the first step of the pipeline to filter out sequencing errors and to detect putative alleles: minimum internal branch length, 0.06; minimal proportion threshold to define the cluster, 0.02. Likewise, the following parameters were used to detect global consensus alleles in the second step: minimum internal branch length, 0.06; minimum number to define the cluster, two sequences. In the third step, the number of sequence reads of each global allele was counted for each individual by using the BLASTn algorithm. Each individual was then genotyped according to the minimal proportion threshold of each allele. Threshold values ranging from 0.01 to 0.05 were used, depending on
Page 4 of 12
natural breaks in the number of reads per individual for each allele. The above settings of the threshold values in the pipeline meet the two-PCR criterion that is standard in MHC studies [49]. Data analysis
Phylogenetic relationships among the fish owl MHC class IIβ alleles were reconstructed by Bayesian inference and maximum likelihood (ML) analyses, using the programs MrBayes 3.2.2 [50] and GARLI 2.01 [51]. The best-fit model of nucleotide substitution was selected based on the Bayesian information criterion implemented in jModelTest 2.1.1 [52]. MrBayes analyses were performed with two parallel runs of 20 million generations each and using one cold and three heated Markov chains, with sampling every 1000 steps. Convergence and stationarity of the chains were confirmed by the average standard deviation of split frequencies ( 1 exceeded 0.95 in both independent subsample run sets. The detection of potential recombinant sequences in our data set was carried out using a set of seven nonparametric detection methods implemented in RDP4 beta 4.27 software [56]: RDP, GENECONV, MaxChi, Chimaera, BootScan, SiScan, and 3Seq. The analysis was performed with default settings for the various detection methods, and the Bonferroni-corrected P value cutoff was set at 0.05. Recombination events were accepted when detected with at least three of the seven detection methods. Additionally, the web-based service GARD (genetic algorithm for recombination detection) [57] was used to detect recombination breakpoints. Population-level allelic richness was calculated through 1000 bootstrap replicates with a constant sample size (n = 4). Nucleotide diversity (π) within individuals and populations were calculated using MEGA. To assess the MHC diversity within and between populations, R 3.0.1 [58] with the package ecodist 1.2.7 [59] was used to calculate Jaccard distances from a binary presence/absence matrix for each allele in pairwise comparisons of individuals. Jaccard dintance is the measure of dissimilarity between sample sets, and is defied as one minus ratio of the size of the intersection and union of the sample sets [60]. Non-metric multidimensional scaling (NMDS) was performed to visualize the relationships among individual MHC genotypes based on Jaccard distances. To assess the genetic differentiation among populations, global and population pairwise GST values [61] were estimated from allele frequencies, using the mmod package version 1.2.1 [62] in R. The significance of the GST values were evaluated with the permutation tests (1000 replicates). Finally, an analysis of molecular variance (AMOVA) [63] was conducted to evaluate the spatial and temporal patterns of genetic variations, using the ade4 package version 1.6-2 [64] in R. An AMOVA was performed with two different genetic distance matrixes calculated in pairwise comparison of individuals: 1) Jaccard distance, and 2) average number of nucleotide substitutions per site between individuals, calculated with the Kimura 2-parameter model. The total genetic variance was partitioned into three hierarchical levels: among populations, between periods within populations, and within periods. The significance of the variance components were assessed with the permutation tests (1000 replicates).
Results Genotyping of fish owl MHC class IΙβ
Amplification primers with the complete MID sequences were identified in 193,393 reads. Final genotypes were
Page 5 of 12
based on 139,832 reads; the mean coverage (number of reads per amplicon) was 577.8 reads (SD = 307.7, range = 34–1851). For conservative genotyping, individuals with fewer than 200 reads were excluded from the analysis. No correlation between the number of reads and the number of alleles observed per individual was detected in the remaining samples ([see Additional file 1: Figure S2]), indicating that the coverage was sufficient for reliable genotyping. Of the 10 replicated pairs that were run twice to estimate genotyping error, nine pairs had > 200 reads for both replicates, and the same alleles were found in these pairs. In all, 174 individuals were genotyped (Table 1; Additional file 2). Phylogenetic relationships among MHC alleles and allelic expression patterns
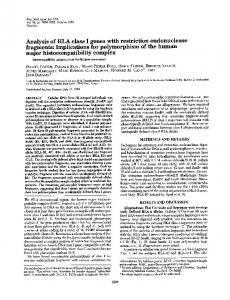
From the partial sequences (203 bp) of MHC class IIβ exon 2 among 174 fish owls, 19 unique variants (alleles) were identified. We named these alleles Bubl-DAB*01–19 (only the abbreviation Bubl is used hereafter), following the nomenclature proposed by Klein et al. [65]. Sequences of all alleles were deposited in the DNA Data Bank of Japan (DDBJ) under accession nos. LC007937–LC007955 (sequence alignment in Additional file 3). The alleles we detected showed high degrees of nucleotide (94/203 sites variable) and amino acid (43/67 sites variable) polymorphism. The number of alleles per individual ranged from eight to 16, indicating there are at least eight MHC class IIβ loci in this species. Nine of 19 alleles were also found in 16 cDNA samples (Figure 2 and [see Additional file 1: Table S1]). Up to eight alleles were detected in cDNA samples from single individuals, indicating that at least four loci are expressed in skin fibroblasts. Additional file 1: Figure S3 shows the phylogenetic relationships among MHC class IIβ alleles from the fish owl and other owls. This pattern is one of trans-species polymorphism [66]: alleles in one species are most closely related to alleles in other species, rather than grouping by species. No alleles were shared between the fish owl and other owl species based on the nucleotide sequences or amino acid sequeneces. Patterns of selection and recombination
Because the allele Bubl12 contains an internal stop codon ([see Additional file 1: Figure S4]), this allele was excluded from the Z-test and the omegaMap analysis. A highly significant excess of non-synonymous over synonymous substitutions was observed for codons in the putative peptide-binding regions (PBR), whereas synonymous substitutions were more frequent than non-synonymous substitutions in non-PBR codons (Table 2). The similar patterns were obtained in the analyses perfomed only with expressed alleles and that only with unexpressed alleles, although more synonymous and non-synonymous mutations
Kohyama et al. Zoological Letters (2015) 1:13
Page 6 of 12
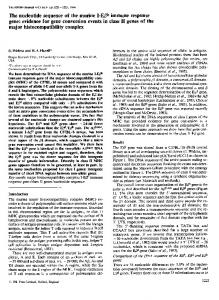
Table 1 Allelic richness and nucleotide diviersity at MHC class IIβ genes in the fish owl populations Period
Population
N
Kindivid
Kpop
AR
πindivid
πpop
1963–1992
SR
11
12
16
14.99
0.159 ± 0.014
0.147 ± 0.013
KS
15
11
14
11.71
0.161 ± 0.015
0.148 ± 0.013
AK
7
11
16
13.63
0.161 ± 0.016
0.149 ± 0.014
DS
4
11
16
14.42
0.162 ± 0.015
0.152 ± 0.014
SR
29
12
18
14.96
0.158 ± 0.014
0.146 ± 0.013
KS
11
11
11
11.00
0.160 ± 0.014
0.147 ± 0.013
AK
6
11
12
11.79
0.161 ± 0.015
0.149 ± 0.013
DS
11
12
15
13.77
0.161 ± 0.014
0.150 ± 0.013
SR
29
12
19
15.93
0.158 ± 0.014
0.146 ± 0.013
KS
12
11
11
11.00
0.161 ± 0.015
0.148 ± 0.013
AK
9
10
12
11.18
0.165 ± 0.015
0.151 ± 0.014
DS
18
12
16
14.28
0.161 ± 0.014
0.149 ± 0.014
HD
12
13
17
15.90
0.159 ± 0.015
0.149 ± 0.014
1993–2002
2003–2012
N, sample size; Kindivid, median number of different alleles per individual; Kpop, number of different alleles in the sampled population; AR, population-level allelic richness calculated via bootstrapping with a constant sampling size (N = 4); πindivid, mean nucreotide diversity (± SE) within individuals; πpop, mean nucleotide diversity (± SE) within poplations. Population abbreviations: SR, Shiretoko; KS, Konsen; AK, Akan; DS, Daisetsu; HD, Hidaka.
SR 100/100 86/30 100/100 53/9 100/98
100/100 88/34
100/100 100/100 81/36
56/19
97/63
KS
AK
DS
HD
Bubl04 Bubl18 Bubl08 Bubl09 Bubl03 Bubl19 Bubl15 Bubl10 Bubl12 Bubl16 Bubl13 Bubl06 Bubl14 Bubl07 Bubl02 Bubl11 Bubl05 Bubl17 Bubl01
100/100
0.02
0 20 40 60 0 10 20 30 0 5 10 15 20 0 10 20 30 0 Number of individuals 1963−1992 1993−2002 2003−2012
5
10
Figure 2 Phylogenetic relationship and spatio-temporal distribution of fish owl MHC class IIβ allleles. Fifty percent majority-rule Bayesian consensus tree of fish owl MHC class IIβ alleles Bubl01–19 (leftmost of the figure) were constructed under Kimura 2-parameter model with gamma-distributed rate variation among sites using MrBayes. Sequences of the MHC class IIβ alleles of northern goshawk (Accipiter gentilis; EF370917) and Eurasian black vulture (Aegypius manachus; EF370890) were included as outgroups. Numbers at nodes are Bayesian popstrior porobabilities (left) and ML bootstrap support values (right) for MrBayes and GARLI analyses. Alleles obtained from cDNA samples are shown in red, and that obtained from genomic DNA but not in cDNA are shown in blue. Alleles whose expression status are unknown are shown in black. The scale bar indicates branch length in substitutions per site. Bar charts on the right side of the tree show spatial and temporal distribution of the alleles. Population abbreviations: SR, Shiretoko; KS, Konsen; AK, Akan; DS, Daisetsu; HD, Hidaka.
Kohyama et al. Zoological Letters (2015) 1:13
Page 7 of 12
Table 2 Results of Z-tests for selection on fish owl MHC class IIβ sequences dS
dN
Z
P
PBR
0.139 ± 0.059
0.464 ± 0.091
3.563
Non-PBR
0.167 ± 0.040
0.095 ± 0.020
−1.644
1.000
All sites
0.158 ± 0.031
0.179 ± 0.028
0.309
0.499
(A) All alleles