particulate matter measured by high volume air sampler from six sampling sites of the city, differences in the concentrations of PM10 were observed in this study.
International Journal of Advances in Science Engineering and Technology, ISSN(p): 2321 –8991, ISSN(e): 2321 –9009 Vol-6, Iss-1, Spl. Issue-1 Feb.-2018, http://iraj.in
SPATIAL AND TEMPORAL VARIATIONS OF PM 10 IN CHITTAGONG CITY 1
AMINA SADIA, 2MOHAMMAD MAIN UDDIN, 3MOHAMMAD MAHFUZUR RAHMAN, 4 KAMRUL HASSAN 1,2,3
Institute of Forestry and Environmental Sciences, University of Chittagong, BD 4 Department of Environment (DoE), Laboratory of Chittagong, BD
Abstract - Healthy environment is precondition of good health. Fresh air, pure water and soil are the main component of a healthy environment. Contaminants from different anthropogenic activities and natural sources such as, particulate matter (PM), Oxides of Sulphur (SOx), oxides of Nitrogen (NOx), carbon dioxide (CO2) etc. contaminate and pollute this natural fresh air and threaten human life as well as environment.Every year the morbidity due to Particulate matter (PM) is about 50% of the total premature morbidity because of air pollution. World Health Organization's (WHO) International Agency for Research on Cancer classified it as group 1 human carcinogen. Considering its importance, in most of the country, monitoring of particulate matter has been given priority in assessing air quality monitoring. Analyzing the concentrations of particulate matter measured by high volume air sampler from six sampling sites of the city, differences in the concentrations of PM10 were observed in this study. The monthly mean concentration of PM 10 hardly remain within the standards of Bangladesh while, the mean annual average of PM 10 at all sampling sites was many times higher than the standard of Bangladesh and WHO. As, the concentration of PM10in Chittagong is not praiseworthy enough and indicate a serious threat to human health, strategic air quality management and monitoring system are recommended in this study. Keywords - Suspended Particulate matter,high volume air sampler
Contributing around 12% of Bangladesh's GDP, Chittagong holds the status of being the secondlargest economy in Bangladesh (The Chittagong Chamber of Commerce & Industry, 2017).Department of Environment (DoE) is the only organization which records the monthly air monitoring data of Chittagong city and they did not publish their mobile air monitoring data, so, temporal and spatial distribution of particulate matter is not analyzed yet. Knowledge on SPM concentrations on the monthly and seasonal basis, as well as their spatial distributions is essential for better management and protection of the public health, while inter-annual variations give an insight into changes in levels of pollutants over the past years.
INTRODUCTION With the rapid urbanization and industrialization, Bangladesh has started to experience different environmental problem especially atmospheric pollution.every 10 µg m3 increase in PM10 concentrationis associated with up to 0.6% increase in daily premature mortality(Lim et al., 2012; Pope III et al., 2002).
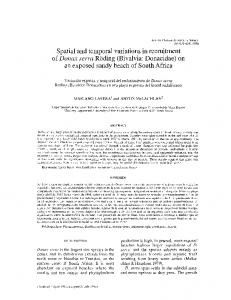
Figure1. Chittagong city (below inset) (District in map; Chittagong, 2015)
Chittagong is the financial center in south eastern Bangladesh having about 4600 small and medium scale, 410 heavy industries and a seaport.
Figure 2. Location of Air quality sampling sites in Chittagong(white locator) showing with their coverage area (circle).
Spa tial and T emporal Variations of PM 1 0 in Chittagong City 26
International Journal of Advances in Science Engineering and Technology, ISSN(p): 2321 –8991, ISSN(e): 2321 –9009 Vol-6, Iss-1, Spl. Issue-1 Feb.-2018, http://iraj.in
II. METHODOLOGY 2.1 Study Area It is situated within 22°14' and 22°24' N Latitude and between 91°46' and 91°53' E Longitude covering an area of 155.4 km² and Density of population is 16,617.8 inhabitant /km² (BBS, 2011). Under the Köppen climate classification, Chittagong has a tropical monsoon climate (Am)(Peel, Finlayson and McMahon, 2007). From the climatic point of view, three distinct seasons can be recognized in Bangladesh – The cool dry season from November through February, the pre-monsoon hot season from March through May, and the rainy monsoon season which lasts from June through October. (NOAA, 2012). 2.2 Sampling framework The concentrations of SPM were collected and measured by high volume air sampler from 2011 January to 2016 December. This air sampler was placed at 6 sampling sites in arbitrary 5 days in every month for 8 hours at a stretch to measure the concentration of Particulate Matter. III. RESULTS AND DISCUSSION
Figure 3. Inter-annual and spatial variations of PM 10 in Chittagong City
Figure 3 shows that in 2011, the annual average concentration of PM10 was highest at all sampling sites under Mobile Air Monitoring System. Here, the standard deviation for each year has been represented by the error bar. The standard annual average concentration of Bangladesh is 20 μg/m3and the annual average concentration at entire sampling sites are unexpectedly higher than the standard annual average maximum limit for PM10. From 2011 to 2016, there is no significant difference among the annual average PM10 concentration of the entire sampling site.
Spa tial and T emporal Variations of PM 1 0 in Chittagong City 27
International Journal of Advances in Science Engineering and Technology, ISSN(p): 2321 –8991, ISSN(e): 2321 –9009 Vol-6, Iss-1, Spl. Issue-1 Feb.-2018, http://iraj.in
standard limit of PM10 concentration of Bangladesh for average 8 hour is 150μg/m3, where this standard of WHO is 50μg/m3. No average concentration is found within the standard limit of WHO. This average PM10 concentration is higher than the standard of Bangladesh, while these concentrations hardly remain within the standard limit of Bangladesh only in rainy season.
Table 1: Anova table for monthly and spatial variation of PM 10 concentration
From the ANOVA table, the P value for the site =0.03966 < 0.05, It depicts that at 95% level of confidence there is significant difference in the Monthly average concentration of PM10 among these six sites under Mobile Air Monitoring System. CONCLUSIONS The aim of the study was to analyze of the temporal variations of PM10 from monthly to inter-annual scale based on monitoring sites of Chittagong city. This study has revealed that there was significant spatial variation in the monthly average of PM10 among the sites. The findings of this study are:
Within-city differences in the monthly average concentrations of PM10 were observed in this study. There is significant difference in the monthly average concentration of PM10 among these six sites. The mean annual average PM10 at all sampling sites were many times higher than the standard of Bangladesh and WHO.
An integrated management system can be the best solution to reduce the concentration of particulate matter. Based on this study, the recommendations are given below: Musk has to be used to reduce the risk to be exposed to Particulate matter as most the measured concentration are found higher than the standard limit which is harmful for health. Judicious use of vegetationhave to be popularize to reduce the Particulate matter movement, as 60 percentstreet level PMconcentration at can be reduced by the planned plantation of grass, climbing ivy and other plants in urban canyons(Pugh et al., 2012) The sampling plan has to be updated for well representation of particulate matter condition in Chittagong.
Figure 4: Monthly variation of monthly average PM 10 concentration at (a) A.K. khan circle (b) City gate (c) G.E.C Circle (d)Sholoshohor 2 No. Gate (e) Agrabad circle (f) New market circle
Figure 4 demonstrates that the monthly average concentrations of PM10 at A.K.Khan gate and city gate are higher in dry winter (November to February) and hot summer (March to June) than in rainy monsoon season (July to October).The monthly average concentrations of PM10 at G.E.C. Circle, Sholoshohor 2 No. Gate, Agrabad circle and New market circle from the end of the dry winter till the mid of the hot summer (February-April) are the higher than the rainy season. Highest concentration of PM10 was observed in 2011in A.K. khan gate which is located near Shagorika industrial zone. The
Spa tial and T emporal Variations of PM 1 0 in Chittagong City 28
International Journal of Advances in Science Engineering and Technology, ISSN(p): 2321 –8991, ISSN(e): 2321 –9009 Vol-6, Iss-1, Spl. Issue-1 Feb.-2018, http://iraj.in http://www.noaanews.noaa.gov/stories/images/global.pdf REFERENCES (Accessed: 12 August 2017). [5] Peel, M. C., Finlayson, B. L. and McMahon, T. A. (2007) [1] BBS (2011) Population & Housing Census-2011: Union ‘Updated world map of the Köppen-Geiger climate Statistics. Bangladesh Bureau of Statistics. Available at: classification’, Hydrology and Earth System Sciences, 11(5), http://www.bbs.gov.bd/WebTestApplication/userfiles/Image/ pp. 1633–1644. doi: 10.5194/hess-11-1633-2007. National Reports/Union Statistics.pdf (Accessed: 1 August [6] Pope III, C. A. et al. (2002) ‘Lung cancer, cardiopulmonary 2017). mortality, and long-term exposure to fine particulate air [2] District in map; Chittagong (2015) Bangladesh National Web pollution’, Jama-Journal of the American Medical portal. Available at: Association. http://www.chittagong.gov.bd/site/page/3cc50c9f-2144-11e7[7] Pugh, T. A. M. et al. (2012) ‘Effectiveness of Green 8f57-286ed488c766 (Accessed: 18 August 2017). Infrastructure for Improvement of Air Quality in Urban Street [3] Lim, S. S. et al. (2012) ‘A comparative risk assessment of Canyons’, Environmental Science & Technology. American burden of disease and injury attributable to 67 risk factors and Chemical Society, 46(14), pp. 7692–7699. doi: risk factor clusters in 21 regions, 1990-2010: a systematic 10.1021/es300826w. analysis for the Global Burden of Disease Study 2010.’, [8] The Chittagong Chamber of Commerce & Industry (2017) Lancet (London, England), 380(9859), pp. 2224–60. doi: ‘Economics Landscape of Chittagong’, The Chittagong 10.1016/S0140-6736(12)61766-8. Chamber and Commerce Industry. Available at: [4] NOAA (2012) ‘NOAA’s Top Global Weather, Water and http://www.chittagongchamber.com/elc.php (Accessed: 10 Climate Events of the 20th Century’, NOAA Backgrounder. August 2017). Available at:
Spa tial and T emporal Variations of PM 1 0 in Chittagong City 29