Spatial Assessment of Model Errors from Four Regression Techniques Lianjm Zhang and Jeffrey H. Gove Abstra& Fomst modelers have attempted to account for the spatid autocorrelations among trees in growth and yield models by applying alternative regression techniques such as linear mixed models (LMM), generalized additive models (GAM), and geographicalIy weighted regression (GWR). However, the model. errors are commonly assessed using averap errors across the entire study area and across tree size classes. Little attention has been paid to the spatial heterogeneity of model performance. In this study, we used local Moran cmfficients to investigate the spatial hstcibutihns of the model ersors from the four regression models. The results indicated that GAM improved model-fittingto the data and provided better predictions for the response variable. However, it is nonspatial in nature and, consequently, generated spatial distributions for the modeI errors similar to the ones from ordinary least-squares (OLS). Furthermore, OLS and GAM yielded more clusters of similar (either positive or negative) model errors, indicating that trees in some subareas were either all underestimated or all overestimated for the response variable. In contrast, LMM was able to model the spatial covariance structures in the data and obtain more accurate predictions by accounting for the effects of spatial autocorrelations through the empirical best linear unbizsed predictors,GWR is a varying-coefficient modeling technique. It estimated the model cmfhcients locally at each t r t x in the example plot and resulted in more accurate predictions for the response variable. Moreover, the spatial distributions of the made1 errors from LMM and GWR were more desirable, with fewer clusters of dissimilar model errors than the ones derived from OLS and GAM. FOR. SCI. 51(4):334-346. Key Words: Spatial autocomIafion and heserogeneity, local indicator of spatial autocorrelation, ordinaq least-squares), linear mixed model, generalized additive model, geographically weighted regression.
OREST MODEldERS HAVE LONG REALIZED h a t using ordinary least-squares COLS) regression to estimate the parameters of growth and yield models may violate (at least) one of the OLS assumptions (i.e., independence of observations, due to ternporai or/and spatial autocorrelations in forest data; 1,iu and Bwkharl199A Fox et al. 2001). Violating thc assumption lead?to a biased estimation or the standard errors of model paramclcrs and reduces estimation efficiency, while regression coefficients remain unbiased. Thus, ~ i ~ c a n tests c e and measures of model fit may be misleading (West et al. 1984, Gregoire 1987, Anselin and G r f i t h 1988, Fox et 211. 2001). Temporal autocarrelation received attentxon in fatest modekg practice beginning in the 1960s (Buckman 1962, Curtis 1967, West et al. 1984, Gregoire 1987). A number of statistical rnefhods have been applied to deal with thc ccmporal dependency such as the first-order autoregessive model (e.g.. Yang 1984, Monserud 1986), the first-order mixed autoregressive moving average model (e.g., Stage and Wykoff 1993), and 1inear and nonlinear mixed models (e.g ., Lappi 199 1, Gregoue et al. 1995, Penner et al. 1995, Schabenbmger and Gregoire 1 995, Gregoire and Schabenkrger 1996, Tasissa and Burkhart 1998).
The violation of the OLS assumption due to spatid dependency in tree data has drawn attention from forest
modclcrs only in recent years. Commonly, distance-dependent competition indices were developed and incorporated into individual-tree growth and yield models to account indirectly Tor the presence of the spatial dependency (c.g., Pukkda and Kolstrijm 1987, P u W a 1988, Blging and Dobhertjn 1995). Othcr spatial analyses (e.g., Moran coefficient. variopm, higing, Kipley's K-function. Gbbs process, nonparamctric kernel, and nearest-neighbor method) have been used to detect, analyze, and model spatial patterns and autocorrelations of many fmsl variables, including me diameter, diameter distribution, total height, growth, mortality, and regeneration (e.g., Reed and Rwkbart 1 985, Schoondcrwaerd and Mehren 1988, Kenkel et al. 1989. Mocur 1943, Biondi et al. 1994, Liu and Eurkhart 1994, FrohFicb and Quednau 1995, Kangas and Korhonen 1996, Wells and Getis 1999, Fox et al, 2001, Croreaud et 8. 2002, Nanos and Montero 2002). Modan statistical techniques have lately become popular to deal with spatial effects (i.e., autocomelation and heterogeneity) in predicting forest composition and athibutes, species distribution, biodiversity. forest type and class, and insect attack. Technipes used include Linear mixed models (LMM), generalized additive models (GAM),classification and re_mssion tree (CART'), mullivariate adaptive regression splines (MARS), artificial neural networh (ANN), and
- -
Limjun Zhang, Faculty of Forest and Natural Resources Management. State t"niversily of New York. College of Envimnmental Science and Forestry. One Forestry Drive, Syracuse, NY 13210-Phone: (3 15) 470-6558:Fax: (315) 470-6535:
[email protected]. Je*y H. Gove, Research Forester, USDA Forest Service Northeastem Research Station, W Box 640,Durham. NH 0382A-Phone: (6031 868-7667; jgove Wfs.fed.us.
Acknowledgmentr: T h i s research was supported by funds provided by the LSDA Forest Senice, Northeastern Research Station RWLI 4104. The authors thank the associate editor and two anonymous reviewers for t& valuable suggestions and helpful comments on the manuscript. Manuscript received April 19. W ,accepted February 21, 2005
334
Copyright O 2005 by the Society of American Foresters
Fo~esrScievrm 51(4,l 2005
Reprinted from Forest Schce, Vol. 51, No. 4, August 2005.
geographically weighted regression (GWR) (e.g., Austin and Meyers 1996, Preisler et al. 1997, Lehmann 1998, Moisen and Edwards 1999, Moisen et al. 1999, Frescino et al. 2001, Guisan et al. 2002, Moisen and Frescino 2002, Lehmann et al. 2003, Zhang and Shi 2004, Zhang et al. 2004). Many of these modeling techniques are considered more robust for spatially correlated data, less restricted in model assumptions, and flexible in modeling nonlinearity and nonconstant variance structure (Guisan et al. 2002, Moisen and Frescino 2002). Performance assessment of these modeling techniques has often been focused on the overall model errors (kaffan, S.W. 1999. Spatially assessing model error using geographically weighted regression. GeoComputation at http://www. geocomgutation.org/1999/086/gc~Q86.htmtm March 22, 2005, Moisen and Frescino 2002), assuming the models predict the response variable equally well across the entire study area. Although previous studies showed the improvement on model-fitting and parameter standard errors using global accuracy assessments, there is little information available on how well these models perform spatially. Areas where predictions are not acceptable may indicate the need for other variables in the models or a different approach. One way to locally assess the model errors is to map them across the study area (Rathert et al. 1999, Fotheringham et al. 2002). Visualization, however, does not enable us to identify significant clusters of positive or negative model errors at multiple scales. An alternative is to c o q u t e local spatial autocorrelation indices for the model errors (Tiefelsdorf and Boots 1997, Laffan 1999 web site above, Tiefelsdorf 2000). A set of indices known collectively as local indicator of spatial association (LISA) has been developed to study local spatial nonstationarity (e.g., Anselin 1995, Fotheringham and Brunsdon 1999, Boots 2002). The strength of LISA is its ability to identify spatial associations in a variable in one or more portions of the study area even though there is no discernible pattern as summarized by a global autocorrelation statistic (Getis and Ord 1996). LISA has been used to successfuliy identiiji clusters in biological data sets (Sokal et al. 1998a, 1998b). Shi and Zhang (2003) explored the relationships among LISA, tree growth, and traditional individual-tree competition indices. They found that LISA was useful to identify "hot spots" (positive autoconelation, or similarity) and "cold spots" (negative autocorrelation, or dissimilarity) of tree growth and competition. The objectives of this study were (1) to epply four alternative regression techniq~m(i.e., OLS, LMM, GAM, and GWR) to model tree crown area using tree diameter, (2) to evaluate the peiformance of the four models using overall (global) model errors and errors across tree size classes, and (3) to assess the performance of the four models in terms of spatial distributions and clustering of positivelnegative model errors using spatial maps and local Moran coefficients.
Description of Modeling Four regression techniques were used in this study.
1. Ordinary least-squares (OLS). Given a set of n (k = 1: 2, . . . , n) observations on p (g = 1, 2, . . . ,p ) independent or predictor variables X, and a dependent or response variable Y, the relationship between Y and X can be regressed using OLS as
where Y is a vector of the observed response variable, X is a known matrix including a column of 1s (for intercept) and p independent variables, ,B is a vector of unknown fixed-effects parameters, and E is a random error term with assumed distribution N(0, 20, where I denotes an identity matrix and 2 represents the common error variance. The OLS estimate of P is obtained by
where superscript T denotes the transpose of a matrix. The relationship represented by Equation 1 is assnmed to be universal or constant across the geographic area. 2. Linear mixed model (LMM). The linear mixed model is a special case of generalized linear models, and can be expressed as
where Y, X, and p are as defined in Equation 1, Z is a known design matrix, y is a vector of unknown randomeffects parameters, and E is a vector of unobserved random errors. It is assumed: (1) E(y) = 0 and var(y) = 6: (2) E(r) = 0 and var(s) = R, (3) cov(y, r) = 0, and (4) both y and E are normally distributed. The variance of Y is V = Z G Z ~ R, and can be estimated by setting up the random-effects design matrix Z and by specifying covariance structures for G and R (Eittell et al. 1996). LMM can be used to (1) characterize or model the spatial covariance structure in the data and (2) remove the effects of spatial autocomelation to obtain more accurate estimates for the response variable or treatment means (Littell et aL 1996). In principle, spatial autocorrelation can be reflected in G or R or both. For this study, no random effects were considered. Thus, Z = 0, V = R, and Equation 3 is reduced to
+
Spatial autoconelations among observations are modeled through R = var(s) such that
where dV is the distance between locations i and j. This is an LMM model with a nugget effect in which ~, 2 + and 0 correspond to the geostatistics paarneters nugget, sill, and range, respectively. Different covariance models f(d,,, 0) are available including spherical,
4,
Forest Science 51(4) 2005
335
exponential, Gaussian, and power. For example, the exponential covariance model has the form of
A likelihood ratio test can be used to determine whether it is necessary to model the spatial covariance structure of the data (Littell et al. 1996, SAS Institute, Inc. 2002). In general, OLS is no longer the best approach to estimating LMM (Littell et al. 1996). Likelihood-based methods (e.g., maximum likelihood (ML) and restsictedlresidual maximum likelihood (REML) methods) are usually used to solve for P. Numerical algorithms, such as the Newton-Raphson algorithm, can be used to obtain
Furthermore, the empirical best linear unbiased predictions (EBLUP) should be used to take spatial autocorrelations into account for predicting the response variable (Schabenberger and Pierce 2002). Generalized additive model (GAM). GAM is a nonparametric extension of generalized linear models (GLM) (Hastie and Tibshirani 1990, Guisan et al. 2002, SAS Institute, Inc. 2002). Whereas GLM emphasizes estimation and inference for model parameters, GAM focuses on exploring data nonparametrically. The strength of GAM is its ability to deal with highly nonlinear and nonmonotonic relationships between the response variable and a set of explanatory variables. Thus, GAM is sometimes referred to as data-driven rather than model-driven (Guisan et al. 2002). In general, GAM can be expressed as
where So is the intercept and S,(X,) is a nonparametric smoothing function for the gth independent variable X. The only underlying assumption is that the functions in GAM are additive and that the component functions are smooth. The restriction on additivity allows us to interpret the GAM model in much the same way as a conventional regression analysis. Many methods have been proposed to approach the formulation and estimation of GAM. One of the algorithms is known as backfitting, in which we seek the nonparametric functions S,(X,) to minimize
A wide range of nonparametric functions is available for GAM, and combinations of these functions are also possible. Several smoothers are commonly used. Cubic smoothing spline finds the function SJX,) that mini-
336
Forest Science 51(4) 2005
mizes the penalized least-squares (Hastie and Tibshirani 1990),
where A, is a nonnegative smoothing parameter for the gth variable X,, and S i is the second derivative of the spline function. The first t e r n in Equation 11 measures closeness to the data, whereas the second term penalizes curvature in the function. The parameter A, governs the "wiggliness" of the function S,(Xg); when A, = 0, Sg(X,) produces a interpolating curve, whereas larger values of A, force S,(X,) to be smoother. The S,(X,) is a straight line when A, + X. The selection of the best A, value can be achieved using the concept of effective degrees of freedom. Other spline smoothers include B-spline, polynomial spline, thin-plate spline, etc. Locally weighted scatterplot smoothing (LOESS) is also used to fit a regression surface to the data points within a chosen neighborhood of a given point, in which a weighted least-sq~~ares algorithm is used to fit linear and quadratic functions of the predictors at the centers of neighborhoods (Venables and Ripley 1997, SAS Institute, Inc. 2002).
4. Geographically weighted regression (GWR). Given a set of location coordinates (ui, vi) for each observation, the underlying model for GWR is
vi>) are ( P + 1) where {Po(ui,vJ, Pl(ui, v,), . . . , continuous functions of the location (u,, vi) in the study area. Again, E is the random error term with a distribution N(0, 21). The aim of GWR is to obtain the estimates of these functions for each independent variable X and each geographic location i (i.e., each tree in this study) using data near the location. The estimation procedure of GWR is as follows: (1) draw a circle of a given radius around one particular location i (the center), (2) compute a weight (wv) for each neighboring observation k (k = 1, 2, . . . , n) according to the distance (dV) between the location j and the center i at (ui, vi), and (3) estimate the model coefficients using weighted leastsquares regression such that
where the weight matrix, Wi: is
If W, = I (identity matrix), i.e., each observation has a weight of unity, the G model is equivalent to the OLS model and the coefficients are the same for every location. Equation 13 is not a single equation but a matrix of equations. Once wV has been calculated, the coefficient matrix p can be computed row by row by repeated application of Equation 13. A set of estimates of spatially varying parameters is obtained without specifying a functional form for the spatial variation. The standard error for each coefficient can also be estimated. Essentially, GWR lets the data speak for themselves when estimating each regression coefficient for each independent variable and each geographic location (Brunsdon et aP. 1998). Different kernel functions can be used to compute the weight matrix for each location (Fotheringham et al. 2002). In this study we used a Gaussian distance-decaybased kernel function,
where h is referred to as the bandwidth. This kernel function assumes that the bandwidth at each center i is a constant across the study area (i.e., a fixed kernel). If the locations i and j coincide (i.e., = O), wij equals one while wij decreases according to a Gaussian curve as the distance dij increases. For this weighting function, the weights are nonzero for all data points no matter how far they are from the center i. However, this is not necessarily the case when other weighting functions are used (Fotheringham et al. 2002).
6
Data The data used in this study were a part of the stem map data of a softwood stand located near Sault Ste. Marie, Ontario, Canada (Ek 1969). The stand was mature, second growth, uneven-aged, and 8.1 hectares (20 acres) or 402 X 201 m (1,320 X 660 ft) in size. Major tree species included balsam fir (Abies balsarnea [L.] Mill.), black spruce (Picea maviana [Mill.] BSP.), white spruce (Picea glauca [Moench] Voss), and white pine (Pinzts strobus L.). A total of 6,881 tsees were measured in 1967. The information included tree location coordinates, diameters at breast height (dbh), heights, and crown area (crown) for trees >8.9 cm (3.5 in.). Pielou's index of nonrandomness (Pielou 1959) was 1.35, indicating a clustered spatial distribution of trees. The mapping and measurement methods were detailed in Ek (1969). An example plot was selected from the stand to reduce
0
10
20
30
40
50
60
70
80
DBH (cm)
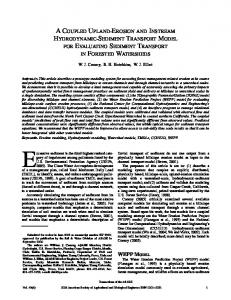
Figure 1. Scatterplot of tree crown area versus diameter (rz = 941 trees).
computation time for the EMM, GAM, and GWR methods. The example plot had 941 trees and was located in the right. lower corner of the stand (100 X 100 m in size). It was a close representation of the whole stand in terms of species composition, tree attributes, and the spatial distributions of alsam fir was the dominant tree species (59.1% in number of trees), followed by black spruce (36.8%). Minor species included white spruce, white pine, and white birch (Betula papyrifem Marsh.). The average tree diameter was 15.9 cm (ranging from 8.9 to 74.2 cm), and the average crown area was 5.1 m2 (ranging from 0 to 87.9 m2).
Based on the data for this study (Figure I), we chose the folIowing linear regression model to fit the relationship between tree crown and dbh:
where crown is the tree crown area (m2), dbh is the tree dbh (cm), PO-P2 are regression coefficients to be estimated, and e is the model random error. This parabola model may result in estimating smaller crown areas for larger tree sizes. However, our objective was not necessarily to develop a predictive model for the tree crown area. Rather, we attempted to investigate the spatial heterogeneity of the model errors for fitting the relationship by the four regression methods.
Equation 16 was fitted to the example plot by OLS, , CAM, and GWR methods, respectively. Statistical sis Systein 9.0 (SAS) (SAS Institute, Inc. 2002) was used to fit the first three models. The GWR model was fitzed using a computer software prograx, GWR 2.0 (Fotheringham et al. 2002). Detailed information on the software is available from A.S. Fotheringhm, National Centre for Geocomputation, National Unive nuim.ie/ncg/GWWsoftware.htm For the LMM model, different spatial covariance models Forest Science j l i 4 ) 2005
337
were tried to account for the spatial autocorrelations among trees, including Gaussian, exponential, power, and spherical functions (Littell et al. 1996, SAS Institute, Inc. 2002). The exponential covariance structure was selected according to model-fitting statistics such as Akaike's information criterion (AIC). Note that the PRED from the OUTP = option under MODEL statement in PROC MIXED is based on EBLUP in two cases: (1) the LMM model contains a RANDOM statement, and (2) the response value for an observation is missing (SAS Institute, Inc. 2002). However, we used only R to model the spatial autocorrelations among the trees (i.e., no random effects). The following procedure was used to obtain the appropriate predictions for crown based on EBLUP. The trees in the example plot were duplicated, resulting in 941 941 = 1,882 treeslobservations. The observed values of crown in the second half were then set to missing. When Equation 16 was fit to the 1,882 trees, only the first half of the data (941 trees) with observed crown was used to estimate the LMM model coefficients. However, the predictions for these trees were not based on EBLUP because of the absence of a RANDOM statement. The second half of the data (i.e., the duplication of the same 941 trees) with missing values of crown was not used in model-fitting, but the predictions of crown for these trees were based on EBLUP, which were used to compute the LMM model errors. One can easily detect whether the predictions of the response variable are based on EBLUP or not. The EBLUP predictions at two locations with identical dbh values should differ depending on where the trees are located, whereas the regular predictions (not based on EBLUP) would be the same for a given value of dbh regardless of the locations of trees (Schabenberger and Pierce 2002). The GAM model was fitted with different nonparametric smoothers for both dbh and dbh2 in Equation 16, respectively (SAS Institute, Inc. 2002). The GAM model with the cubic smoothing spline was selected because it had a smaller model deviance than the one with LOESS. For the GWR model, the Gaussian kernel function (Equation 15) was used to estimate the weights with the optimal band-
+
width h determined as 7.55 m by AIC minimization (Fotheringham et al. 2002). The model error or residual was defined as the difference between the observed and appropriately predicted crown (e.g., EBLUP predictions in LMM). The absolute model error was calculated by taking the absolute value of the model error. To examine the model errors across tree sizes, all trees in the example plot were grouped into diameter classes, and average model error and absolute error were calculated for each diameter class. The spatial distributions of the model errors from the four regression methods were investigated using the global and local Moran coefficients (Anselin 1995, Tiefelsdorf 2000, Boots 2002). In this study we used the range of the variogram for the OLS model errors (Figure 2) as the predefined bandwidth (h = 7.27 m) for calculating the Moran coefficients, because the range of a variogram indicates there is no spatial autocorrelation among the OLS model errors beyond this distance (Isaaks and Srivastava 1989). The global Moran coefficient (MC) is defined by
where ei and e, denote the model errors at locations i and j, respectively, Z is the mean of ei over n locations, and cii(h) is the spatial weight measure within the bandwidth. If location j is a neighbor of the subject location i, then cii(h) = 1; otherwise cij(h) = 0. The expected mean of the MC is -ll(n - 1). A positive global MC indicates that the observed values of locations tend to be similar, whereas a negative MC indicates that the locations tend to be dissimilar in the observed values. The global MC is approximately zero when the observed values are arranged randomly and independently over space. The expected value and variance of the MC for the sample size n can be calculated using two sampling assumptions: normality or randomization (Cliff and Ord 1981, Lee and Wong 2001). A Z-test for the null hypothesis of no spatial autocorrelation between observed values over the n locations can be conducted based on the standardized MC. Anselin (1995) showed that global MC of spatial autocorrelation can be decomposed into local values as follows: n
MC, = (e, - 6 )
cLj(h)(ej- 6).
(18)
k= 1
The first component (e, - Z) is the difference between the model error e j at the reference location i and the mean, whereas the second component,
objective = 4.5551
0
1
I
I
I
I
0
5
10
15
20
distance
Figure 2. Variogram of the OLS model residuals (range = 7.27 m).
338
Forest Science S I ( 4 ) 2005
is the sum of differences between the neighboring model errors ej and the mean. A positive local MC, indicates a
cluster of error values around i with values similar to those at i, and deviates strongly (either positively or negatively) from 2. A negative local MC, describes a cluster of error values around i with values dissimilar to those at i. If either e, or the values of ej in the neighborhood of i are close to Z, the local M e i will indicate no spatial autocorrelation (Tiefelsdorf and Boots 1997, Boots 2002). is standardized by division by the variance,
a pseudosignificant level of M e i can be obtained by a conditional randomization or permutation approach (Lee and Wong 2001). A significant positive Z-test indicates that location i is associated with the similar values of the surrounding locations, whereas a significant negative Z-test indicates that location i is associated with the dissimilar values of the surrounding locations. Most forest modelers are also interested in the performance of a growth-and-yield model when it applies to an independent data set. To validate the performance of the four regression models, the example plot (n = 941 trees) was split into two sets. A total of 800 trees (about 85%) were randomly selected from the example plot as the model development data. The remaining 141 trees (15%) of the data, which were not used in model-fitting, served as the model validation data. The two data sets had similar averages, dispersions, and ranges (see Table 6). Then the model errors and absolute errors were computed for the model validation data in the same way as mentioned above.
Results Model-Fitting The OLS model fitted the example plot reasonably well with an error sum of squares (SSE) = 8,67 1.15, and AIC = 4,785.1 (Table 1). The model R' was 0.83 and the two coefficients for dbh (b, = 0.4714) and dbh2 (b, = 0.0059) were significantly different from zero (both P-values < 0.0001). The LMM model, using the exponential covariance structure, had much smaller SSE (5,748.80) and A4C (4,770.8) than the QLS model. The null model likelihood ratio test was statistically significant (P-value < 0.0001), indicating that the exponential covari-ance structure was preferred to the simple diagonal covariance structure of the OLS model (SAS Institute, Inc. 2002). Similarly, both GAM and GWR models fitted the exam-
ple plot better than the QLS model (Table 1). The GAM model's SSE (6,557.49) was smaller than that of the OES model. The F-test (F = 10.10) for testing the improvement of GAM over OLS (Hastie and Tibshirani 1990, Venables and Ripley 1997) was highly significant (P-value < 0.0001). The GWR model's SSE was 4:799.40, and AIC was 4,523.4. The approximate goodness-of-fit likelihood ratio test was used to investigate the improvement of the GWR model over the OLS model (Fotheringham et al. 2002). The results indicated that the GWR model improved model-fitting significantly ( F = 4.90 and P-value < 0.0001) over the OLS model. Evidently: the relationships between crown and dbh are not constant across the example for dbh plot. For instance: the GWR slope coefficient ranged from -0.659 to 3.03, and the slope coefficient & for dbh2 ranged from -0.072 to 0.029, indicating the spatial heterogeneity or nonstationasity of the relationship between crown and dbh. In general, spatial heterogeneity is related to locations in space, missing variables, and functional misspecification (Anselin and Griffith 1988, Zhang and Shi 2004).
,
Conventionally, the assessment of regression models is conducted through the residual analysis such as the examination of overall (global) model errors and errors across tree size classes (e.g., Moisen and Frescino 2002, Zhang et al. 2004). The OLS model errors have larger range and are more negatively skewed, the errors of LMM and GAM have similar ranges, skewness, kurtosis, and quantiles, and the GWR model produces much smaller range for the model errors than the above three models (Figme 3). The four models appear to produce similar model errors for trees up to 40 cm in diameter (Figure 4). However, the OLS and LMM models produce much larger negative residuals for large-sized trees (40-60 cm in diameter). In general, EMM, GAM, and GWR produce smaller absolute errors than OkS across the diameter classes (Figure 5). The GWR model consistently yields smaller absolute errors for larger trees, except the GAM model is the best for trees in the diameter class of 40-60 cm.
The global MC was computed for the model errors from the four regression models. Table 2 shows fiat the global MC for the OLS and GAM model errors were significantly positive (2-values > 1.96), indicating that the above two
Table 1. Model-fitting statistics for the four regression techniques.
Model
OLS
LMM GAM GWR
SSE
AIC
Test"
P-value
8671.15 5748.80 6557.49 4799.40
4785.1 4770.8
2 = 567.8
N.A.
4523.4
F = 10.10 F = 4.90
N.A. and 95% quantiles
Figure 7. Plot of the local Moran coefficient: (a) OLS, (b) LMM, (c) GAM, and (d) GWR. The size of the symbols (black dot and circle) is proportional to the local Moran coefficient (MC) of the model errorslresiduals. The black dots represent positive local MC, and the circles represent negative local MC.
significant 2-values (Table 5). Among the significant Zvalues there were about 60% positive 2-values and 40% negative Z-values for the OLS and GAM models. This implied that OLS and GAM tended to generate more clusters of either positive or negative model errors in some subareas of the example plot. Trees in those subareas were either all underestimated (positive errors) or all overestimated (negative errors) for the response variable. However, 342
Forest Science 51(4) 2005
there were about 40% positive Z-values and 60% negative 2-values among the significant Z-values for the LMM and GWR models (Table 5). If there are clusters of the model errors or residuals existing, a large error tends to be surrounded by smaller neighboring errors and a small error tends to be surrounded by larger neighboring errors. Similar trends can be seen for the other two significance levels in Table 5. The LMM and GWR models produced relatively
Table 5. Comparison of the significant Z-values for the local Moran coefficients.
Among the significant 2-values Model
Number of /Z/> 1.96 67 (7.12%) 38 (4.04%) 78 (8.29%) 38 (4.04%)
OLS
LMM GAM GWR
LMM GAM GWR
Number of (21 > 2.58 44 (4.68%) 23 (2.44%) 56 (5.95%) 20 (2.13%)
OLS LMM GAM GWR
Number of IzI > 3.27 29 (3.08%) 12 (1.28%) 38 (4.04%) 12 (1.28%)
OLS
Numbers in parentheses are percentages; n
=
941 trees.
Table 6. Descriptive statistics of the tree variables for the model development data (800 trees) and model validation data (I46 trees).
Data
Variable
Mean
Std
Model Development Model Validation
dbh (cm) crown (m2) dbh (cm) crown (m2)
15.88 5.03 16.13 5.35
7.59 6.96 8.71 9.13
Minimum
Maximum
fewer numbers of significant local MC, for smaller cu levels than the OLS and GAM models. The split between positive and negative Z-values was about 30% (positive) and 70% (negative) for LMM and GWR, and vice versa for OLS and GAM at a = 0.01 and a = 0.001.
LMM was similar for the model validation data in terms of
Model Validation
In this study, we investigated the spatial heterogeneity of model performance for four regression methods, using a case study of one small forest population. An exhaustive comparison of estimation and diagnostic methods for larger areas or simulated populations that encompass a wide range of spatial variability would be difficult because of the computer-intensive nature of the LMM, GAM, and GWR methods. Still, the resuits discovered here on a clustered plot of trees may hold for other similar forested areas, because spatial modeling techniques such as LMM and GWR are able to account for the irregularity or heterogeneity in the population.
To validate model performance, we randomly split the example plot (n = 941 trees) into the model development data set (85%) and validation data set (15%) (Table 6). Because the spatial continuity among the validation trees was Lost because of the random selection, we only computed the descriptive statistics for the model errors and absolute errors for the four regression techniques based on the validation data. The results showed that, on average, GWR and GAM produced smaller model enors than OLS and LMM. GAM yielded the smallest absolute model errors a a o n g the four regression techniques. The performance of OLS and
averages, dispersions, and ranges of the model ersors and absolute errors (Table 7).
Table 7. Descriptive statistics of the model residuals and absolute residuals based on model validation data (BIB trees).
Model OLS
LMM
CAM GWR
Variable
Mean
Std
Minimum
Maximum
Residual Absolute residual Residual Absolute residual Residual Absolute residual Residual Absolute residual Fop-est Science 5114) 2005
343
GWR, a local modeling technique, may hold some promise in forest growth modeling under an individual tree distance-dependent paradigm. Each tree would have an associated set of locally calibrated coefficients for model components that would be stored for subsequent prediction. The complexity of the underlying growth model might dictate several such individual tree equations. One unresolved question in such an approach would be whether these local relationships stand the test of time; that is, given several prediction cycles, do local coefficient estimates still represent a given locality as well as smoothed global estimates would? One could conjecture that, due to factors such as tree senescence, mortality, canopy dynamics, and recruitment, locally calibrated models might not continue to fit a given tree or region over time and may require updating or adjustment. Global models, however, having drawn from the pool of larger variation in the overall dynamics and states of the forest, might tend to represent these changes with more robustness over time. Also, local models based on techniques such as GWR are population-specific. One could not estimate local models for trees on a forest and hope to export them to another population with different spatial-size interrelationships. Therefore, these methods are of limited use in developing regional models. One possible way to make local models, such as those fitted under GWR, more robust to the changes in the neighborhood might be to adopt a different strategy for weighting observations in the parameter estimation stage. In this study, the weight function used in GWR estimation took the form of Gaussian decay. Although this weight function has certain desirable properties with regard to spatial continuity in general, it probably has little biological justification, nor do its competitors (Fotheringham et al. 2002). It would undoubtedly make more sense to use some form of competition index within a local neighborhood, either alone or combined in concert with the Gaussian decay function, as the weighting function in GWR for forest trees. In the latter case, the competition index might be used as an adjustment to the Gaussian weights, so that the competition potential of nearby trees upweights their values.
Conclusion Forest modelers have realized that the misspecification of covariance structure for spatially correlated data will produce biased standard error estimators, consequently affecting hypothesis tests and confidence intervals of the model. Generalized additive models (GAM) do not make any assumptions on model errors, and fit the data nonparametrically. Although it improves the model-fitting and produces better prediction due to its robustness and flexibility, GAM is nonspatial in nature because it focuses on multidimensional space of predictor variables. However, a linear mixed model is able to characterize the spatial covariance structures in the data with different geostatistics models. More accurate predictions for the response variable can be obtained by accounting for the effects of spatial autocorrelation through the empirical best linear unbiased predictors
344 Forest Science 51(4/ 2005
(Littell et al. 1996, Schabenberger and Pierce 2002). GWR is clearly a spatial model. Its kernel function is located in two-dimensional geographical space, and takes spatial locations explicitly into account for estimating the model coefficients at each tree in the example plot (Brunsdon et al. 1999). Therefore, GWR produces a different spatial distribution for model errors than the ones from other regression techniques. Our results showed that the OLS and CAM models yielded significant clusters of positive or negative residuals, indicating that trees in some subareas of the study area were either all underestimated or all overestimated for the response variable. Since LMM and GWR were able to adjust the estimation of the model coefficients according to the local spatial autocorrelations, they produced more accurate predictions for the response variable. The LMM and GWR model residuals also had more desirable spatial distributions (fewer clusters or clusters of dissimilar model errors) than the ones from the OLS and GAM models.
Literature Cited ANSELIN, L. 1995. Local indicator of spatial association-LISA. Geog. Anal. 27:93-115. ANSELIN, L., AXD D.A. GRIFETTH. 1988. Do spatial effects really matter in regression analysis. Papers of Reg. Sci. Assoc. 65:11-34,
AUXIK, M.P., AND J.A. MEYERS.1996. C~urentapproaches to modeling the environmental niche of eucalypts: Implication for management of forest biodiversity. For. Ecol. Manage. 85:95-106. B I G ~ GG.S., , AND M. DOBBERTIN. 1995. Evaluation of competition indices in individual tree growth models. For. Sci. 41:360-377. BIOKDI, F., D.E. MYERS, AND C.C. AVERY. 1994. Geostatistically modeling stem size and increment in an old-growth forest. Can. J. For. Res. 24:1354-1368. BOOTS. B. 2002. Local measures of spatial association. EcoScience 9: 168-176. BRUNSDON, C., M. AITKIN, A.S. FOTHERINGHAM, AND M.E. CHARLTor;. 1999. A comparison of random coefficient modeling and geographically weighted regression for spatially non-stationary regression problems. Geo. Envir. Model. 3:47-62. BRUIGSDON, C.A., A.S. FOTHERINGHAM, AND M.E. CHARLTOK. 1998. Geographically weighted regression-modeling spatial non-stationary. The Statistician 47:431-443. B U C K MR.R. ~ , 1962. Growth and yield of red pine in Minnesota. USDA For. Serv. Tech. Bull. 1272. 50 p. CLIFF,A.D., AND J.K. ORD.1981. Spatial processes: Models and
applications. Pion, London. 266 p. CURTIS, R.O. 1967. A method of estimation of gross yield of Douglas-fir. For. Sci. Monogr. 13. 24 p. EK, A.R. 1969. Stem map data for three forest stands in northern Ontario. For. Res. Lab., Sault Ste. Marie, Ontario. Information Report 0-X-113. 23 p.
FOTHERINGHAM, AS., AND C. BRUNSDON. 1999. Local forms of spatial analysis. Geog. Anal. 31:340-358.
distribution using generalized additive models. Plant Ecol. 139:113-124.
AND M. CHARLTON. 2002. FOTHERINGHAM, A.S., C. BRUNSDON; Geographically weighted regression: The analysis of spatially varying relationships. John Wiley & Sons, New York. 269 p.
2003. EEHMANN,A., J. McC. OVERTON,AND J.R. LEATHWICK. GRASP: Generalized regression analysis and spatial prediction. Ecol. Model. 160:165-183.
FOX, J.C., P.K. ADES,AND H. 431. 2001. Stochastic structure and individual-tree growth models. For. Ecol. Manage. 154261-276.
LWTELL,R.C., G.A. MILLIMEN, W.W. STROUP,AND R.D. WOLFINGER. 1996. SAS system for mixed models. SAS Institute, hc.. Cary, NC. 633 p.
FRESCINO, T.S., T.C. EDWARDSJR., .4ND G.G. MOISEN.2001. Modeling spatially explicit forest structure attributes using generalized additive models. 3. Veg. Sci. 12:15-26.
M., AND H.D. QUEDNAU.1995. Statistical analysis of FROHLICH, the distribution pattern of natural regeneration in forests. For. Ecol. Manage. 73:45-57. GETIS,A., AND J.K. ORD. 1996. Local spatial statistics: An overview. P. 261-277 in Spatial analysis: Modeling in a GIs environment. P. Longley and M. Batty (eds.). John Wiley and Sons, New York.
F., M. LOREAU,m~C. MILLER.2002. Spatial structure GOREAUD. and the survival of an inferior competitor: A theoretical model of neighborhood competition in plants. Ecol. Model. 158:1-19. GREGOIRE,T.G. 1987. Generalized error structure for forestry yield models. For. Sci. 33:423-444. GREGOIRE,T.G.. AND 0. SCHABENBERGER. 1996. A non-linear mixed-effects model to predict cumulative bole volume of standing trees. J. Appl. Stat. 23:257-271. AND J.P. BARRETT.1995. GREGOIRE, T.G., 0. SCHABENBERGER, Linear modeling of irregular spaced, unbalanced, longitudinal data from permanent-plot measurements. Can. J. For. Res. 25:137-156.
Lnu. J.,
.LVD H.E. BURWIART.1994. Spatial autocorrelation of diameter and height increment predictions from two stand simulators for lobPolly pine. For. Sci. 40:349-356.
MOEUR,M. 1993. Characterizing spatial patterns of trees using stem-mapped data. For. Sci. 39:756-775. JR. 1999. CenMOISEN,G.G., D.R. CULTER,AND T.C. EDWARDS eralized Pinear mixed models for analyzing error in a satellitebased vegetation map of Utah. P. 37-44 in Quantifying spatial uncertainty in natural resources. Theory and application for GPS and remote sensing, Mowrer, H.T., and R.G. Congalton (eds.). Ann Arbor Press, Chelsea, MI. MOISEN,G.G., IWD T.C. EDWARDS JR. 1999. Use of generalized linear models and digital data in a forest inventory of northern Utah. J. Agr. Biol. Envir. Stat. 4:372-390. MOISEN.6 . 6 . . AND T.S. FRESCINO. 2002. Comparing five modeling techniques for predicting forest characteristics. Ecol. Model. 1.57209-225. MONSERUD, R.A. 1986. Time-series analysis of tree-ring chronologies. For. Sci. 32:349-372. 2002. Spatial prediction of diameter NANOS,N., AND C. MONTERO. distribution models. For. Ecol. Manage. 161:147-158.
GUISAK, A., T.C. EDWARDS JR., AND T. HASTIE.2002. Generalized linear and generalized additive models in studies of species distributions: Setting the scene. Ecol. Model. 157:89-100.
PENNER,M., T. BENTTILA, AND H. HOKKA.1995. A method for using random parameters in analyzing permanent sample plots. Silva Fenn. 29:287-296.
HASTIE, T.J., ~m R.J. TIBSHIRANI. 1990. Generalized additive models. Chapman & Hall, New York. 335 p.
PIELOU,E.C. 1959. The use of point-to-point distances in the study of the pattern of plant populations. J. Ecol. 47:6@7-513.
ISAAKS,E.H., AND R.M. SRIVASTAVA. 1989. An introduction to applied geostatistics. Oxford University Press, New York. 561 p.
H.K., N.G. RAPPAPORT, AND D L . WOOD. 1997. RegresPREISLER, sion methods for spatially correlated data: An example using beetle attacks in a seed orchard. For. Sci. 43:71-77.
1996. Application of non-paraKANGAS,A., AND K.T. KORHONEN. metric kernel regression and nearest-neighbor regression for generalizing sample tree information. P. 631-638. in Proc. of the spatial accuracy assessment in natural resources and environmental sciences symposium, May 21-23, 1996, Fort Collins: Colorado. Mowrer, H.T., R.L. Czaplewski, and R.H. Namre (eds.). USDA For. Serv. Gen. Tech. Rep. WMGTR-277.
T. 1989. Prediction of tree diameter and height in a PUKKALA, Scots pine stand as a function of the spatial pattern of trees. Silva Fenn. 23:83-99.
K E N ~ LN.C.; : J.A. HOSKINS,AND W.D. HOSKINS.1989. Local competition in a naturally established jack pine stand. Can. J. Bot. 67:2630-2635.
T., AND T. KOLSTROM.1987. Competition indices and PUKKALA, the prediction of radial growth in Scots pine. Silva Fenn. 2155-67. D., D. WHITE,J.C. SIFNEOS,AND R.M. HUGHES.1999. RATHERT, Environmental correlates of species richness for native freshwater fish in Oregon, USA. J. Biogeog. 26:1-17.
LAPPI,J. 1991. Calibration of height and volume equations with random parameters. For. Sci. 373781-801.
REED,D.D., AND H.E. BURKHART. 1985. Spatial autocorrelation of individual tree characteristics in loblolly pine stands. For. Sci. 31575-587.
LEE, J., AND D.W.S. WONG.2001. Statistical analysis with ArcView GIS. John Wiley and Sons, Inc., New York. 192 p.
WC. 2002. SASISTAT Users' guide, version 9.0. SAS INSTITUTE, SAS Institute, Inc., Cary, NC.
LEHMANN,A. 1998. GIs modeling of submerged macrophyte
SCHABENBERGER, O., AND T.G. GREGOIRE. 1995. A conspectus on Forest Science 51(4) 2005
345
estimating function theory and its application to recurrent modeling issues in forest biometry. Silva Fenn. 29:49-70. O., ~m F.J. PIERCE.2002. Contemporary staSCHABENBERGER. tistical models for the plant and soil sciences. CRC Press, Boca Raton, FL. 738 p.
H., AND G.M.J. MOHREN.1988. AutocorrelaSCHOONDERWOERD, tion and competition in even-aged stands of Douglas-fir in the Netherlands. P. 619-626 in Forest growth modeling and prediction. USDA For. Serv. Gen. Tech. Rep. NC-120. SHI, H., AND L. ZHANG.2003. Local analysis of tree competition and growth. For. Sci. 49:938-955.
TIEFELSDORF, M. 2000. Modeling spatial processes: The identification and analysis of spatial relationships in regression residuals by means of Moran's I. Lecture notes in earth science 87. Springer, New York. 167 p.
M., IWD B. BOOTS.1997. A note on the extremities TIEFELSDORF, of local Moran's 1,'s and their impact on global Moran's I. Geog. Anal. 29:248 -257. VENABLES, W.N., Am B.D. RIPLEY.1997. Modern applied statistics with S-Plus, 2nd ed. Springer, New York. 548 p. YANG,Y. 1984. Autoregression analysis of forest growth. Quart. J. Chin. For. 17:l-11.
SOUL, R.R., N.L. ODEN, AND B.A. THOMSOK.1998a. Local spatial autocorrelation in a biological model. Geog. Anal. 30:331-354.
WELLS,M.L., AND A. GETIS. 1999. The spatial characteristics of stand structure in Pinus touveyana. Plant Ecol. 143:153-170.
SOKAL,R.R., N.L. ODEK, A ~ DB.A. THOMSON.1998b. Local spatial autocorrelation in biological variables. Biol. J. Linnean SOC.65:41-62.
AND A.W. DAVIS.1984. Problems WEST,P.W., D.A. RATKOWSKY, of hypothesis testing of regressions with multiple measurements from individual sampling units. For. Ecol. Manage. 7:207-224.
STAGE:A.R., AND W.R. WYKOFF.1993. Calibrating a model of stochastic effects on diameter increment for individual-tree simulation of stand dynamics. For. Sci. 39:692-705. TASISSA,G., A m H.E. BURKHART. 1998. An application of mixed effects analysis to modeling thinning effects on stem profile of loblolly pine. For. Ecol. Manage. 103:87-101.
344
Forest Science 51(4j 2005
ZHANG,L., H. BI, P. CHENG,AND C.J. DAVIS.2004. Modeling spatial variations in tree diameter-height relationships. For. Ecol. Manage. l89:3 17-329. ZHANG,L., AND H. SHI. 2004. Local modeling of tree growth by geographically weighted regression. For. Sci. 50:225-244.