complex psychophysical problems (e.g. see Wightman,. 1973) but ignore or ...... Joseph Molinari in coordinating this collaborative effort. References. Adams, J.C. ...
Biological Cybernetics
Biol. Cybern. 47, 149-163 (1983)
@ Springer-Verlag 1983
Spatial Cross-Correlation A Proposed Mechanism for Acoustic Pitch Perception Gerald E. Loeb*, Mark W. White, and Michael M. Merzenich Coleman Laboratory, Department of Otolaryngology, University of California at San Francisco, San Francisco, California, USA Laboratory of Neural Control, IRP, National Institute of Neurological and Communicative Disorders and Stroke, Bethesda, Maryland, USA
*
Abstract. We propose in this paper a new class of model processes for the extraction of spectral information from the neural representation of acoustic signals in mammals. We are concerned particularly with mechanisms for detecting the phase-locked activity of auditory neurons in response to frequencies and intensities of sound associated with speech perception. Recent psychophysical tests on deaf human subjects implanted with intracochlear stimulating electrodes as an auditory prosthesis have produced results which are in conflict with the predictions of the classical place-pitch and periodicity-pitch theories. In our model, the detection of synchronicity between two phase-locked signals derived from sources spaced a finite distance apart on the basilar membrane can be used to extract spectral information from the spatiotemporal pattern of basilar membrane motion. Computer simulations of this process suggest an optimal spacing of about 0.3-0.4 of the wavelength of the frequency to be detected. This interval is consistent with a number of psychophysical, neurophysiological, and anatomical observations, including the results of high resolution frequency-mapping of the anteroventral cochlear nucleus which are presented here. One particular version of this model, invoking the binaurally sensitive cells of the medial superior olive as the critical detecting elements, has properties which are useful in accounting for certain complex binaural psychophysical observations.
Introduction It has recently become possible to directly test theories of the neural mechanisms underlying pitch perception by eliminating the complex transduction processes of the middle and inner ear and directly activating the sensory neurons in a localized and controlled manner.
Profoundly deaf subjects have been chronically implanted with intracochlear electrode arrays in an attempt to bypass their defective hair cells, which normally transduce mechanical vibrations traveling along the basilar membrane into a temporospatial pattern of discharges in the distributed auditory nerve fiber population (Simmons, 1966; Michelson, 1971 ; Clark et al., 1977; Tonndorf, 1977; Eddington et al., 1978; Merzenich et al., 1979; Tong et al., 1979; Michelson and Schindler, 1981). As we shall discuss here, perceptions of sound evoked by electrical stimulation in these patients cannot be reconciled with currently dominant theories of how the nervous system normally extracts pitch information from patterns of neural activity generated by acoustic input. Although this is a new and unfamiliar source of psychophysical data, it represents a powerful tool whose underlying physical processes are beginning to be better understood (see Merzenich, 1973 ; Ranck, 1975 ;Marks, 1977 ; Pollen et al., 1977; Kiang et al., 1979; Black et al., 1981). We have been exploring the possibility that patients' pitch sensations arise from changes in the synchronicity of firing among the neurons reaching threshold over fairly extended regions of the auditory nerve array. A neuronal model of normal acoustic pitch perception can be built on such a concept which is simple and which can account for psychophysical effects that are difficult to explain by invoking either "place-pitch" or "periodicity-pitch" models (see below). This spatiotemporal model is consistent with the described neuroanatomy and physiology of brainstem auditory nuclei. This latter point is particularly important, as current place- and periodicity-pitch theories are abstract constructs of signal theory which address complex psychophysical problems (e.g. see Wightman, 1973) but ignore or even contradict anatomical and physiological descriptions of the auditory nervous system. A previous attempt to invoke spatial crosscorrelation to account for sharpness of tuning in cochlear
150 MECHANISMS FOR PITCH PERCEPTION
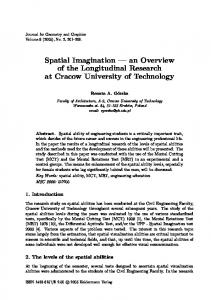
Fig. 1. Human auditory perceptual range (top) divided into three regions likely to be subserved by different pitch perception mechanisms. Pure place pitch (Helmholtzian) LOUDNESS is adequate only for high frequencies (sharply tuned) and low amplitudes (below neural \L: : saturation). Pure rate pitch is available only for frequencies below the limits of sustained 10 neural firing rates (less than 500 pps). The central reg&, subserving most of the speech perception requirements, utilizes the phaseNEURAL TONE PHASE HUMAN FUSION FIRING LOCKING HEARING locking of neural discharge which is LlMlT LlMlT LlMlT increasingly stable at higher sound intensities. The typical tuning curve of single auditory SINGLE NEURON nerve fibers and AVCN cells (middle) demonstrates very little frequency selectivity at intensities typical of normal speech. This, combined with the tendency of neurons to saturate at their maximal firing rates, 10 accounts for the flat profile of neural activity C.F. in the auditory nerve for high amplitude, ACOUSTIC STIMULUS FREQUENCY single frequency stimuli (bottom). Note that the basilar membrane tuning of decreasing frequency with increasing distance from the MEAN AUDITORY cochlear base has been indicated by reversing NERVE ACTIVITY the frequency axis in the bottom figure, pivoting it around the characteristic frequency PPS 250 of the middle figure. In this and all other figures, basilar membrane position is given in millimeters from the basal entry point of the BASE 5 10 15 20 25 30 ( 2 0 ~ traveling ~) wave, rather than as the more (20,000 Hz) conventional but reversed cochlear place BASllAR MEMBRANE POSITION, mm TRAVELING WAVE (distance from the apex) 120
-
t
-
afferents called for a complex synaptic interaction between inner and outer hair cell afferents which now seems unlikely (Nieder, 197la, b). In this paper, the kinds of spectral information normally present in the auditory nerve array and the previously proposed neural models for extracting this information are reviewed. Using new data on the activity patterns induced in the auditory system by intracochlear electrical stimulation, the perceptions reported by auditory prosthesis patients are contrasted with the predictions of these models. A new class of spectral detectors which extract "synchronicity-pitch" by a process of spatial crosscorrklation is then described. Some psychophysical and neuroanatomical predictions derived from modeling this process and data consistent with these predictions are reviewed. Finally, the utility of this theory in accounting for complex psychophysical phenomena is briefly discussed. Preliminary discussions of some aspects of this theory and some data have been presented elsewhere (White, 1980; White et al., 1980, 1981; Loeb et al., 1980, 1981 ; Merzenich et al., 1980). Previous Models
The psychophysics and neurophysiology of pitch perception suggest that there are three distinct bands of
SEX
human sound perception, covering the range 20-20,000Hz (Fig. 1). Each appears to involve different information extraction strategies in the auditory system. We here use the term "pitch" to denote any perceptual experience for which a subject could determine a matching sinusoidal tone. We are primarily concerned with mechanisms by which the spectral frequencies present are converted to an internal neuronal representation which is approximately isorepresentational. We also assume that the transduction and pitch detection mechanisms of most mammals including man are comparable in their general form. Place Pitch. The highest frequencies, about 5000 to 20,000 Hz, are probably detected and discriminated as a result of mechanically tuned resonance along the basilar membrane of the cochlea, somewhat as proposed by Helmholtz (1863). Sound energy from a tone is coupled into the basilar membrane at the base of the spiral and travels apically through progressively lower frequencies of resonance until it reaches the region tuned to its frequency. There the amplitude of vibrations reaches a maximum, and there local hair cells and auditory nerve fibers are excited, giving rise to the "place pitch" (Bekesy and Rosenblith, 1951). The traveling wave is then very rapidly damped by a process which is still pdorly understood (Wilson and
Johnstone, 1972). The psychophysics of pitch perception in this band are consistent with the tuning curves of auditory nerve fibers (Moore, 1973). We here use the term "place pitch" to indicate the class of pitch extraction theories based solely on a spatial gradient of neural activity, ignoring temporal cues. Auditory nerve fibers have sharp enough tuning curves and broad enough dynamic range to account for the relatively modest frequency discrimination limens achievable at these higher frequencies. Rate Pitch. The lowest frequencies, which travel farthest apically, are amenable to an additional method of encoding. With vibrations from 20 to about 300-500 Hz, auditory nerve fibers can generate spikes on virtually every stimulus cycle (Rose, 1970), much as the somatosensory vibratory receptors, the Pacinian corpuscles, signal the frequency of vibratory stimuli applied to the skin (Mountcastle et al., 1967). Such a pitch mechanism has been demonstrated psychophysically using pulsed high frequency sinusoids (Thurlow and Small, 1953) and amplitude modulated noise (Harris, 1963). This "rate pitch" may account for the demonstrated ability of single channel auditory prostheses to provide patients with useful information about the first formants of speech sounds even when the focus of electrical stimulation is far basal to the normal regions of mechanical tuning of these frequencies (Bilger, 1977 ; White, 1980). Periodicity Pitch. The mid-range, from about 500 to 5000Hz, is both the most important for speech perception and has the most complex physiology and psychophysics. Simple place-pitch alone is inadequate to explain the excellent frequency discrimination which we possess in this range for complex (multi-frequency) stimuli over a dynamic range of over 100 dB (100,000) (see Palmer and Evans, 1979; Sachs and Young, 1980). Even moderate intensity sounds (i.e. of the level of speech recognition thresholds) drive most of the auditory nerve fibers at near their maximal firing rates over many millimeters along the basilar membrane (Rose et al., 1974; reviewed by Evans, 1978). However, accuracy in frequency discrimination and in spectral resolution of complex sounds (like speech) is actually improved as sound level increases (Wier et al., 1977). Simultaneously presented frequencies interfere with the psychophysical detection of each only when they have resonances closer than the critical band spacing of about 1.3mm (Greenwood, 1961; Scharf, 1970). [Wide dynamic range units, which probably would not saturate, have been identified in the cat dorsal cochlear nucleus (Evans and Palmer, 1975). However, these appear to reflect the results of more sophisticated signal extractors than a placelintensity discriminator, presumably located in higher centers which project
back onto the dorsal cochlear nucleus (Adams and Warr, 1976; see Brugge and Geisler, 1978).] It is probable that the nervous system makes use of phase-locking of discharges generated by these midrange frequencies (Anderson et al., 1971). For acoustic stimuli from about 500 to 5000 Hz, no single neuron can fire fast enough to follow each stimulus cycle, but rather each tends to fire on randomly changing subharmonics of the incoming frequency. That is, it is most likely to fire only when the local region of the basilar membrane which it monitors is in a certain phase of its vibration. Taken together, a population of such independent detectors could, in fact, collectively synthesize the complete input frequency (Wever, 1949 ; Boudreau, 1965). Such population following responses were first observed in recordings of auditory nerve evoked potentials and ascribed to this "neural volleying" (Derbyshire and Davis, 1935). Various neuronal mechanisms have since been proposed by which the interspike intervals in the ascending multifiber volley could be processed to determine the spectral input causing them (see Licklider, 1951 ; Nordmark, 1968 ; Siebert, 1970; Goldstein and Srulovicz, 1977 ; Langner, 1981). A common feature of all has been the assumption that the intervals could be detected by processes related to temporal autocorrelation. A periodicity in a complex incoming signal may be detected by delaying the signal by that period and non-linearly combining (usually multiplying) the delayed and undelayed signals. An array of such detectors, each with its own preceding delay, can perform the equivalent of a Fourier spectral analysis on the signal. Since temporal information is not lost when rate saturates (it is, in fact, enhanced), the output of such an array can be further processed to account for complex psychophysical phenomena (e.g., see Goldstein, 1973 ; Goldstein and Srulovicz, 1977). This model of periodicity detection has been attacked on several grounds (see Whitfield, 1970, 1979). First, neuroanatomical pathways and known physiological properties of brainstem auditory neurons do not appear to provide a substrate for the generation of the requisite delays and recombinations. The phaselocked volleying does appear to traverse at least two specialized synapses, passing from spiral ganglion (auditory nerve) cells to "primary-like" anteroventral cochlear nucleus cells (AVCN) (Pfeiffer, 1966), and on to medial superior olivary nucleus (MSO) (Boudreau, 1965). Other third order recipients of phase-locked information include the medial nucleus of the trapezoid body and the dorsal nucleus of the lateral lemniscus (see Goldberg, 1972). On all three of these pathways, the range of relative delays being inserted in the ascending signals prior to their recombination is not great enough for autocorrelation detection of, for
/
1Vrms 0.1
,
, , , ,,,,, , , , ,,,,,, , 1D [ 161
(22)
,!%I
%'k%l
Frequency
A
Cycle Histogram (3200 Hz sine Stimulus - 0.31 2 5 ms) 100 D B
m
-
-0;0. 0.000
0.102
0.204
I
0.306
Time (in milliseconds)
0.000
6
0.102
0.204
0.306
Time (in milliseconds)
Pig. 2A and B. Electrical stimulation of a unilaterally ototoxically deafened cat cochlea using a scala tympani electrode array (inset in A). In A, the horizontal axis has been established in the dimension of characteristic frequency (and corresponding basilar membrane position) by recording from eight inferior colliculus cells while acoustically stimulating the contralateral (intact) ear. The thresholds of these same cells to various configurations of intracochlear stimulation indicate localized effect of stimulus with gradual recruitment of neurons from symmetrically adjacent regions of the basilar membrane as stimulus intensity is increased. From White, 1978. Cycle histograms (B) of a single unit recorded from the AVCN in another preparation show that sinusoidal electrical stimulation causes a strong phase-locking of the neural activity as soon as threshold is reached
example, a 500Hz tone (2ms period). The temporal interaction of signals from each ear at MSO neurons, for example, suggests that delay differences in the ascending pathways are generally less than 0.5ms (Moushegian et al., 1967), exactly what is required for stereophonic sound localization. Furthermore, it is difficult to imagine how larger delays could be generated with the necessary precision and stability to account
for frequency discrimination limens (see below and Whitfield, 1970). A second objection to these periodicity detection models arises from the apparent absence of certain periodicity pitch sensations which might be expected from the interaction of multitonal stimuli. In an anharmonic series of tones with constant frequency difference (e.g., 700, 900, 1100 Hz) the perceived pitch corresponds to a "missing fundamental" of around 225 Hz or 175 Hz rather than the 200Hz frequency which is strongly represented in the interval histogram of the auditory nerve fibers (Schouten, 1940; de Boer, 1956; Whitfield, 1970, 1979). This has been interpreted as indicative of a more dominant pattern recognition mechanism (Goldstein, 1973) in which the pitch perception is arrived at by a best-fit determination of the underlying fundamental frequency which could best account for the higher frequency overtones actually present (themselves presumably resolved on the basis of spike train periodicities). With acoustic stimulation, it is impossible to control selectively the various periodicities and places of auditory nerve activation, and therefore impossible to test cleanly the periodicity detection model. However, this can be accomplished by direct electrical activation of auditory nerve fibers. Phase-locking of the second order AVCN cells appears to be maintained during intracochlear electrical stimulation. Figure 2B shows phase-locking to a 3.2 kHz sinusoidal stimulus which is, in fact, superior to that obtainable with acoustic stimuli. Figure 2A indicates that for this orientation of stimulating electrodes and over this range of current, auditory nerve fibers from only a sharply delimited sector of the basilar membrane reach threshold. Despite this, patients do not report pitch sensations that can be related to the actual frequency of stimulation for frequencies over 300-500Hz of stimulation (Eddington et al., 1978; Shannon et al., unpublished observations). Rather, they report pitch sensations which are dominated by the characteristic frequency of the place of stimulation and weakly modulated by the frequency of stimulation (see Fig. 3). Modulation of pitch occurs almost exclusively with frequencies in the rate pitch range (below 300-500Hz); only minor effects are reported within the periodicity pitch range (500-5000 Hz), even when these frequencies are applied to regions of the basilar membrane which are normally tuned to them. It could be argued that the pitch sensations under these circumstances are dominated by a place-pitch mechanism looking for edges in the activation pattern (Allanson and Whitfield, 1955). For such mechanisms to cope with the assymetrical nature of the tuning curves of auditory nerve fibers above threshold, the placepitch processing circuit should be selectively influenced by the relatively sharp roll-off in firing rate at the "leading edge" (apical end) of the activated region (see Evans, 1978). Increasing the
Basilar M e m b r a n e Motion 2.W Hz Tone at Various Phases
VA"
360°
0' = Peak at C.F.
o
~ 0
(
I 20
I 40
I I I 60 Scaled pitch
I
I 80
I
I 100
Fig. 3. Relative perceived pitch (arbitrary scale, 100=highest) of brief pulse electrical stimuli at various repetition frequencies (in boxes) delivered to various electrodes of an intracochlear array in an auditory prosthesis patient (from Eddington, 1980). Electrode six was most basal and elicited the highest pitches; electrode 1 was most apical, where lower frequencies of sound would normally be tuned in an intact cochlea. Note that the effect of stunulus frequency was electrode specific and was decreasingly important at higher frequencies (ratio of 300 : 175= 175 : 100 but is perceived as much less of a step in pitch). Neither this nor any other similar patient has been reported to have significant perceived pitch modulation for stimuli greater than 500Hz and most cannot discriminate at all among stimuli over 1OOOHz when loudness is equalized. We have recently obtained very similar data for sinusoidal stimuli, as well
amplitude of electrical stimulation at a given locus in the scala tympani results in a roughly symmetrical extension of the region reaching threshold in both the apical and basal directions around the electrode (see Fig. 2A). However, patients report that only loudness, not pitch, changes significantly despite the apical shift of the leading edge of the excitation pattern. In fact, our most recently studied patient actually reported small pitch increases with increasing loudness -the opposite of what is predicted by the leading-edge phenomenon.
Synchronicity Pitch. Even if periodicity is not directly detected by the auditory nervous system, it seems inescapable that it must be making some use of the temporal information inherent in phase-locking. Fortunately,the temporal autocorrelator for periodicity detection is only one form of the more general class of cross-correlators which can be used to detect patterns in time and space. Studies of basilar membrane motion established that the structure conveyed traveling waves one-forone with the acoustic input (Bekesy and Rosenblith, 1951) rather than having a standing wave resonance as assumed by Helmholtz (1863). A disturbance of a given frequency p.ropagates at a velocity which increases exponentially until it approaches its region of mechanical resonance, where velocity decreases rapidly as amplitude peaks and decays abruptly. This results in distinctive and similar patterns in space for all frequencies in their respective regions of resonance (Nieder, 1971a; Pfeiffer and Kim, 1975). Since we are particularly concerned with the resolution and perception of pitch at sound intensities significantly above
Basilar Membrane Motion Variaus Frequencies Frozen at Peak Phase at C.F.
BASE1
*
'
'
5 - , I
10 I
,
,
;
;
15
'
20 rnrn ,,-APEX
Fig. 4A and B. Traveling waves on the basilar membrane are shown as instantaneous displacement vs. cochlear position (greatly magnified and arbitrary vertical scale). Double arrows on each trace indicate points at which phase-locked neural activity would be simultaneously at the same probability of firing. Note that as the wave approaches its region of tuning (top), these synchronous activity intervals move both apically and closer together. There is thus no possible ambiguity with synchronous intervals generated by other frequencies passing through the region (bottom). The complete damping of the traveling wave past its position of resonance eliminates ambiguities which might arise from multiple wavelength intervals
threshold, we can ask how such spatiotemporal patterns among a spatially distributed set of afferent neurons might best be detected by the nervous system. Figure 4A shows the location of the peaks and valleys of the traveling wave (greatly magnified, arbitrary vertical scale) as the vibrations of a single frequency tone travel from the base to the region of resonant vibration for that frequency, after which they die out. This figure is based loosely, for illustrative purposes, on curves calculated by Greenwood (1973, 1977, 1980) to fit Rhode's (1970, 1971) mechanical data from squirrel monkey. The calculations agree closely with the neural data of Anderson et al. (1971), more recent mechanical data of Rhode (1978), and, when scaled to the cat, as done here, they agree with neural phase vs. place data of Pfeiffer and Kim (1975). For sounds of moderate intensity (levels required for speech perception and certain other complex psy-
chophysical tasks), neurons from a segment of the cochlea several millimeters long will have reached firing threshold. From Fig. 4A and B, it is apparent that the frequency of the various tones illustrated could be determined without ambiguity by a set of detectors, each of which would look for the synchronous generation of activity at two points on the basilar membrane. The spacing would equal the wavelength of the vibration caused by the particular frequency being detected. No ambiguity arises from synchronous intervals two wavelengths apart because the high frequencies with wavelengths short enough to fit multiple complete cycles on the basilar membrane are virtually eliminated by the high roll-off mechanical filtering at the basal end where they are tuned. We will first explore the neuronal circuit requirements for a spatial crosscorrelator capable of detecting the synchronicity at intervals of one wavelength. However, this is intended only as an intuitively simple representation of the general class of spatiotemporal crosscorrelators. We shall later show that it is neither the most likely nor even the most efficacious. A Neuronal Model for Synchronicity Pitch Detection
Determination of Temporal Sensitivity. For this (or any other) crosscorrelator to work, the detector element must be sensitive to the differences in the relative timing of the input signals arising from two frequencies which are just discriminable using only phase-locked cues. The resolving power of this part of the pitch discrimination system is readily demonstrated by listening for the just noticeable frequency difference (dF) of a just perceptible sinusoidal stimulus (F) in the presence of loud white noise. The noise causes virtually all auditory nerve fibers to be driven at saturation, depriving the higher order system of any place related rate of firing cues from the added tone. Under these circumstances and for tone frequencies 500-2000 Hz, Dye and Hafter (1980) have shown that dF/F approaches a constant 2 % as the masking noise is increased from 14 to 60dB with E / N , (signal to noise) held constant near threshold. At 4000 Hz, d F degrades to about 5 %. This places the lower bound of temporal detection at 10 ps, i.e. 2 % of the 0.5 ms period of the 2 kHz tone. Since psychophysical performance presumably represents the higher order determination of changes in the output of the entire ensemble of neural detectors, this sensitivity need only reflect small probability of firing changes in a given detector. However, the changes must be statistically significant in at least some detectors at these increments. Selection of the MSO as the Detector. The above temporal sensitivity is difficult to reconcile with typical neurosynaptic processes, which have millisecond time
courses. However, the mammalian auditory system is already known to contain one group of neurons which appear to have the requisite sensitivity, although the mechanism by which they operate remains unknown. Single neurons in the cat MSO have been shown to respond to differences in the timing of impulses (from the two ears) of much less than 100 ps (Galambos et al., 1959 ; Moushegian et al., 1967 ; Watanabe et al., 1968 ; Goldberg and Brown, 1969). These neurons are likely to provide the basis for binaural sound localization based on the delay in the arrival of sound at the two ears caused by their separation on the head (see Jeffress, 1948 ; Goldberg and Brown, 1969). Hall (1965) modeled the ensemble sensitivity using properties from a sample of binaurally sensitive MSO cells and found sensitivities of 5-10 ps, in good agreement with psychophysical performance (Mills, 1958). A number of pieces of circumstantial evidence combine to suggest that the MSO is the site of the extraction of the phase-locked information from each cochlea and that, furthermore, this extraction cannot be a temporal autocorrelation as suggested for periodicity detection. First, the pathway from the auditory nerve through the AVCN to the MSO is the principle projection pathway in which phase-locking is preserved over the necessary frequency band. Second, the MSO is a primary relay for the low and intermediate band outputs of the cochlea, and it becomes increasingly prominent in primates and other mammals which have evolved mechanisms for the perception of complex sounds and vocalizations (Irving and Harrison, 1967; Masterton et al., 1975). Third, MSO neurons have a unique dendritic architecture which presumably accounts for their extreme temporal sensitivity (Scheibel and Scheibel, 1974; Schwartz, 1977). Fourth, the inputs to the MSO do not appear to have large added delays required for temporal autocorrelation (as discussed previously). Fifth, the simultaneous extraction of both intracochlear and intercochlear delays at a single detector leads to a simple explanation of certain complex binaural effects (as discussed later). However, it should be noted that some or all of the detection task could be performed by any nucleus receiving phase-locked information (such as the dorsal nucleus of the lateral lemniscus) without necessarily invalidating the general principles of the spatial crosscorrelation model. A Prototypical Form of the Model. Figure 5 illustrates the basic circuitry of a synchronicity-pitch detector located in the MSO, and operating on a full wavelength of spatial separation of the inputs. The binaural basilar membrane motion for the tonal stimulus f, is shown as the heavy oscillating line. A second pattern of basilar membrane motion arising from the lower
1
11 I I
Proposed Neural Detector for Synchronicity Pitch 3 3
0,
6 $a
b)
=E
:a E i.h.c. a
S.G. A.V.C.N.
M.S.0.
A.V.C.N.
S.G, i.h.c.
83 %2
fP = (a x b) x (C x d)
\ -4 Left Ear
7
. J Right Ear
frequency stimulus j2 is shown in the right cochlea only (dashed line). At the instant in time depicted, the activation by f, of two groups of inner hair cells (i.h.c.) in each cochlea has reached maximum. Their signals are conveyed by the spiral ganglion cells (S.G.) comprising the auditory nerve to the AVCN, where they form secure synapses with only very local convergence on the large spherical cells. The bilateral AVCN activity is shown as four time dependent (phaselocked) input signals to a given MSO cell. The output function of this cell, f,*,is the non-linear (here, multiplicative) combination of these four signals. Thus, it should be maximal at the instant shown here, since all four inputs are maximal as a result of the coincidence of basilar membrane peaks which, in turn, results from the presence of a stimulus with the appropriate wavelength and interaural delay. Some of the same ascending elements could be equally excited by the j2 stimulus [a(t) and c(t)]. However, other inputs [see b(t) and d(t)] are then at their minima for this wavelength. The dotted elements indicate other ascending pathways and crosscorrelational elements, f,*,which would respond maximally to this stimulus. There would also be MSO elements (not shown) which would respond optimally to the j, stimulus, but only when it occurred with an appropriate interaural delay. In these cases, the phase difference in the input to one ear would, possibly, be compensated by equal delays in the transit time through the contralateral AVCN pathways. The MSO cell upon which these four inputs (two ipsi- and two
Fig. 5. Schematic diagram of an ascending pathway which might subserve pitch perception by detecting synchronicity among spatially distributed auditory nerve fibers. The line marked f, indicates the basilar membrane deflections caused by that frequency of sinusoidal stimulation presented in phase to both ears. This is detected by the inner hair cells (i.h.c.), conveyed as neural impulses in the spiral ganglion (S.G.) cells of the auditory nerve to a simple relay in the anteroventral cochlear nucleus (A.V.C.N.) and binaurally to the medial superior olive (M.S.O.).There a hypothetical detector cell, f:, becomes maximally activated by the nonlinear summation of four synchronously phase-locked inputs: a(t), b(t), c(t), and d(t). Dashed basilar membrane curve f, indicates the deflections caused by another frequency which would be detected by the two MSO detector cells labeled f,*. Note that activity in a given auditory nerve fiber and AVCN cell can contribute to the sensation of more than one pitch. Conversely, the detection of a given pitch can be performed using activity originating from different places on the basilar membrane. Note also that as long as none of the MSO input functions are allowed function to forhave monaural a valueasofwell zero, as the binaural detector acoustic cells will stimuli
contralateral) converged would receive a synchronous input and therefore generate a maximal output only when the j, stimulus originated from a certain lateral position in space. (Monaural pitch perception could be accomodated either by the nature of the actual combination operator or by the normally occurring nonzero spontaneous activity present in the auditory nerve fibers even in the absence of acoustic input.) Thus, in this model each MSO cell actually functions as a four-way crosscorrelator, tuned spatially to the same wavelength in each cochlea and temporally to a particular delay between the two cochleas. The output of an array of such detectors can be conceived as a two dimensional matrix in which there is a separate position for each discriminable frequency at each locatable angle of azimuth for the source. The MSO has been chosen in this particular model because an extension of its known binaural time sensitivity to two or more monaural inputs results in this output matrix without requiring phase-locked signal detection at higher centers. Properties oj Alternate Forms of the Model. As alluded to earlier, this simplified model is not the only useful realization of a spatial crosscorrelation detector. In particular, the stipulation that the points compared with each other on the basilar membrane be exactly one wavelength apart is unnecessary and, perhaps, unlikely. We have modeled the frequency discriminability to be expected from crosscorrelators operating at a variety of spacings with respect to the wavelength to
OUTPUT OF SPATIAL CROSS-CORRELATORS SAMPLING NON-INTEGER WAVELENGTHS D=
A,
neural activily
x*i---.Jvv
df Discriminabilily
df = 1 Hz
1.1
1.5
D (X 1 . I1 units)1 . 5
2.9
Cross-Correlation Distance
Fig. 6. Output of spatial cross-correlators sampling non-integer wavelengths. Idealized modeling of spatial cross-correlation performed on traveling waves of two frequencies by detectors spaced one f, wavelength (left panel) and one-third f, wavelength (right panel) apart. The discriminability of the two frequencies is indicated by the difference in output of the cross-correlators when presented with the f, and f, waveforms. Top cross-correlation result minus second result gives resultant in third trace (scaled up by factor of 10). Integration over the full cycle (fourth trace each panel) gives relative discriminability factor X*. Function at bottom center indicates the relative discriminability of cross-correlators operating over spatial separations of 0-2 times the wavelength of the reference frequency (for an arbitrarily small frequency shift of 1 Hz). Note the local maximum at 0.3-0.41, which is actually greater than the discriminability of the full wavelength cross-correlator. Crosscorrelation distances greater than one wavelength are presumed to be nonphysiological and included only for reference
be detected. Figure 6 summarizes the somewhat surprising finding that non-integer wavelength separations produce superior frequency discrimination limens (dF). This is because the multiplication of a sinusoidal peak by its rising edge produces a more rapid amplitude change as the wavelength is compressed (i.e. frequency increases) than does the multiplication of two peaks. As Fig. 6 shows, sampling intervals corresponding to 0.3-0.4 cycles of phase shift give a cross-correlator output which, while considerably smaller than that of the one wavelength (one cycle) detector, is about equally rapidly changing as input frequency is changed. This smaller spacing would thus
work equally well, with the added advantage that it would operate at lower sound levels, i.e. when the extent of the basilar membrane vibrating at suprathreshold amplitude is more limited. (At near threshold sound levels, pitch discrimination is accounted for by a simple place pitch mechanism using the sharp tuning curves for these levels.) The above 0.3-0.4 wavelength intervals are approximately equal to the critical band, when that frequency interval is expressed as a basilar membrane spacing. From behavioral measurements of critical ratio (tone threshold minus wide band noise level), Scharf (1970) and Pickles (1977) estimated the cat critical bands at
about 1 mm at 1 kHz. From Fig. 4B, this corresponds to about 0.4 cycles of phase shift (on the basal side of the point of resonance). This distance places an upper bound on the useful crosscorrelation interval in the presence of complex sounds. It is conceptually similar to the spatial domains of phase-locking reported for vowel formant frequencies (Sachs and Young, 1980). On either side of the critical band, neurons tend to become phase-locked to their own characteristic frequencies, if present, rather than staying phaselocked to the center frequency stimulus of the critical band. This accounts for the ability to discriminate vowels with only small spectral differences even at high sound intensities. The model presented in Fig. 5 incorporates two other simplifications which are neither required nor necessarily useful. First, there is no requirement that the cross-correlation from each cochlea involve only two discrete excitatory inputs from each AVCN. Higher order cross-correlations, which we have not modeled, might well contribute to improved sensitivity. Also, the entirely hypothetical mechanism for the nonlinear, time-sensitive combination of the inputs (perhaps occurring distally in the dendrites) leaves open the possibility of multiple, independent cross-correlational processes within a given MSO cell. While it is interesting to note that the MSO is probably populated primarily by cells with excitatory inputs from both ears [based on a very small but anatomically well defined sampling by Guinan et al. (1972)], many nonlinear interactions between the two ears can be successfully employed by a model detector. Second, the model shown here employs the AVCN relay to introduce delays only in the MSO arrival times between the two ears, not between inputs from each cochlea. At least small delays can be inserted anywhere by virtue of changes in the relative lengths or conduction velocities of the projecting axons. For example, a nonoptimal spacing of sampling points along the basilar membrane can be made more optimal by inserting a delay in one sampled signal equal to the basilar membrane travel time to the desired sampling point. (In the extreme case, the use of temporal delay instead of spatial interval converges with the temporal autocorrelator model.)
Relationships to Previous Models. There are inherent similarities in the various manifestations of nonlinear signal analyzers. However, in elucidating the neuronal mechanisms involved, one must concentrate on their differences. A true temporal autocorrelation process such as the generation of interspike interval histograms from a single auditory nerve fiber (from which a fundamental period can readily be calculated) requires delays at least as long as the minimum firing interval of the source plus one signal period, i.e., at least 3000 ps to detect 1 kHz. A temporal cross-correlator operating on periodicity in a population of fibers requires a one signal period delay (1000 ps at I kHz). The above argument regarding the cross-correlation of spatial separations which are less than one full wavelength applies equally well to temporal cross-correlators, so we might expect good discriminability with a more plausible 3 0 0 ~ sdelay. The spatial cross-correlator which we propose effectively uses the physical wave
conduction process on the basilar membrane to generate the delayed sampling of the input acoustic signal as a whole ; i.e. the cochlea functions as a tapped delay line. The remainder of the system can then operate with a neural delay of 0 ys, hence the term synchronicity-pitch. However, our model system as a whole, including the basilar membrane, does actually constitute a set of temporal autocorrelators for spectral analysis using any delay necessary (subject to the limitations of travel time and the extent of the array of detectors above threshold). As Whitfield (1979) has pointed out, a neural system capable of resolving the difference between physical processes occurring at, for example, zero vs. 20 ps intervals seems plausible (in fact, inevitable). The ability to respond selectively to intervals of 1 0 0 0 ~ s . 1020 ps (the periods for the above noted 2 % frequency discrimination limen at 1 kHz), or even 300 vs. 306 ps (using 0.3 of the period), is a different class of problem. The use of physically imbalanced neural pathways (e.g. differing in conduction velocity or distance) to generate such delays might be expected to cause large instability problems with even small changes in factors such as temperature or ionic content of the extracellular environment. Such problems are less severe for the sound localization task since performance is best for near straight ahead localization (zero delay) and for relative rather than absolute location tasks (Stevens and Newman, 1936; Mills, 1958; Williams, 1978). The complex and critical interactions among small increments of time and space in these calculations would have interesting implications for the normal development of such a system. It seems highly unlikely that connectivity with this precision could be specified genetically and assembled without the benefit of experience. It is interesting to note that synchronicity of arrival among presynaptic signals and postsynaptic events has long been proposed as the critical element for the development of self-organizing perceptual systems (Hebb, 1949). Usually, "growth rules" have been modeled as biochemically mediated changes in synaptic efficacy which occur only when the correct temporal relationships occur. Networks of such elements may begin tabula rasa with randomized inputs, or with only loosely organized gradients of connectivity. They will eventually arive at a state of maximal sensitivity and resolution as a result of the interactio-n over time between the growth rules and the patterns of input from coherent signal sources.
Predictions of the Model
If the phase-locked information is extracted by spatial cross-correlation, we should hope to find anatomical or physiological evidence of its specialized machinery. Three such predictions are discussed here, two of which are in agreement with data we have obtained and one of which is presently being tested. Psychophysical Effects of Electrically Induced Temporal Dispersion. The classical relationship between stimulus current and pulse duration is the curve re-
I//,
Stim 1
Stim 2
I
+
Electrode ,
Fig. 7. Approximate orientation of intracochlear stimulating electrodes (small circles) with respect to the auditory nerve fibers of part of one turn of the cochlea (radial lines, as seen from above). Bold lines indicate equal numbers of neurons activated by each of two stimulus pulses: brief, high amplitude (Stim. 1) and long, low amplitude (Stim. 2). The temporal relationships among the stimuli and the activity of two neurons is indicated at right; the upper traces are from the nerve fiber located immediately over the electrode for which the stimuli are far suprathreshold, and the lower traces are from the nerve fiber at the fringe of excitation, which is near threshold. Note that the two stimuli would cause very different degrees of synchronicity of firing over the population of activated neurons
lating chronaxie and rheobase (Erlanger and Gasser, 1937). Within some range between those two points, changes in pulse duration can be compensated by reciprocal changes in pulse amplitude. However, a brief, high amplitude pulse and a long, low amplitude pulse are not equivalent in the precise timing of activation of all the nerve fibers for which they are above threshold, as illustrated in Fig. 7. When some significant length of the basilar membrane experiences suprathreshold stimulation, the more distantly located fibers will fire near the end of the stimulation pulse, whatever its duration. The more central fibers, for which the stimulus is far above threshold, will fire near the beginning of the pulse. While the effect is relatively slight (for pulse durations under 1 ms) and presumably imperceptible in other parts of the nervous system, we have here proposed synchronicity detectors exquisitely sensitive to such timing changes. From intracochlear electrical stimulation experiments in animals, we have found that the threshold for neuronal excitation (measured in the inferior colliculus) is a nearly constant charge per pulse for pulse durations over the range 0.1-lms (White, 1978). Similarly, psychophysical thresholds of auditory prosthesis patients indicate that nearly constant charge is
required over this pulse duration range. However, for moderate intensity stimuli, perceived loudness falls off rapidly as constant charge pulses are increased in duration over this range. There are also distinct but difficult to describe changes in the quality of the sound which are not the same as the changes associated with simply decreasing the amplitude of a constant duration pulse. Such findings are consistent with neural detectors strongly influenced by small changes in the synchronicity of their inputs. It may also be instructive that the pitch percepts reported by these patients, while place related, are rarely "tone-like" in quality. The spatial crosscorrelation model suggests that a considerable spatial extent of the basilar membrane can contribute to the perception of a given pitch. Conversely, a range of pitch sensations should be elicitable from a given region of basilar membrane once the stimulus is suprathreshold for the distance over which these detectors normally operate. This has serious implications for the design of auditory prostheses, which we are just beginning to explore (see Merzenich et al., 1979). Anatomical Correlates of Spatial Convergence. While the MSO is known to be tonotopically organized (Guinan et al., 1972), its organization has not been studied on a grain fine enough to detect predicted convergences from the proposed spatial sampling intervals. Histologically, the two dimensional "flameshaped" arborizations are at least compatible with the degree of convergence suggested by our model (Scheibel and Scheibel, 1974).Similarly, only the broad outlines of tonotopicity in the AVCN have been reported (Rose, 1960; see also review by Clopton et al., 1974). The tonotopicity of the major MSO input, the large spherical cell region of the cat AVCN, has recently been mapped in more detail (Merzenich and Scobey, unpublished results). Figure 8A shows an example of the best frequency of AVCN neurons encountered in succession along a typical microelectrode track following a dorsocaudal to ventrorostral course (best orientation for spanning the frequency map). While the frequency (shown as cochlear place) drops monotonically with depth, the changes are clearly discontinuous at intervals of roughly 100 km of depth. The frequency "steps" correspond to 0.5-1.0mm of basilar membrane position, with the larger steps occurring apically. Because of the apical decrease in basilar membrane conduction velocity, these steps actually correspond to a rather constant 120" to 150" phase shift for all phase-locked frequencies. Expressed from the perspective of the basilar membrane traveling wave, neurons across one "step" in the AVCN are adjacent to neurons that are receiving input from a location more basal by a distance of about 0.4 times
base
6t "g y
El-
-
-
10-
12-