Spatial-DiscLDA for Visual Recognition Zhenxing Niu1 1 VIPS Lab Xidian University
Gang Hua2 Xinbo Gao1 2 IBM T. J. Watson Research Center
[email protected] [email protected]
Qi Tian3 3 University of Texas at San Antonio
[email protected] [email protected]
Abstract
such as the SIFT features [12], namely visual words. Therefore, each image is considered to be a visual document composed of a bag of visual words [9], to which topic models such as pLSA [5], LDA [6], and corr-LDA [4] can be directly applied. Nevertheless, most of adopted topic models for visual recognition in the past, if not all, are unsupervised. During training, important object category labels are neglected, which is undesired. This is the reason that they usually adopt the topic models for visual representation [2], and pose another layer of discriminative classifiers for recognition, e.g., k-nearest neighbor classifiers or SVM classifiers. This treatment is less desirable because the two model training steps are performed in a separate fashion with different objectives, which may result in inferior results to a unified model. Feifei and Perona [6] proposed a Bayesian hierarchical model based on LDA with the category label as a hidden variable. Fritz and Schiele [7] use LDA to learn a compact and low dimensional representation for multiple visual categories from multiple view points in an unsupervised fashion. Nevertheless, the training of the model is still unsupervised. Another issue of naively applying topic models to a bag-of-words representation is that important spatial structure of the object is discarded. As already manifested by several previous work [9][8][22][24][25], spatial structure modeling can not only improve recognition in static images, but also enable object discovery and localization in video sequences. For describing visual scenes, Sudderth et al. [8] proposed a Transformed Dirichlet Process to model the expected spatial locations of objects, and the appearance of visual features corresponding to each object. To address the two issues discussed above, we extend a recent advancement of supervised topic models, namely the DiscLDA [21], to a part based visual representation for object category recognition. It explicitly introduces the discriminative category information in the generative topic model. In essence, it naturally defines multiple generative models pertaining to each specific visual category, which are all cast under a unified Bayesian model. Our proposed representation also simultaneously models statistics of the appearances and locations of the different
Topic models such as pLSA, LDA and their variants have been widely adopted for visual recognition. However, most of the adopted models, if not all, are unsupervised, which neglected the valuable supervised labels during model training. In this paper, we exploit recent advancement in supervised topic modeling, more particularly, the DiscLDA model for object recognition. We extend it to a part based visual representation to automatically identify and model different object parts. We call the proposed model as Spatial-DiscLDA (S-DiscLDA). It models the appearances and locations of the object parts simultaneously, which also takes the supervised labels into consideration. It can be directly used as a classifier to recognize the object. This is performed by an approximate inference algorithm based on Gibbs sampling and bridge sampling methods. We examine the performance of our model by comparing its performance with another supervised topic model on two scene category datasets, i.e., LabelMe and UIUC-sport dataset. We also compare our approach with other approaches which model spatial structures of visual features on the popular Caltech-4 dataset. The experimental results illustrate that it provides competitive performance.
1. Introduction Originated from statistical natural language processing, topic model has been widely adopted for solving visual recognition problems. The representatives of them are the probabilistic Latent Semantic Analysis (pLSA) of Hofmann [1], and the Latent Dirichlet Allocation (LDA) of Blei [3]. Both are generative models for modeling the statistical relationships among documents, topics and vocabularies. Specifically, each document can be factorized into a probability distribution of topics, each of which is represented with a probability distribution of words. Hence they are also related to nonnegative matrix factorization and dimensionality reduction algorithms. To employ topic models for image recognition, each image is represented by a set of quantized image features
1769
parts of the object, which are automatically learnt without any manual specification. Comparing with previous part based representation such as the constellation model [10] and k-fans model [11], which all strive for modeling the spatial relationships among different parts, our part based representation only models the spatial distribution of each of the parts, which largely avoids the combinatory explosion of the hypothesis space. We call our proposed model to be Spatial-DiscLDA (S-DiscLDA). In [9], another supervised topic model, namely sLDA has been examined for simultaneous image classification and annotation. It largely focuses on modeling the relationship between the class labels, e.g., scene categories such as “outdoor”, and image annotation, e.g., object categories such as “tree”, “flower”, and “sky”. So it is proper to model a scene, where there are several objects in a scene. However, the S-DiscLDA model explicitly exploits the probability distribution over vocabulary for different categories and hence may bear more capacity for object recognition then sLDA. Our S-DiscLDA can be directly used as a classifier for visual recognition, where inference is performed by an approximate inference algorithm based on Gibbs sampling and bridge sampling methods [20]. Our contributions are hence three folds: • We extended a recently developed supervised topical model, DiscLDA, to spatial modeling for solving visual recognition problems. • We presented an effective part based visual representation, which simultaneously model the statistics of the appearances and locations of different parts of a visual object. • Our model explicitly exploits the probability distribution over the vocabulary for different parts of different visual categories, and present more modeling capacity. The remainder of the paper is organized as the following: Section 2 illustrates the part-based visual representation based on the proposed S-DiscLDA model. The inference and learning algorithms are presented in Section 3. Detailed experimental results are summarized and discussed in Section 4. Finally, we conclude with remarks on future work in Section 5.
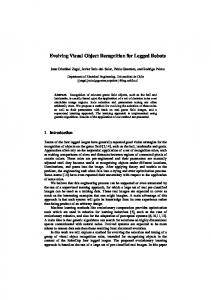
(a)
(b)
Fig.1 The spatial arrangement of (a) parts for an object and (b) elements for a scene. The appearances for different parts or elements are different.
and exploit the probability distribution of patch appearances for different parts. The idea behind our model is that we use latent variables, i.e., topics in S-DiscLDA model to characterize the object parts. The value of a latent variable for every image patch indicates which object part it comes from. By parameter estimation of our model, we can discover how the parts of an object are spatially arranged, and what the visual appearance is for each object part. As shown in Fig.1, for an object recognition task (Fig.1(a)), the motorbike contains several parts, i.e., wheel, seat, tail, etc. These parts present consistent spatial relationships, e.g., seat is usually at the top, wheel is usually at the bottom, etc. For scene recognition task, we can consider the visual scene as an “object” in a general sense, and consider the different visual elements of the scene image as the “part”. Take “coast” scene image as an example (Fig.1(b)), it contains several “parts”, such as sky, beach, sea, etc. Regarding the spatial arrangement of parts, sky is usually on the top, and sea is usually at the bottom; regards the appearances of parts, the color of sea is usually blue, and the color of beach is usually white. For each part, it consists of image patches with different visual appearances, which are described by the local α
π
α
π
θd
θd yd
T
2. Image representation for S-DiscLDA Model
K1
zdn
zdn
β
It is common observation that an object is usually comprised of parts at different spatial locations. The appearances of the different parts are usually different. So an object can be naturally characterized by a set of parts with a certain spatial arrangement, while each part can also be represented by visual appearances of the corresponding set of image patches. Our model is intended to find where these parts are statistically located for an object category,
yd
T
β
udn
φk
Nd
wdn
K1
udn
φk
wdn Nd
ldn
R
D
D
(a)
(b)
Fig.2. The graphical model of (a) DiscLDA and (b) the proposed S-DiscLDA model. In S-DiscLDA, the location of image patch is modeled with variable ldn and parameter set R .
1770
Table 1. The notations of variables and parameters in S-DiscLDA, similar to those in [21] variable/parameters notations The dn-th patch in image I d pdn ,(dn = 1, 2,..., N d ) yd ∈ {1, 2,..., C}
π
detailed mathematics of the proposed S-DiscLDA model. The notations of the variables and parameters in the model are presented in Table 1. The generative process of an image with our model can be described in Table 2. For ease of presentation, we employ the notations similar to those in [21]. There are C kinds of objects to be recognized, and it is assumed that each object consists of K 0 parts. Each image I d is divided into N d image patches
The supervised label of I d The parameter of the prior distribution of yd
α,β θ d : θ d Dir (α )
The parameters of Dirichlet distribution. The instance of Dirichlet distribution for I d , which is also the parameter of
denoted as pdn , (dn = 1, 2,..., N d ) . Each patch is described by its appearance and location. Each patch’s appearance is represented by its corresponding visual word wdn ∈ {vwi }Vi =1 ,
multinomial distribution of zdn . zdn ∈ {1, 2,..., K 0 + 1}
The latent topic of
where zdn Multi (θ d )
considering yd , which obeys multinomial distribution. The latent topic of pdn
udn ∈ {1, 2,..., K1 + 1} and udn Multi (T yd θ d )
considering yd , which multinomial distribution.
:{T c }Cc=1
The mapping matrices between zdn
where ( K1 = CK 0 ),
V i i =1
wdn ∈ {vw }
where wdn Multi (φk ) Φ :{φk }kK=1 1+1 where φk Dir ( β ) ldn = ( xdn , ydn )
R: {µ k ,σ k }kK=1 1
where {vwi }Vi =1 is the codebook which is obtained by running the k-means algorithm on local features extracted from patches sampled from all images. The location of the patch is represented by its image coordinates ldn = ( xdn , ydn ) .
pdn without
obeys
We use latent variables, i.e., topic zdn and udn in S-DiscLDA to characterize the object parts. Specifically, topic zdn for the patch pdn indicates which object part it comes from without considering the object category. Since every image patch must come from either background or part of an object, so the latent topic zdn is used to indicate
and udn for image category yd = c . The visual word of pdn , which obeys multinomial distribution. The instance of Dirichlet distribution for udn = k , which is also the parameter of multinomial distribution of wdn .
where pdn comes from. More specifically, if pdn comes from the m-th part of object (no matter which category of the object belongs to), we have = zdn m= , (m 1, 2,..., K 0 ) , and if it comes from background, we have z= K0 + 1 . dn So zdn takes a number of ( K 0 + 1) values, and it has no relationship with object category. To discriminatively model different parts of different objects, we introduce another latent topic udn . Specifically,
The location of pdn , which obeys distribution as equation (2). The parameter of Gaussian distribution of ldn for udn = k .
Table.2. The generative process of an image. 1.Draw topic proportions θ d Dir (α ) ;
if pdn comes from the m-th part of the c-th object category, we have udn = (c − 1) ⋅ K 0 + m , and if it comes from
2.For each patch pdn , choose its topic zdn drawn from the
background, we have udn = K1 + 1 , where K1= C ⋅ K 0 . So udn has a number of ( K1 + 1) values, which directly relates to the object categories. The relationship between topic zdn and topic udn can be
multinomial distribution, zdn Multi (θ d ) ; 3. For each patch pdn , choose its topic udn = T yd zdn based on the image category yd ∈ {1, 2,..., C} . It indicates that topic udn drawn from the multinomial distribution, udn | θ d , yd , T yd Multi (T yd θ d ) ;
described by mapping matrices :{T c }Cc=1 , which maps the object parts for any object category to the corresponding object parts for a specific object category yd = c ,
4.For each patch pdn , dn ∈ {1, 2,..., N d } : a) Draw its visual word wdn Multi (φk ) for udn = k ;
i.e., T c : zdn → udn . T c is a (CK 0 + 1) × ( K 0 + 1) matrix.
b) Draw its location ldn = ( xdn , ydn ) from prob(ldn | udn , R )
Take C = 2 as an example, T c , (c = 1, 2) is as features of the patches. SIFT [12] is a local descriptor for I K0 0 0 K0 0 image matching, in which it extracts a visual descriptor from 1 2 each image patch surrounding a scale invariant keypoint for (1) 0 K0 0 ,T T = = I K0 0 matching, which has been widely used for visual 0 1 0 1 (2 K0 +1)×( K0 +1) (2 K0 +1)×( K0 +1) recognition problems [6][24][25][26]. The S-DiscLDA model can be illustrated by a graphical where I K0 is a K 0 dimension identity matrix. model as shown in Fig.2(b). We proceed to present the
1771
For example, if the patch pdn comes from the m-th part, i.e., the value of its topic zdn is m , and the object belongs to
Algorithm1: The training of S-DiscLDA Input: Image data with class labels Α ={( yd , wd , ld )}dD=1 Output: The estimated parameters of the S-DiscLDA {Φ L , R L } .
category yd = c , then the value of its topic udn is (c − 1) K 0 + m . This also applies to the appearance and location of image patches from background for all object categories except that it is an one-to-one mapping because zdn = K 0 + 1 → udn = CK 0 + 1 .
Initialization: Initializing the R 0{µ k0 ,σ k0 } manually. Training: For i = 1, 2,..., L 1. Sample from the posterior distribution. Given R i −1 , Sample N RB Gibbs steps for each image I d
In our model, the wdn is drawn from a distribution over the codebook, which is a multinomial distribution with parameters Φ :{φk }kK=1 1+1 . The parameter φk describes what the appearance looks like for background ( = k K1 + 1 ) or
from p ( zd , ud | wd , ld , yd , , R i −1 ) with Eq.(4) 2. Estimate Φ i and R i a) Estimate Φ i with last sample u( N ) with Eq.(5) b) For each I d , estimate p (udn | wd , ld , yd , , R i −1 ) with N
for object parts ( k = 1, 2,..., K1 ). The ldn is drawn from a distribution prob(ldn | udn , R) , which depends on its topic udn . The location distribution of
samples ud ( t ) ,(t = 1, 2,..., N ) , and Estimate R i with Eq.(6)
the distribution p ( zd , ud | wd , ld , yd , , R ) . To sample from it, we need to compute p= ( zdn h= , udn k | z− dn , u− dn , wd , ld , yd , , R ) ∝
patches from background ( = k K1 + 1 ) is modeled by a uniform distribution, and the location distribution of patches from an object part ( k = 1, 2,..., K1 ) is modeled by a
( β wdn h + m−( wdndn, h) )
Gaussian model with parameter set R: {µ k , σ k }kK=1 1 , i.e.,
(β()h + m
() − dn , h
N ( µ k , σ k ) , k = 1, 2,..., K1 , R) prob(ldn |= udn k= k K1 + 1 (2) = Uniform , The position and scale of each object part can be described by the Gaussian parameter R: {µ k , σ k }kK=1 1 . With parameter estimation algorithm (cf. Section 3.1), we can discover where the parts are spatially arranged for an object.
)
Thky (α k + n− dn , k ) p (ldn | udn , R)
(4)
where m−( wdndn, h) is the number of patches with wdn and
zdn = h in image I d except for pdn , and n− dn , k is the number of patches with udn = k in image I d except for pdn . Here we omit certain details of the derivation due to the space. The reader may refer to the Appendix 6.1 for details. Given the samples from the posterior distribution, we can estimate parameter set {Φ, R} . Since the posterior is
3. Learning and inference algorithms
p (φ= Dir ({β vk + mk( v ) }Vv =1 ) k | u, w )
3.1. Parameter learning
D d =1
where u = {ud }
Given a corpus of image data with class labels Α ={( yd , wd , ld )}dD=1 , we find the maximum likelihood estimation for the distribution of visual word for each topic, i.e., Φ ; and the distribution of location for each topic, i.e., R . {Φ* , R* } arg max ∏ P( yd , wd , ld | , Φ, R ) (3) = Φ,R d We proposed an iterative learning algorithm using EM for parameter estimation of S-DsicLDA, as summarized in Algorithm-1. Specifically, given R i −1 , the posterior distribution over the assignments of words to topics for each image I d , i.e., P( zd , ud | wd , ld , yd , , R i −1 ) is evaluated
D d =1
, w = {wd }
(v) k
and m
(5)
is the number of
patches with wdn = v and udn = k in all images {I d }dD=1 . So the Φ ={φk }k =1 1 can be estimated as the posterior mean K +1
of p (φk | u, w ) , which is simply the normalized Dirichlet parameters. The spatial arrangement and the scale of different object parts are characterized by the mean values and variance of a Gaussian distribution, respectively. These form the parameter set R: {µ k , σ k }kK=1 1 . With the samples generated
from the posterior distribution p ( zd , ud | wd , ld , yd ) , we evaluate the probability p (ud | wd , ld , yd ) by marginalizing out
firstly; then the Φ i and R i are estimated by examining this posterior distribution. After some iterative steps, the two parameter set will converge to {Φ* , R* } . We use the Rao-Blackwellized version of Gibbs sampling method (RB Gibbs sampling) [19] to sample from
the
topic
variable
ωdn (k ) p (udn = k | wd , ld , yd )
zd
.
The
probability
indicates how likely the
patch that comes from the object part k . In the learning algorithm, we take the weighted means and weighted variances as the robust estimation of the locations and scales, i.e.,
1772
D Nd ( ) k µ ϖ = ⋅ ∑ ∑ ωdn (k )ldn k d 1= dn 1 = , k = 1,..., K1 D Nd 2 σ 2 = ϖ (k ) ⋅ ∑ ∑ ωdn (k )(ldn − µk ) (6) k d 1= dn 1 =
Algorithm2: The inference of S-DiscLDA Input: The visual words and corresponding locations for the new image ( wd , ld ) Output: The posterior probability P ( yd | wd , ld , , Φ, R )
Nd
D
1. Sample zd( i ) c , i = 1, 2,..., M from p ( zd | yc , wd , ld , , Φ, R ) with Eq.(10). 2. Compute the ratio Z c / Z1 , c = 2,3,.., C with Eq.(9).
where ϖ (k ) = 1 / ∑ ∑ ωdn (k ) d 1= dn 1 =
3. Estimate the P ( yd | wd , ld , , Φ, R ) with Eq.(8).
3.2. Approximate Inference To recognize an object in a new image, we first divide the new image into patches just as the training process, and extract the local features for each patch. For each patch pdn ,
4. Experiments We evaluate our method with two experiments using three datasets, i.e., the LabelMe dataset [11], the UIUC-Sport dataset [11], and the Caltech-4 dataset [16], followed by detailed discussions. The LabelMe dataset in [11] is obtained by an on-line tool with the following 8 scene categories, namely “highway”, “inside city”, “tall building”, “street”, “forest”, “coast”, “mountain”, and “open country”. The UIUC-Sport dataset has 8 scene categories, i.e., “badminton”, “bocce”, “croquet”, “polo”, “rockclimbing”, “rowing”, “sailing”, and “snowboarding”. The Caltech-4 dataset has 5 categories, i.e., “face”, “motorbike”, “airplane”, “car” and “background”.
we get its corresponding image coordinate ldn , and quantify its local feature into visual words wdn with the codebook we obtained in the training process. With the known model parameters {, Φ, R} in the training process, we can predict the image’s label yˆ d by maximum a posteriori estimation,
= yˆ d arg max ( P( yd | wd , ld , , Φ, R) ) .
(7)
yd ∈{1,2,..., C }
We propose an approximate inference algorithm to predict the label yˆ d , as shown in Algorithm-2. By employing the notations as in [22], we define a function as qc ( zd ) p ( wd , ld | zd ,= yd c, , Φ, R) p ( zd ) , and we denote
4.1. Object recognition
its normalization constant as Z c ∫ qc ( zd )dzd . It is obvious
In the first experiment on Caltech-4, we compare our method with other object recognition methods which also conduct spatial modeling over either a set of object parts [10], or a set of local features. The constellation model [10] attempts to represent an object by a set of parts under mutual geometric constraints, which simultaneously learns shape, appearance and relative scale represented by Gaussian densities using EM. It is an unsupervised model with high computation cost, which neglects the valuable labels during training. In [16], the authors model the spatial relationship between visual words by extracting higher-order spatial features. It focuses on how to select lower order features and how to build higher order features. The authors use spatial histogram with distance approximately in log scale to build second order feature, and illustrate that the algorithm can avoid exhaustive computation. However, the spatial histogram is relatively coarse, and it cannot explicitly indicate the spatial arrangement of object parts. We extract SIFT descriptors from densely sampled image patches for the S-DiscLDA model for this recognition task. Our S-DiscLDA uses the latent variables to discover the spatial arrangement of object parts, and it is a supervised model by exploiting the object category information. It can model the spatial relationship of all image patches, while the
that we have the relationship between the posterior probability P( yd | wd , ld , , Φ, R ) and Z c as
p ( yd = c | wd , ld , , Φ, R ) = p ( yd =1| wd , ld , , Φ, R )
p ( yd = c ) Z c , c 2,3,..., C (8) = p ( yd =1) Z1
To estimate the posterior P( yd | wd , ld , , Φ, R ) , we need to estimate the ratio Z c / Z1 , c = 2,3,..., C . As an extension of importance sampling to estimate the ratio between two normalization factors, we leverage bridge sampling [19] to estimate it. Define ∆ wyddn , zdn ,ldn p ( wdn , ldn | zdn , yd , , Φ, R ) , we have
Zc ≈ Z1 where hab =
∑ ∑
M
h ( zd(i )1 )
i =1 c1 M
h ( zd(i ) c ) i =1 1c
∆ wyddn=,azdn ,ldn
∏∆ dn
yd = b wdn , zdn , ldn
(9) ,c = 2,3,..., C
. The reader may refer to the
Appendix 6.2 for detailed derivation. To sample from qc ( zd ) , we need to compute
= p ( zdn h | z− dn , wd , ld , yd , , Φ, R )
yd ∝ (α h + n− dn , h )Φ wh k , R) ∑ Tkhyd p(ldn | udn =
(10)
k
Again, detailed derivation is available in Appendix 6.3.
1773
higher-order spatial features [16] can only model the relative relationships among several image patches. For comparison, we followed the same experimental setting as those adopted in [16] and [12]. The data of each category was randomly splitted into two subsets of equal size. The model was then trained on the first subset and tested on the second subset. For the S-DiscLDA model, β and α are set to 0.01 and 50 / K 0 respectively,
Table 3. Comparison to method [12] and method [16]. The table gives ROC equal error rate (EER) on the Caltech-4 dataset. Class Method [12] Method [16] Our method Face 3.6% 0.92% 0.5% Motorbike 7.5% 1.0% 0.9% Airplane 9.8% 1.75% 1.0% Car 11.5% 0.9% 0.5%
protocol adopted in [11], and performed the scene classification experiment on the LabelMe dataset and UIUC-Sport dataset. Similar to [11], we use the SIFT region descriptors extracted from a sliding grid ( 5 × 5 ). We report results on a codebook of 800 codewords (larger codebook sizes gave similar performance). For the S-DiscLDA model, we set K 0 = 15 , and C = 8 for this task, other parameters are similar to the setting in the previous section. This task is a multi-class classification problem. The results are illustrated in the confusion matrix of Fig. 3, where Fig. 3(a) and Fig. 3(c) are the classification results from the sLDA method quoted from [11] on LabelMe and UIUC-Sport dataset respectively. And Fig. 3(b) and Fig. 3(d) presented the results of S-DiscLDA on corresponding datasets respectively. On LabelMe dataset, S-DiscLDA can reduce the error of sLDA [11] by at least 4% and achieve better results in 7 out of the 8 scene categories. On UIUC-Sport dataset, our models can reduce the error of sLDA [11] by at least 3% and also achieve better results in 7 out of the 8 scene categories.
Τ :{T y }Cy=1 is set according to Equation (1), where C = 2 for this task and we set K 0 = 15 . These parameter settings will be further discussed in more detail in Section 4.3. Similar to [12] and [16], we use ROC equal error rate (EER) to evaluate the classification performance, as shown in Table. 3. The experimental results demonstrate that the proposed model significantly outperforms the method [12], and also outperforms the method [16], except for the car category, where we obtain only slightly worse result. The slightly inferior result in the car category may be attributed to the large variation of the car size, which presents large spatial variation among the different parts.
4.2. Scene classification Our model can also be used for scene classification. The scene image can be regarded as containing scene elements in different spatial locations, and the spatial arrangement of these elements is usually relatively consistent for images from same scene category and is diverse for images from different scene categories. In [11], Wang et al. exploited a supervised topic mode, i.e., the sLDA for scene image classification. It focuses on modeling the relationships between the scene categories and image annotations. The image annotation in [11] is similar to the concept of scene element or part in S-DiscLDA. However, it does not explicitly exploit the spatial relationship of the different image annotations. Our S-DiscLDA model is also a supervised model which models the appearance and location of image patches simultaneously. To compare with this sLDA based scene classification method, we followed the same experimental 77 01 tallb. 01 street 05 forest 00 coast 10 mount. 03 openc. 07 highw. insid.
02 75 06 17 00 00 00 00
01 04 84 04 00 00 01 01
04 17 04 71 00 00 01 01
00 00 01 00 92 01 02 08
05 01 00 00 00 71 00 12
04 00 03 01 04 01 83 10
07 02 01 02 04 17 10 61
80 00 00 00
00 89 10 09
00 00 86 00
02 03 01 74
00 03 00 09
08 00 00 00
03 03 02 07
07 02 01 01
00 coast 06 mount. 03 openc. 01
01 00 01 02
00 00 03 00
01 00 00 03
93 01 07 02
00 73 01 14
05 06 77 12
00 14 08 66
highw. insid. tallb. street forest
4.3. Discussion on S-DiscLDA The original DiscLDA model can also be directly employed for object recognition. More specifically, we utilize the DiscLDA as a classifier, and use the bag of visual words as the visual representation for an image, and use the object category label as the class label. Given a corpus of image data with class labels, B = {( yd , wd )}dD=1 , we train the DiscLDA with the learning algorithm proposed in [21] and obtain the model parameter set {Φ} . For a test image, we badmi. bocce croquet polo rockc rowing sailing snowb.
82 07 02 10 00 03 03 02
02 26 08 03 02 02 00 05
09 43 70 22 01 10 11 07
03 05 08 51 03 07 03 05
00 04 02 01 85 01 01 12
01 03 04 06 01 71 07 04
02 03 04 02 01 03 66 05
01 08 02 05 07 03 09 60
badmi. bocce croquet polo rockc rowing sailing snowb.
85 09 02 09 01 01 00 05
01 30 05 03 00 00 02 02
09 46 79 25 04 09 09 11
00 00 00 50 00 07 03 01
02 04 02 06 87 01 02 10
02 08 06 06 04 74 09 05
00 01 04 00 00 03 71 02
01 02 02 01 04 05 04 64
b. ow sn g n ili sa g in w ro c ck ro lo po t ue oq cr e cc bo . i dm
b. ow sn g n ili sa g in w ro c ck ro lo po t ue oq cr e cc bo . i dm
c. en op t. n ou m t as co st re fo t ee str . llb ta . sid . w in
gh
ba
ba
hi
c. en op . nt ou m t as co st re fo t ee str . llb ta . sid in . w gh
hi
(a) sLDA [11]. LabelMe: (b) S-DiscLDA. LabelMe: (c) sLDA [11]. UIUC-Sport: (d) S-DiscLDA. UIUC-Sport: avg. accuracy: 76%. avg. accuracy: 80% avg. accuracy: 65% avg. accuracy: 68% Fig 3. Comparison with method [11] using confusion matrices. The rows denote true label and the columns denote the estimated label. All the numbers stand for percentage (%).
1774
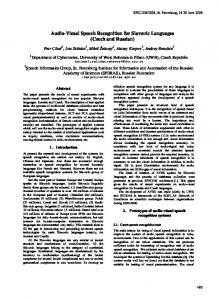
The parameter β and α of Dirichlet distribution are the hyper parameters of both DiscLDA and S-DiscLDA. They can be interpreted as the virtual samples contributing to the smoothing of φk and θ respectively, which are set according to the setting in [19]. For the computational cost of S-DiscLDA, since the appearances and locations for different parts are modeled with conditional independent latent variables, S-DiscLDA is very efficient to model a large number of object parts. So it can be used for objects with many parts and complex structure. (a)
5. Conclusions
(b)
Fig.4 (a) The performance comparison of object recognition between DiscLDA and S-DiscLDA on face dataset in Caltech-4. (b) Some samples that can be correctly recognized with S-DiscLDA but incorrectly recognized with DiscLDA.
In this paper, we propose a novel model S-DiscLDA for visual recognition. Our model aims to bridge the gap between bag of words model and visual modeling by taking spatial structure modeling into consideration. By considering the spatial relationships among local image features, we extend a recent supervised topic model, the DiscLDA to spatial modeling. Our model captures the appearance and location of the different object parts simultaneously, and leverages the supervised label information to facilitate automatic learning of different parts. Our experiments on both object recognition and scene recognition demonstrated the effectiveness of the proposed model. As we have noticed, there are some prior constraints on the spatial relationships of object parts. In our future work, we plan to further explore to augment the proposed model with this kind of prior knowledge, and hence improve the richness of the proposed model in knowledge representation.
get its visual words as the feature and predict the image label with the trained DiscLDA. In this way, the latent topic variables zd and ud have no spatial meaning, and the image patch location ld is not modeled. In this experiment, we provide a comparison between DiscLDA and S-DiscLDA model in object recognition. It can evaluate how much the spatial information improves the performance of object recognition. As shown in Fig.4(a), we use the face dataset in Caltech-4 to illustrate the performance difference. The experiments on the other three categories have similar results. In this experiment, we also explore the different configuration of K share for DiscLDA. The performance is evaluated by the error rate, FP + FN . From Fig.4(a), we can clearly i.e., Error = Total observe that the classification error of both models will decrease with the increase of K 0 . This is because the
6. Acknowledgement This research was supported by the Ph.D. Programs Foundation of Ministry of Education of China under Grant 20090203110002, and the Research Projector Funding of Microsoft Research Asia. This work was supported in part to Dr. Qi Tian by NSF IIS 1052851, Google Faculty Research Award and FXPAL Research Award, respectively
dimension of parameters Φ :{φk }kK=1 1+1 and R: {µ k , σ k }kK=1 1 depends on K 0 . Hence the appearance and location of object parts can be characterized more precisely with large K 0 than that with small K 0 . However, the classification error of S-DsicLDA will decrease faster than that of DiscLDA. So spatial modeling in S-DiscLDA can significantly improve its capacity for object recognition. From Fig.4(a), we can also observe that the performance only improves slightly after the number of parts increased beyond 15, i.e., after K 0 > 15 . So in our experiments
7. Appendix 7.1. The derivation of Equation (4) It is obvious that we have p ( zdn , udn | z− dn , u− dn , wd , ld , yd , , R )
. (11) p ( zd , ud , wd , ld | yd , , R ) p ( z− dn , u− dn , w− dn , l− dn | yd , , R ) Based on S-DiscLDA, the joint probability can be factorized as p ( zd , ud , wd , ld | α , β , yd , , R ) . (12) = p ( zd | α ) p (ud | zd , yd , ) p ( wd | ud , β ) p (ld | ud , R ) The distributions of image patch locations are assumed =
presented in Section 4.1 and 4.2, we set K 0 = 15 . Fig. 4(b) shows some samples that can be correctly recognized with S-DiscLDA but incorrectly recognized with DiscLDA. In these images, the background is cluttered, and it contains many patches with various appearances. So it is difficult to recognize the face without modeling the spatial structure.
1775
allocation. JMLR, 2003. [4] D. M. Blei and M. I. Jordan. Modeling annotated data. In dn SIGIR, 2003. Combining these equations together we get Equation (4). [5] A. Bosch, A. Zisserman, and X. Munoz. Scene classification via pLSA. In ECCV, 2006. 7.2. The derivation of Equation (9) [6] L. Fei-Fei and P. Perona. A bayesian hierarchical model for With the definition of the normalization learning natural scene categories. In CVPR, 2005. constant Z c ∫ qc ( zd )dzd , we have [7] M. Fritz, and B. Schiele. Decomposition, discovery and detection of visual categories using topic models. In CVPR, M qb ( i )1 2008. ( z ) ∑ d i =1 Zc q1 [8] E. Sudderth, A. Torralba, W. Freeman, and A. Willsky. (14) ≈ ,c = 2,3,..., C M qb Z1 (i )c Describing visual scenes using transformed dirichlet ∑ i =1 q ( zd ) processes. In NIPS, 2005. c [9] S. Lazebnik, C. Schmid, and J. Ponce. Beyond bags of where zd( i ) c , i = 1, 2,..., M are M independent distribution samples features: spatial pyramid matching for recognizing natural from the distribution qc ( zd ) , and the qb ( zd ) is the bridge scene categories. In CVPR, 2006. [10] L. Cao and L. Fei-Fei. Spatially coherent latent topic model distribution. In our algorithm, we use a geometric bridge [20], i.e., for concurrent object segmentation and classification. In qb ( zd ) = q1 ( zd )qc ( zd ) . ICCV, 2007. The joint distribution p ( zd , ud , wd , ld | α , β , yd , , R ) can be [11] C. Wang, D. Blei and L. Fei-Fei. Simultaneous image factorized as shown Equation (12). By marginalizing out variable classification and annotation. In CVPR, 2009. [12] R. Fergus, P. Perona, and A. Zisserman. Object class ud , we have recognition by unsupervised scale-invariant learning. In ∆ wyddn , zdn ,ldn p ( wdn , ldn | zdn , yd , , Φ, R ) CVPR, 2003. (15) = k | zdn , yd , ) p ( wdn | udn = k , Φ ) p (ldn | udn = k , R) [13] D. J. Crandall, P. F. Felzenszwalb, and D. P. Huttenlocher. ∑k p(udn = Spatial priors for part-based recognition using statistical Given zd , the wd and ld are conditional independence, we have models. In CVPR, 2005. [14] D. Lowe. Object recognition from local scale-invariant qc ( zd ) p ( zd ) p ( wd , ld | zd , yd , , Φ, R ) features. In ICCV, 1999. (16) yd = p ( zd )∏ ∆ wdn , zdn ,ldn [15] Z. Lin, G. Hua, and L. Davis, Multiple instance feature for dn robust part-based object detection. In CVPR, 2009. Using geometric bridge qb ( zd ) = q1 ( zd )qc ( zd ) , we have [16] D. Liu, G. Hua, P. A. Viola, and T. Chen, Integrated feature selection and higher-order spatial feature extraction for M qc ( i )1 M qb ( i )1 object categorization. In CVPR, 2008. ( z ) ( z ) ∑ d ∑ d i =1 i =1 q1 Zc q1 [17] E. Nowak, F. Jurie, and B. Triggs, Sampling strategies for (17) ≈ = M q Z1 bag-of-features image classification. In ECCV, 2006. ∑ i =1 qb ( zd(i )c ) ∑ iM=1 q1 ( zd(i )c ) [18] D. M. Blei and J. D. McAuliffe. Supervised topic models. In qc c NIPS, 2007. Combining Equation (16) and (17), we have Equation (9). [19] T. L. Griffiths and M. Steyvers. Finding scientific topics. In 7.3. The derivation of Equation (10) PNAS, 2004. [20] X. L. Meng, and W. H. Wong. Simulating ratios of It is obvious that we have normalizing constants via a simple identity: a theoretical p ( zdn | z− dn , wd , ld , yd , , Φ, R ) exploration. Statist. Sinica, 1996. (18) p ( zd , wd , ld | yd , , Φ, R ) [21] S. L. Julien, F. Sha, and M. I. Jordan. DiscLDA: = Discriminative learning for dimensionality reduction and p ( z− dn , w− dn , l− dn | yd , , Φ, R ) classification. In NIPS, 2008. Expand Equation (12), we have [22] S. L. Julien. Discriminative machine learning with structure. p ( zd , wd , ld | yd , , Φ, R ) PhD Thesis, University of California, Berkeley, 2009. = p ( zd ) Φ wyddn zdn p (udn = k | zdn , yd , ) p (ldn | udn = k , R ) [23] D. Liu and T. Chen. A topic-motion model for unsupervised video object discovery. In ICCV, 2007. dn dn k [24] W. Zhou, Y. Lu, H. Li, Y. Song, and Q. Tian. Spatial coding (19) for large scale partial-duplicate web image search. In ACM Combining Equation (18) and (19), we have Equation (10). Multimedia, 2010. [25] S. Zhang, Q. Tian, G. Hua, Q. Huang, and S. Li. Descriptive 8. References visual words and visual phrases for image applications. In ACM Multimedia, 2009. [1] T. Hofmann. Probabilistic latent semantic indexing. In [26] J. Wang, J. Yang, K. Yu, F. Lv, T. Huang, and Y. Gong. SIGIR, 1999. Locality-constrained linear coding for image classification. [2] T. Hofmann. Unsupervised learning by probabilistic latent In CVPR, 2010. semantic analysis. Machine Learning, 2001. [3] D. M. Blei, A. Ng, and M. I. Jordan. Latent dirichlet independent to each other in S-DiscLDA, so we have p (ld | ud , R ) = ∏ p (ldn | udn , R )
∏
(13)
∏∑
1776