This study was supported by a CEC. MAST programme (JEEP 92 contract 0024-C) and by an .... Shuman F.R., C.J, Lorenzen (1975). Quantitative degradation of.
OCEANOLOGICA ACTA - VOL. 20 - N° 3
~
----k::!d Spatial distribution and dynamics of microphytobenthos biomass in the Gironde estuary (France)
Microphytobenthos Chlorophy Il-a Seasonal variations Spatial distribution Gironde estuary Microphytobenthos Chlorophylle-a Variations saisonnières Distribution spatiale Estuaire de la Gironde
Paulo J.P. SANTOS*, Jacques CASTEL and Lilia P. SOUZA-SANTOS* Laboratoire d'Océanographie Biologique - URA CNRS 197 - Université Bordeaux-I, 2 rue du Professeur Jolyet, F 33120 Arcachon, France. * Present address: Depto de Zoologia - CCB - UFPE - CEP 50670-901 Recife, PE - Brazil. Rcceived 20/10/95, in rcvised form 31/05/96, acccpted 07/06/96.
ABSTRACT
The spatial variation of microphytobenthos was investigated with reference to both the estuarine gradient and the intertidallevels of the Gironde estuary, France. Four transccts, each with three stations, were surveyed in two different seasons (April and October) during two consecutive years. In addition, the seasonality of microphytobenthic pigment concentration and its relationship to environmental factors were examined by means of weekly sampling at an intertidal mudflat located in the oligo-mesohaline arca. Generally, microphytobenthic pigments increased both with increasing salinity and tidal height. Clear seasonal variations were found for microphytobenthic chlorophyll-a concentration. Multivariate analysis showed environmental factors such as temperature, insolation, salinity and sand content of sediment to be most determinant in explaining these variations, with different sets of factors controlling the variables at each station. The principal explanatory factors with regard to chlorophyll-a concentration at both stations were variables known to be related to primary production, such as temperature (52%) at the lower intertidal station, and insolation (9%) and salinity (29%) at the higher intertidal station. The restricted primary production in the water column, due to the high turbidity of the Gironde estuarine water and the proportional arca covered by intertidal areas, underlines the importance of the microphytobenthic biomass, and probably production, for the estuarine ecos ystem.
RÉSUMÉ
Distribution spatiale et dynamique de la biomasse du microphytobenthos dans 1'estuaire de la Gironde (France). La distribution spatiale du microphytobenthos a été étudiée le long du gradient de salinité et à différents niveaux de l'estran dans l'estuaire de la Gironde. Quatre transects de trois stations ont été échantillonnés au printemps et en automne pendant deux années consécutives. De plus, les variations saisonnières de la concentration en pigments microphytobenthiques et leurs relations avec les facteurs environnementaux ont été examinées dans la zone oligo-mésohaline. Dans ce but, des échantillonnages hebdomadaires ont été réalisés pendant une année dans deux stations situées au niveau de basse mer et au niveau de mi-marée respectivement. Des différences majeures ont été observées aussi bien le long de l'estuaire qu'entre les stations intertidales. Les pigments microphytobenthiques présentent une augmentation avec la salinité et la hauteur sur l'estran. Des variations saisonnières ont été clairement observées pour la concentration en
549
P. J. P. SANTOS et al.
chlorophylle-a du sédiment. Une analyse multivariée a montré que des facteurs comme la température, l'insolation, la salinité et le contenu en sable du sédiment sont les plus importants pour expliquer ces variations, avec différents ensembles de variables explicatives pour chaque station. Les variables qui expliquent le mieux la variation de chlorophylle-a sont celles qui sont normalement liées à la production primaire, comme la température (52%) au niveau de basse mer, et la salinité (29 %) et l'insolation (9 %) au niveau de mi-marée. La forte réduction de la production primaire dans la colonne d'eau, due à de fortes turbidités dans l'estuaire de la Gironde, renforce l'importance du microphytobenthos associé aux zones intertidales pour le système estuarien. Oceanologica Acta, 1997, 20, 3, 549-556.
discharge varies seasonally, usually reaching a maximum in January-February (mean 1,500 m3.ç1) and a minimum in August-September (mean 250 m 3 _ç 1).
INTRODUCTION The importance of microphytobenthic primary production has been recognized since Pomeroy' s ( 1959) study, and the important role played by microphytobenthic algae in estuarine production (Colijn, 1983; de Jonge, 1995), estuarine biomass (de Jonge and Colijn, 1994), sediment chemistry (Wiltshire, 1992), sediment stability (Underwood and Paterson, 1993) and estuarine fluxes (de Jonge and van Beusekom, 1995) has been recently acknowledged. For French estuaries, however, data concerning microphytobenthic biomass (Riaux-Gobin, 1985) are scarce and fragmentary.
Sampling For the spatial study, four transects (A, B, C and D) were established downstream along the Gironde estuary, at 35, 55, 75 and 90 km distance from the city of Bordeaux (Fig. 1). At each transect, three intertidal stations were located on the mudflat, at the lower (station L), mean (station M) and upper (station H) levels respectively. Ali stations were surveyed twice (in April and October) during the years 1991 and 1992 for microphytobenthic pigment concentration measurements. During the 1992 surveys, samples were also obtained for the determination of the sand content of the sediment.
Although 1ow and ftuctuating salinities result in a rapid1y changing environment, estuaries are among the most productive non-cultivated ecosystems (Colijn and de Jonge, 1984). One of the main features of the Gironde estuary is the high turbidity of the water, with suspended particulate matter (SPM) concentrations that may exceed 1 g.l- 1 in the turbidity maximum. Due to this high turbidity, phytoplankton blooms are restricted to areas and periods of low SPM concentrations, generally occurring during summer only in the lower estuary (Irigoien and Castel, in press). Particulate organic carbon (POC) and bacteria numbers also show low values (l-1.5% of SPM and 105 cells.ml- 1 respectively) in the oligo-mesohaline area (Fontugne and J ouanne au, 1987; Prieur et al., 1987) and easily degradable carbon accounts for only a small fraction (10-15%) of POC (D. Burdloff and H. Etcheber, pers. comm.), indicating that SPM is of poor nutritiona1 value. This suggests that the dominant trophic resource should be benthic production in the turbidity maximum (oligomesohaline area).
For the temporal study, between April 1992 and April1993 two stations (Land H) of transect B were surveyed weekly, during low water, resulting in 47 sampling data points. Water salinity was •measured with a band refractometer, and sediment temperature with an electronic thermometer at 3 cm depth. Published data from a nearby area (10 km) were used for insolation expressed as number of sunny hours during the week prior to sampling (Bulletin Climatologique de la Gironde); for tide coefficient, we used a specifie French unit showing a logarithmic relationship with tidal amplitude (Annuaire des marées. Port Autonome de Bordeaux). Cores (inner diameter 2.8 cm) were taken at each station to a depth of 1 cm for microphytobenthic pigments and particulate organic carbon (three replicates), and sand content of sediment (two replicates). Magnesium hydroxycarbonate ( 1%) was added to the microphytobenthic pigment samples, which were then stored frozen at -20°C. Pigments were extracted from lyophilized sediment samples in 90% acetone. Chlorophyll-a and pheopigments were determined spectrophotometrically using the equations of Lorenzen (1967). Microphytobenthic carbon was estimated using a C: chlorophyll-a ratio of 40 (de Jonge, 1980; Cammen and Walker, 1986; Gould and Gallagher, 1990). Estimations of microphytobenthic production for transect B are given; these are based both on the standing crop variability (increment summation of positive variation of chlorophyll-a concentration which was considered as a minimum production value) and on pub li shed P/B ratios (Boucher, 1977; Schwinghamer et al., 1986).
The present study focuses on the microphytobenthos and associated biological and physico-chemical parameters in the oligo-mesohaline zone of the Gironde estuary and gives an estimation of microphytobenthic primary production.
MATERIALS AND METHODS Study area The Gironde estuary (45° 20' N, 0° 45' W), France, covers an area of 570 km2 at low tide with an intertida1 area of 50 km 2 • Ti dai amplitude varies between 2.5 and 5.0 rn and current velocities can reach 2 m.ç 1• Freshwater
550
MICROPHYTOBENTHOS IN THE GIRONDE ESTUARY
•w
existence oflag phases between dependent and independent variables. Before parametric analysis, variable normality was verified; when necessary, variables were log-transformed. RESULTS
Pigment spatial patterns Significant differences were found for chlorophyll-a concentrations both along the estuarine gradient and between stations at the intertidal flat (Tab. 1). An interaction between spatial factors was observed for chlorophyll-a, with a most pronounced tidal height effect at transects A and B (Fig. 2). These data did not provide evidence of temporal variations, but spring mean values were normally slightly higher than autumn ones . Chlorophyll-a normally decreased from the polyhaline area (transect D) to the oligo-mesohaline area (transects A and B), probably due to salinity variation (Fig. 2). Nevertheless, the highest mean value was recorded for transect A at station H, probably because of seagrasses in this zone, where epiphytes may have enhanced the concentration of benthic chlorophyll. Pheopigments followed the same pattern although without significant interactions. Chlorophyll-a was not significantly correlated with sediment sand content using the overall data. Only for October 1992 was there a significant correlation (r = - 0.65, n = 12, p < 0.05) between sediment sand content and chlorophyll-a concentration.
+o•4o·w
...2
"'
()
0 ()
;: 2
...
.
....""
45°10'N
D D
0
-+-
5
10km
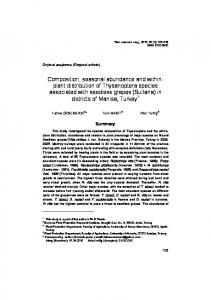
Figure 1
During 1992, temperature values were similar both between stations and sampling periods with mean values of 13.5 oc in April and 14 oc in October. The salinity gradient was also quite similar between sampling periods. In April 1992 salinities were 2, 5, 21.5 and 30 at transects A, B, C and D, respectively. In October 1992 values were 0, 3, 16 and 27 for transects A, B, C and D respectively.
Map of the Gironde estuary (France) showing the sampled transects (A, B, C and D). PK= distance, in km, from the city of Bordeaux.
Meiofauna data were taken from Santos et al. (1996). Particulate organic carbon was determined using a CHSLECO analyser (values were expressed as the percentage of carbon to sediment weight). The sand content was determined as the percentage (weight/weight) of sedimentary fraction greater than 63 p,m.
-
Statistics
8
ib :::!.
The spatial vanatwns of microphytobenthic pigments were investigated using a multifactor analysis of variance with the data log-transformed. Correlation analysis was used to determine the spatial relationship between microphytobenthic chlorophyll-a and sediment sand content.
'-'
12 10
C!:l
8
..c: 0..
6
::c!
4
:::::: ;;...
80
u
Analysis of variance was used to seek temporal variations of chlorophyll-a concentration. Stepwise multiple regression analysis (MRA) and simple regression analysis (RA) were used to determine the most important factors which explain standing crops of microphytobenthos and particulate organic carbon (p < 0.05 was used as the significance leve! both for including variables in the MRA and for accepting RA). Since the influence of environmental factors on the temporal variability of biological samples can presuppose !ag phase responses, cross-correlation analysis was used to investigate the
2 0 A
c B Sampling transects
D
Figure 2 Plot of mean values of chlorophyll-a concentration ( j.lg.cm-2 ) for transects (A, B. C and D) and intertidal stations (L, M and H).
551
P. J. P. SANTOS et al. Table 1
25
Multifactor analysis of variance for chlorophyll-a (log-transformed) ( J-Lg.cm-2 ) using as factors the distance from Bordeaux (pk), the intertidal leve/ (leve/) and the sampling date (date).
---u
20
... (J)
;:l
Source of variation
Sum of squares
d.f.
Mean square
F-ratio
..-
Sig. leve!
~
...
15
(J)
p.
Main effects A: pk B: levcl C: date
17.01 3.36 0.89
3 2 3
5.67 1.68 0.30
27.94 8.29 1.46
0.000 0.003 0.260
Interactions AB AC BC
8.25 1.28 1.20
6 9 6
1.37 0.14 0.20
6.78 0.70 0.99
0.001 0.699 0.462
Residu al
3.65
18
0.20
35.64
47
s
(J)
10
E-< 5 10
b 8
6
Total (corrected)
4
:l
Physico-chemical parameter cycle Sediment temperature followed a clear seasonal pattern (Fig. 3a). Temperature values varied between 5.8 (February) and 23.8 °C (July). Salinity varied between 0 and 9. Low values were found both in carly summer and late autumn (Fig. 3b), but June low values were atypical and related to heavy rainfall (260% of average values).
25
Apr
May
Jul
Aug
Ot.-t
Dec
Feb
Mar
Date Figure 3 Sediment temperature (a) and estuarine water salinity at low tide (b) during the study period.
The sand content of the sediment was usually lower than 5%. Values varied strongly at short time scales (up to JO% in one wcck) and no clear pattern could be observed at either station (Fig. 4a).
.,
14
Only small variations were observed for organic carbon in station L sediment samples (Fig. 4h). At station H, where values were usually higher than those observed at station L, higher values were observed in spring-summer as compared to autumn-winter (Fig. 4b).
~
-
-'
a
12 10
~
....,(J) c::
0 ()
.....
-
Pigment seasonal cycle
v
~ ~
~
"Jj
The mean annual values, based on weekly samples, of Chl-a were similar hetween both stations (26.4 and 30.5 mg.m- 2 for stations H and L respectively). A clear seasonal variation was observed at station L, where greater values were measured in late spring and summer (Fig. 5a). Though peak values at station H were also observed during summer, these were followed by rather low values, demonstrating the high variability during this season. A clear increase was observed during late winter and carly spring at this station (Fig. 5a). ANOVA results indicate that both stations showed significant temporal changes (Station H, F == 34.5, p < 0.0001; Station L, F == 9.66, p < 0.0001; d.f. 45 and 92 for both stations).
fiAr~~
1.11
u
b
H
1.6
1.2
0
...... ~
1.0
0.8
0.6
t ____L_._
Apr
Pheopigment mean annual values were also similar between stations, amounting to 64.8 mg.m-2 for station H and 60.4 mg.m- 2 for station L. At station H, values followed the pattern already observed for chlorophyll; but at station L no pattern was observed (Fig. 5h). The ratio of chlorophyll-a to pheopigments was usually Jess than one.
--'----'-v_ 29
IR
May
Jul
__,__ . L _ _ . . L - - - - ' - - - - - " - - - ' Au&
26
15
Ocl
Dec
3
Feh
'
2~
Mar
Date Figure 4 Sediment sand content (a) and sediment particulate organic carbon (b) at station H (circ/es) and station L (triangles).
552
MICROPHYTOBENTHOS IN THE GIRONDE ESTUARY Table 2
120
a
C\1
s s
.........
Stepwise multiple regression ana/ysis for chlorophyll-a (ln) at stations H and L (C regression coefficient; CR contribution to R 2 ) (Salinity with one week /ag-phase and sand in ln) (p < 0.05 for ali regressions).
100
cD
80
~
1
80
Station H
;..., ..c:::
40
Total data Temp. < 20°C
0..
...00
20
~
G
0
Intercept Insolation
c
0.320
c
0.424
CR
Total data
110
b
C\1
s a
R2
Salinity
-0.156 0.049 -0.266 0.188
0.058 0.286
0.426 0.545
_ _J__....,._J______
Station L
.........
0.061 0.091 0.113 0.357
CR
Sand
c
Intercept
Temp.
Hour Tide coetT
R2
-0.496
O.D75 0.523
0.052 - 0.006 0.033 0.038
0.594
CR
120
bD
_,
100
Il
(/)
;:::
80
s
60
Table 3
cu
I>D
Stepwise multiple regression analysisfor pheopigments (ln) at stations H and L (meiofauna biomass with a one week /ag-phase; chlorophyll-a, sand and temperature in ln) (p < 0.05 for hoth regressions).
;:l..
0
cu
40
..c::: ~
20
Apr
29
16
May
Jul
Aug
26
15
Oct
Dec
Station H Intercept
Chi-a
Sand
Biomass
c
0.343 0.646
-0.091 0.056
0.0004 0.029
25 Feb
Mar
Figure 5 Concentration of chlorophyll-a (a) and pheopigments (h) at station H (circ/es) and L (triangles).
1.496
CR
Date
Station L (mg.m- 2 )
c CR
Intercept Sand Salinity Chi-a 2.175
- 0.245 0.403
0.037 0.126
0.731
Temp.
0.219 -0.196 0.056 0.035
0.624
Multiple and simple regression analysis
Microphytobenthos production
Microphytobenthic chlorophyll-a and pheopigments were successfully modelled by MRA at both stations. At station H, chlorophyll-a was the Jess predictable variable, with only 43% of total variation explained by MRA based on insolation, salinity and sediment sand content (Tab. 2). Week-to-week increases of chlorophyll-a at this station showed maximum values for sediment temperatures around 20 oc. Excluding samples with sediment temperature higher than 20 oc from the MRA increases the explained variation of chlorophyll-a which reaches 54%. This result suggests a negative effect of temperatures higher than 20 °C on chlorophyll-a concentrations (Tab. 2). At station L, 59% of chlorophyll-a variation was explained by sediment temperature, sampling hour and tide coefficient (Tab. 2).
According to Cadée and Hegeman (1977), a good relationship can be expected between annual average chlorophyll-a concentration and annual primary production. Conversion factors (from chlorophyll-a in flg.g- 1 to primary production in gc.m-2.yr-1) from the literature are however seen to vary from 5 (Boucher, 1977) to 25 (Schwinghamer et al., 1986), with a mean of 1O. Values of chlorophyll-a per gram of sediment are strongly linked to the sampling depth, due to the concentration of algae at the sediment surface. Thus, chlorophyll-a values per area are certainly better for comparison between different studies. Using data from the Iiterature (Marshall et al., 1971; Cadée and Hegeman, 1977; Riznyk et al., 1978; Schaffer and Onuf, 1983; Colijn and de Jonge, 1984; Rizzo and Wetzel, 1985; Sundblick and Jonsson, 1988; Gould and Gallagher, 1990; Cammen, 1991 ), a significant regression (X = ln Chi-a; Y = ln PP) was obtained between values of chlorophyll-a (mg.m-2) and primary production (gC.m-2.yr- 1) (Y= 0.419 + 0.974 X; p < 0.001 R 2 = 79% n = 29) (Fig. 6). This model provides the primary production estimates of 37 and 42 gC.m-2 .yr-1 for stations H and L respectively at transect B. Table 4 presents minimum and maximum estimates, obtained using the conversion factors of 5 and 25 from the literature. This table also presents values, obtained by the biomass increment sommation method, which are close to those estimated with the minimum ratio and were similar for both stations.
At stations H and L, 73% · and 62% of pheopigment variability were explained respectively by the fact that at the former station, pheopigments were mainly related to chlorophyll-a concentration, sand content and - to a lesser degree- meiofauna biomass (Tab. 3), whereas at the latter station, the most important factor was sand content, followed by salinity, chlorophyll-a and temperature (Tab. 3). Particulate organic carbon was rather constant and showed no clear trend (Fig. 4b ). Nevertheless, at both stations it was a significant fonction (36 and 49% of variability explained by RA for stations H and L respectively) of pheopigments.
553
P.J. P. SANTOS et al.
~
:g
for other estuarine systems, ranging from 16 (Rizzo and Wetzel, 1985) to 300 mg.m-2 (Shaffer and Onuf, 1983). These low values are in ali likelihood due to the high turbidity and strong water movement which may result in reduced primary production and resuspension of sediments and algae (see de Jonge and van Beusekom, 1995; de Jonge, 1995). Although mean annual values were similar between stations, the pattern of variation presented clear differences (Fig. 5a) which probably reflect the elevation or submersion time of each station and imply different sets of factors controlling chlorophyll-a (Tab. 2). A similar pattern, i.e. chlorophyll-a increasing earlier in the upper intertidal sites as compared to lower sites, was already observed by Admiraal and Peletier ( 1980) and Colijn and Dijkema (1981). As indicated by MRA of chlorophyll-a for both stations (Tab. 2), biomass dynamics was a. function of both primary production and resuspension/erosionrelated factors (as temperature, insolation, salinity, hour of sampling, sand content and tide coefficient). The negative effect of high temperatures at station H (Tab. 2) can be explained by two non-alternative hypotheses: 1) a direct influence of temperature over the enzymatic processes; and 2) its influence on interstitial water evaporation.
6
'S 5.5
~
5
§
'ü 4.5 ::s
"0
J:
4
~3.5 c
-
3
2.5
3
3.5
4
4.5
5
5.5
6
ln[Chlorophyll-a (mglm2)]
Figure 6
Regression between chlorophyll-a concentration (mg.m-2 ) and primary production (gC.m-2.yr- 1 ) values taken from the literature (see text for references). Table 4
Estimations for microphytobenthos primary production (PP) (gC.m-2 .yr-1) [minimum ratio from Boucher (1977) and maximum ratio from Schwinghamer et al. ( 1986)]; for the increment summation method ratios are shawn.
DISCUSSION
Colijn and van Buurt (1975) did not find negative effects on production rates for temperatures up to 22 °C in the laboratory; and Gould and Gallagher ( 1990), in situ, found higher growth rates for temperatures from 28 to 31 °C as compared to 20 °C. Considering these observations and given that recorded temperatures, at the sampling site, were al ways lower than 30 °C, a direct influence of temperature is difficult to support.
The analysis of the spatial data of microphytobenthic pigments clearly showed the influence both of the estuarine gradient and of the tidal height (Tab. 1, Fig. 2), as was a1ready observed by other au thors (e.g. Brotas et al., 1995, and references therein). Sediment sand content was an important factor only during October 1992, probably due to the homogeneity of samp1ed sediment type: mud (sand content was al ways 1ower than 50%).
Anderson and Howell (1984) observed that during exposure, sediment can lose up to 8% of its water content, due to both drainage and evaporation. Holmes and Mahall (1982) observed a negative effect of decreasing water content on primary production of microphytobenthos. Thus, we suggest that, by increasing the evaporation of interstitial water, high temperatures may have limited microphytobenthic productivity, with a consequent reduction of biomass.
Station PP at station H PP at station L
Minimum ratio (5)
Maximum ratio (25)
Increment summation
15.4 16.0
77.0 80.0
12.0 (ratio = 3. 9) 13.6 (ratio= 4.3)
Reports of annual variation of microphytobenthos are rather contradictory. Clear seasonal cycles of microphytobenthos ch1orophyll-a were found by Leach (1970), Colijn and Dijkema (1981), Riaux-Gobin (1985), Gould and Gallagher (1990), Cammen (1991), Underwood and Paterson (1993) and de Jonge and Colijn (1994). On the other hand, Riznik and Phinney (1972), Cadée and Hegeman (1974) (but see their Fig. 9b), Rizzo and Wetzel (1985) and Brotas et al. ( 1995) did not find significant annual variations. The data obtained in the present paper provide the basis for an understanding of these differences. Most of the abovementioned studies were based on monthly, sometimes bi-weekly, sampling schedules. The high variation of chlorophyll-a and pheopigments values from week to week as compared to the annual variation makes the determination of seasonal cycles based on monthly sampling a matter of chance, as was already suggested by Rizzo and Wetzel ( 1985).
MRA results (Tab. 2) indicate clearly that insolation, temperature, salinity and hour of sampling, which are generally primary production-related variables (see Wulff and Mclntire, 1972; Shaffer and Onuf, 1983; Pinckney and Zingmark, 1991), were the principal explaining factors for chlorophyll-a. This result supports the use of mean annual chlorophyll-a concentration as an indicator of primary production level, as was observed in other studies (Cadée and Hegeman, 1977; Shaffer and Onuf, 1983; Colijn and de Jonge, 1984 ). Though significant, the resuspension-related variables, tide coefficient and sediment sand content, explained only a minor part of chlorophyll-a variation and their contribution to real resuspension is difficult to calculate on the basis of our data (Tab. 2). Nevertheless, taking station L as an example, it can be seen that the tide coefficient explains only 4% of chlorophyll-a variation (Tab. 2). On the other hand, if we focus on mean annual values of temperature (15 °C) and sampling hour (13:00 h), the same regression mode! would predict chlorophyll-a concentrations of 30 mg.m-2 for a weak tide
Values of chlorophyll-a found in the Gironde were low (26.4 and 30.5 mg.m-2 ) as compared to published values
554
MICROPHYTOBENTHOS IN THE GIRONDE ESTUARY
coefficient, 24 mg.m- 2 for the mean annual tide coefficient and 20 mg.m-2 for a strong tide coefficient. These results suggest that the tide coefficient resuspension effect on chlorophyll-a concentration can be rather important at station L (the difference between the mean tide coefficient and a weak or strong one being about 20% ), a conclusion which is supported by de Jonge and van Beusekom ( 1995) results for the Ems estuary, where up to 25% of the microphytobenthos biomass is maintained in suspension by wind and tide.
Hegeman (1977) and Colijn and de Jonge (1984) for restricted areas. The values of primary production obtained with this regression (approximately 40 gC.m- 2 .yr- 1, with prediction limits of 18 and 90 gC.m-2 .yr 1) are within the lower range of literature values for estuarine mudftats. These values are intermediate between the minimum and maximum values obtained with chlorophyll-a: primary production ratios (Tab. 4). The minimum ratio was very similar to that obtained by increment summation, and production values estimated with this ratio are below the prediction limits of the regression equation. These observations suggest that this ratio underestimates real values for the sampling site. The use of the maximum ratio produced values simi1ar to the higher prediction limits of the regression and should thus be considered a probable estimate of maximum potential primary production based on chlorophyll-a concentrations.
The ratio between chlorophyll-a and pheopigments reflects both the physiological condition of the algae and/or the input of algal detritus (Cadée and Hegeman, 1977; Lamontagne et al., 1986; Plante-Cuny and Bodoy, 1987). High values of pheopigments as compared to chlorophyll-a are generally associated with the input of algal detritus (Cadée and Hegeman, 1977). Given that pheopigments at station L were mainly an inverse function of sand content (a factor which reflects erosion/deposition) (Tab. 3), the input of algal detritus would appear to be the best hypothesis to explain pheopigment variation. At station H, pheopigment concentration was explained mainly by chlorophyll-a concentration and thus reflected the degradation of autochthonous algae. The fact that meiofaunal biomass helps to explain the variation of pheopigments supports this view. Two modes of meiofaunal action can produce pheopigments: the acidification of ch1orophyll-a through ingestion (Shuman and Lorenzen, 1975); and the burial of algae by bioturbation (Aller and Aller, 1992; Webb and Montagna, 1993; Green and Chandler, 1994).
Irigoien and Castel ( 1997) suggested that phytoplankton primary production cannot occur in the oligo-mesohaline area of the Gironde estuary, due to high water turbidity throughout the year, and that resuspension was the best hypothesis to exp1ain the chlorophyll-a concentration in the water in this area. Moreover, they suggested that the overall estuarine phytop1ankton production does not exceed 5 gC.m- 2 .yr- 1 • Comparing this value with the predicted value for microphytobenthos production at transect B (40 gC.m- 2 •yr-1), and bearing in mind both that chlorophyll-a biomass was very low at this transect and that intertidal areas (50 km2 ) account for about 10% of the area covered by the estuary, the importance of the benthic production for the estuarine ecosystem is clearly demonstrated.
Particu1ate organic carbon depended on pheopigments, but only Jess than half of total variation was explained by this variable. Values were rather constant in time (Fig. 4b ), which makes micro-scale spatial variation a possible important factor. The coefficient of variation for sample replicates could be as much as 31%, which is high in comparison with the annua1 variation (coefficient of variation of 13 and 17% for stations H and L respectively). We thus suggest that a great part of POC variation at both stations was related to micro-scale spatial distribution.
Acknowledgements Thanks are due to A.- M. Castel for her technical assistance. H. Etcheber analysed POC contents of the sediments. Special thanks are due to V.N. de Jonge and an anonymous referee for their comments and valuable suggestions. LPSS and PJPS acknowledge a CAPES postgraduate research studentship (Brazil). This study was supported by a CEC MAST programme (JEEP 92 contract 0024-C) and by an IFREMER grant (contract 92-2-408402).
The significant relationship between mean annual ch1orophyll-a concentration (mg.m-2 ) and primary production (gC.m-2 .yr- 1), obtained from geographically different data sets (Fig. 6), asserts and extends the results of Cadée and
REFERENCES
Boucher D. ( 1977). Production primaire saisonnière du microphytobenthos des sables envasés en Baie de Concarneau. In: Bio/ogy of benthic organisms (Proc. llth EMBS) B.F. Keegan, P.O. Céidigh, P.J.S. Boaden eds. Pergamon Press, Oxford, 85-92.
Admiraal W., H. Peletier (1980). Influence of seasonal variations of temperature and light on the growth rate of culture and natural populations of intertidal diatoms. Mar. Eco/. Prog. Ser. 2, 35-43. Aller R.C., J.Y. Aller (1992). Meiofauna and solute transport in marine muds. Limnol. Oceanogr. 37, 1018-1033. Anderson F.E., B.A. Howell (1984). Dewatering of an unvegetated muddy tidal flat during exposure-desiccation or drainage? Estuaries 7, 225-232.
Brotas V., T. Cabrita, A; Portugal, J, Serodio, F. Catarino (1995). Spatio-temporal distribution of the microphytobenthic biomass in intertidal flats of Tagus Estuary (Portugal). Hydrobiologia 300/301, 93-104.
555
P. J. P. SANTOS et al. Cadée G.C., J, Hegeman (1974). Primary production of the benthic microflora living on tidal fiats in the Dutch Wadden Sea. Neth. J. Sea Res. S. 260-291.
Lorenzen C.J, (1967). Determination of chlorophyll and pheopigments spectrophotometric equations. Limnol. Oceanogr. 12, 343-346. Marshall N., A. Oviatt, D.M. Skauen (1971). Productivity of the benthic microflora of shoal estuarine environments in southem New England. Inter. Rev. ges. Hydrobiol. 56, 947-956.
Cadée G.C., J, Hegeman ( 1977). Distribution of primary production of the benthic microflora and accumulation of organic matter on a tidal flat area, Balgzand, Dutch Wadden Sea. Neth. J. Sea Res. 11, 24-41.
Pinckncy J,, R.G. Zingmark (1991). Effects of tidal stage and sun angles on intertidal benthic microalgal productivity. Mar. Eco/. Prog. Ser. 16, 81-89.
Cammen L.M. (1991). Annual bacterial production in relation to benthic microalgal production and sediment oxygen uptake in an intertidal sandflat and an intertidal mudflat. Mar. Eco/. Prog. Ser. 71, 13-25.
Plante-Cuny M.R., A. Bodoy (1987). Biomasse et production primaire du phytoplancton et du microphytobenthos de deux biotopes sableux (Golfe de Fos, France). Oceanologica Acta 10, 223-237.
Cammen L.M., J.A. Walker ( 1986). The relationship betwecn bacteria and micro-algae in the sediment of a Bay of Fundy mudflat. Estuar. Coast. Shelf Sei. 22, 91-99.
Pomeroy L.R. ( 1959). Alga1 productivity in salt marshes of Georgia. Limnol. Oceanogr. 4, 386-397. Prieur D., M. Troussellier, A. Romana, S. Chamroux, G. Mevcl, B. Baleux ( 1987). Evolution of bacterial communities in the Gironde estuary (France) according to a salinity gradient. Estuar. Coast. Shelf Sei. 24, 95-108.
Colijn F. (1983). Primary production in the Ems-Dollard estuary. Ph. D. Thesis, University of Groningen, 123 p. Colijn F., G. van Buurt (1975). Influence of light and temperature on the photosynthetic rate of marine benthic diatoms. Mar. Biol. 31, 209-214.
Riaux-Gobin C. (1985). Variations temporelles des sels nutritifs et des pigments chlorophylliens dans J'eau interstitielle d'une vase estuarienne de Bretagne Nord. Cah. Biol. Mar. 26, 109-124.
Colijn F., K.S. Dijkema (1981). Species composition of benthic diatoms and distribution of chlorophyll-a on an intertidal flat in the Dutch Wadden Sea. Mar. Eco/. Prog. Ser. 4, 9-21.
Riznyk R.Z., H.K. Phinney ( 1972). The distribution of intertidal phytopsammon in an Oregon estuary. Mar. Biol. 13, 318-324.
Colijn F., V.N. de Jonge (1984). Primary production of microphytobenthos in the Ems-Dollard estuary. Mar. Eco/. Prog. Ser. 14, 185-196.
Riznyk R.Z., J.J. Edens, R.C. Libby (1978). Production of epibenthic diatoms in Southern Califomia impounded estuary. J. Phycol. 14, 273-279.
J