Feb 22, 2018 - subtropical monsoon climate. The annual average temperature is .... multimedia two-model system. Journal of Hydrology, 2011. 409(03): p.
IOP Conference Series: Earth and Environmental Science
PAPER • OPEN ACCESS
Spatial distribution and output characteristics of nonpoint source pollution in the Dongjiang River basin in south China To cite this article: Q Q Rong et al 2018 IOP Conf. Ser.: Earth Environ. Sci. 113 012145
View the article online for updates and enhancements.
This content was downloaded from IP address 181.214.116.236 on 22/02/2018 at 00:24
ICAESEE 2017 IOP Conf. Series: Earth and Environmental Science1234567890 113 (2018) 012145
IOP Publishing doi:10.1088/1755-1315/113/1/012145
Spatial distribution and output characteristics of nonpoint source pollution in the Dongjiang River basin in south China Q Q Rong 1,2, M R Su 2*, Z F Yang 2, Y P Cai 3, W C Yue 1,2 and Z Dang 1 1
School of Environment and Energy, South China University of Technology, Guangzhou, 510006, China 2
Research Center for Eco-environmental Engineering, Dongguan University of Technology, Dongguan, 523808, China;
3
State Key Laboratory of Water Environment Simulation, School of Environment, Beijing Normal University, Beijing, 100875, China Abstract: In this research, the Dongjiang River basin was taken as the study area to analyze the spatial distribution and output characteristics of nonpoint source pollution, based on the export coefficient model. The results showed that the annual total nitrogen and phosphorus (i.e. TN and TP) loads from the Dongjiang River basin were 67916114.6 and 7215279.707 kg, respectively. Residents, forestland and pig were the main contributors for the TN load in the Dongjiang River basin, while residents, forestland and rainfed croplands were the three largest contributors for the TP load. The NPS pollution had a significant spatial variation in this area. The pollution loads overall decreased from the northeast to the southwest part of the basin. Also, the pollution loads from the gentle slope area were larger than those from steep slope areas. Among the ten tributary watersheds in the Dongjiang River basin, the TN and TP loads from the Hanxi River watershed were the largest. On the contrary, the Gongzhuang River watershed contributed least to the total pollution loads of the Dongjiang River basin. For the average pollution load intensities, Hanxi River watershed was still the largest. However, the smallest average TN and TP load intensities were in the Xinfeng River watershed.
1. Introduction Water pollution has posed great threat on the environment, ecology and human health in many countries. It has become very prominent in recent decades with the rapid expanding of human society and economic activity. Relevant research showed that continuous water quality degradation has become one of the major factors restricting the sustainable development of the economy and society [1, 2]. It is very important and imperative to take some measures to protect water environment. The sources of water pollution can be mainly divided into two types, which are point and nonpoint source (PS and NPS) pollution. As more attention has been paid to the PS pollution, NPS pollution has become the primary contributor to both surface and ground water degradation, due to its complex sources and wide distribution [3, 4]. It is one of the most primary causes leading to ecological environment deterioration and water resource degradation, which makes it an important factor threating human health in many regions [5, 6]. Thus, fully using the existing theories and methods to scientifically analyze the characteristics of NPS pollution and then seeking effective controlling methods and management modes are the main tasks for the current and future NSP pollution research.
Content from this work may be used under the terms of the Creative Commons Attribution 3.0 licence. Any further distribution of this work must maintain attribution to the author(s) and the title of the work, journal citation and DOI. Published under licence by IOP Publishing Ltd 1
ICAESEE 2017 IOP Conf. Series: Earth and Environmental Science1234567890 113 (2018) 012145
IOP Publishing doi:10.1088/1755-1315/113/1/012145
In the previous research, model simulation was one of the most important research methods to quantify NPS pollution characteristics on multiple scales, especially on large scales [7]. Particularly, with an advantage of requiring less data and user-friendly control, empirical models were proved to be a very effective method to identify NPS pollution characteristics. As a representative empirical model, export coefficient model (ECM) is considered as one of the most reliable methods to simulate NPS pollution loads on medium and large scales [8, 9]. Although it did not take into account the influence of hydrological factors and transport process on NPS pollution load, ECM can meet the requirements of NPS pollution simulation in the regions lacking of data and conform to the current situation in China [10, 11]. Also, it could improve the sensitivity to land use changes and reduce the dependence on monitoring data [12]. Thus, it can provide a modeling method with certain precision for quantitative simulation study on large watershed NPS pollution, which has been widely used in various watersheds (e.g. Loess Plateau area, Three Gorges Reservoir Region and Songliao River basin in China). It has been proved that the ECM could greatly simplify the formation processes of agricultural NPS pollution. The model results can help provide a data base for watershed water environmental management. The Dongjiang River provides water for more than 40000000 people. It is of great importance to protect the water quality of this river. However, with the rapid economic development and the population explosion, the water pollution in the Dongjiang River basin is getting worse. Although some measures have been taken to control the PS pollution in recent years, the improvement of river water quality is not obvious. Thus, it is of great significance to establish a NPS pollution model in the entire basin to study the characteristics and further strengthen the control and management of nonpoint source pollution. Therefore, taking the Dongjiang River basin as the study area, the objectives of this research is 1) to collect the natural and social economic data to establish the spatial and attribute database of the study area; 2) to establish the export coefficient model to estimate the NPS pollution loads; and 3) to analyze the spatial distribution and output characteristics of NPS pollution in the basin. The results obtained from this research will help provide a solid base for the NPS pollution management on a watershed scale, which is of great scientific and practical significance. 2. Materials and methods 2.1 Description of the study area With an area of 35340 km2, Dongjiang River basin (N22°45´~25°20´, 113°30´~116°45´) is the third largest drainage system in the Pearl River watershed (Figure 1). The length of the river is approximately 370 km and the average gradient is 0.35 ‰. The terrain of the Dongjiang River basin is very complex. Mountain, hills, platform and plain approximately account for 34.77%, 38.58%, 9.84% and 13.01 % of the total area, respectively. The land use types in this area mainly include forestland, grassland, farmland, garden land, urban land and water area. Dongjiang River basin belongs to a subtropical monsoon climate. The annual average temperature is 20.4 ° C .The average annual precipitation amount is between 1500-2400 mm, with an increasing trend from the northeast to the southwest of the area. Also, the distribution of the precipitation is uneven during the year. The flood season usually begins from April and ends in September. More than 80% of the total annual precipitation falls during this period.
2
ICAESEE 2017 IOP Conf. Series: Earth and Environmental Science1234567890 113 (2018) 012145
IOP Publishing doi:10.1088/1755-1315/113/1/012145
Figure 1. The location and terrain characteristics of the Dongjiang River basin 2.2 Export coefficient model Export coefficient model was originally proposed in North America in 1970s and was used to investigate the relationship among land use, nutrient loading and lake eutrophication. The export coefficient of an agricultural NPS pollutant is the standardized estimation of the pollution loads from a certain source. It is usually expressed as the total output amount of each pollutant from a unit area in a unit time. Thus, through analyzing the pollution source characteristics (e.g. land use patterns) and using the corresponding export coefficients, NPS pollution loads form the entire watershed can be estimated. It is a simple and convenient lumped estimation method for the quantification research on agricultural NPS pollution [13, 14]. The modified export coefficient model is outlined as follows: ௌ
ܮൌ ܥܧ௦ ሾܣ௦ ሺܫ௦ ሻሿ ௦ୀଵ
where L is the loss of nutrients (kg), ECs is the export coefficient for nutrient source s (kg/ca·yr or kg/km2 ·yr); As is area of the catchment occupied by land use type s (km2), or number of livestock type s, or of people; Is is the input of nutrients to source s (kg), and p is the input of nutrients from precipitation (kg), which is ignored in this research. It should be noted that the land use type should include the dominant vegetation type in the area, which may impact runoff in the area. 2.3 Data preparation The determination of the values of export coefficients is the key for the export coefficient model. There are many factors affecting the values of export coefficients, which include landform, hydrology, climate, vegetation, soil types and structure, and agricultural activities. The methods to determine the values of export coefficients mainly include two types (i.e. through field monitoring and consulting literature). The export coefficient values obtained from field monitoring have a relatively high precision. However, it usually requires much manpower and material input. Also, it is difficult to be fully implemented in some certain cases. On the contrary, the method of consulting literature is convenient, low-cost and of a certain accuracy. In this research, the values of the export coefficients of different land use types, people and livestock were determined through literature consulting, which is shown in table 1. Concurrently, the detailed information and sources of other data for the export coefficient model, including terrain characteristics, land use, population size and livestock breeding, are showed in the table 2.
3
ICAESEE 2017 IOP Conf. Series: Earth and Environmental Science1234567890 113 (2018) 012145
IOP Publishing doi:10.1088/1755-1315/113/1/012145
Table 1. The export coefficient data of different land use types, people and livestock in the Dongjiang River basin Nonpint Land use type Unit Export coefficient Export source of TN coefficient of TP Dry land 11.201 1.541 Different Paddy land 14.863 1.677 land use Forestland kg·hm-2·a-1 4.244 0.590 types Grassland 6.302 0.719 Urban land 3.240 0.100 Domestic waste 19.547 2.142 Residents Cattle 113.715 2.179 and t·(ca·104)-1·a-1 Pig 26.667 1.417 livestock Sheep 15.134 0.450 Poultry 0.459 0.054 Major paratermeters DEM Land use Population Livestock
Table 2. Major parameters in the model and data sources Data sources Aster DEM data, 30 m (http://www.gscloud.cn/) GlobalCover 2009 landuse map,1 km (http://due.esrin.esa.int/page_globcover.php) Statistical Yearbooks Statistical Yearbooks
3. Results and discussion 3.1 Overview of the nonpoint source pollution status in the Dongjiang River basin The annual TN and TP loads from the Dongjiang River basin were 67916114.6 and 7215279.707 kg, respectively. Specifically, residents, forestland and pig were the main contributors for the TN load in the Dongjiang River basin. There were 32978904.39, 11203994.37 and 9500343.51 kg TN exported form theses three sources, respectively, accounting for approximately 48, 16 and 14% of the total TN load in the research area. For the TP load in this area, residents, forestland and rainfed croplands were the three largest contributors. The TP loads exported from these three sources were 3613896.76, 1557576.92 and 802260.01 kg, respectively, accounting for approximately 50, 22 and 11% of the total TP load in the research area. Although the proportion of cropland is relatively small the Dongjiang River basin, the sum of the TN and TP loads from the rainfed and post-flooding croplands reached to 6188763.32 and 842586.83 kg, respectively, accounting for 10 and 12 % of the total pollution loads. Among the different pollution sources, grassland, artificial surface, water bodies, bare land, sheep and cattle have a relatively small contribution to the pollution loads, due to the small areas or population sizes (Figure 2).
4
ICAESEE 2017 IOP Conf. Series: Earth and Environmental Science1234567890 113 (2018) 012145
IOP Publishing doi:10.1088/1755-1315/113/1/012145
Figure 2. The contribution of different sources to the TN and TP loads in the Dongjiang River basin
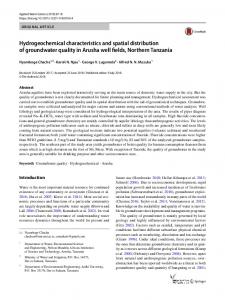
3.2 Spatial distribution of the nonpoint source in the Dongjiang River basin TN and TP loads distributed unevenly in the research area. These two loads overall increased from the northeast to the southwest part of the area (Figure 3). The possible reason for such trend is that the southwest part of the basin has a large population density, which could lead to a large pollution load. Also, frequent human activities (e.g. fertilizer application) could facilitate the nutrient accumulation in soil and accelerate the soil erosion, which could further increase the export amounts of TN and TP loads.
Figure 3. TN and TP load distribution in the Dongjiang River watershed At the same time, the TN and TP loads varied with slope in the research area. TN and TP loads from the areas with a slope greater than 25° degrees were the smallest, while those from the areas with a slope less than 2° were the largest (Table 3). Generally, the output risk of nonpoint source pollutants with runoff is usually high in the areas with steep slope. Such risk is relatively low in the areas with gentle slope. However, in the Dongjiang River basin, it can be seen that the low and high output load regions were mainly distributed in the steep and gentle slope areas, respectively. The main reasons were that the forestland was the main land use type in the steep slope area which has relatively small export coefficients. For the gentle slope, cropland account for a relatively larger proportion of the area, leading to a heavy pollution loads. Table 3. Variations in TN and TP loads with slope in the Dongjiang River watershed Slope TP load (kg) Slope grade TN load (kg) ≤2 I 17737458.11 1864650.40 2~6 II 14810226.15 1587707.30
5
ICAESEE 2017 IOP Conf. Series: Earth and Environmental Science1234567890 113 (2018) 012145
III IV V
6~15 15~25 >25
16577362.37 12362081.07 6427735.40
IOP Publishing doi:10.1088/1755-1315/113/1/012145
1765080.61 1313705.65 684003.43
Among the ten tributary watersheds in the Dongjiang River basin, the TN and TP loads from the Hanxi River watershed were the largest, accounting for approximately 20 % of the total loads. On the contrary, the Gongzhuang River watershed contributed least to the total pollution loads, due to its smallest area (Figures 4). For the average pollution load intensities, Hanxi River watershed was still the largest, with 60.09 and 6.49 kg/ha•yr for TN and TP loads, respectively. The smallest average pollution load intensities were in the Xinfeng River watershed, which were 10.85 and 1.17 kg/ha•yr for TN and TP loads, respectively.
Figure 4. TN and TP loads (kg) and average pollution intensity (kg/ha•yr) of each tributary watershed in the Dongjiang River basin In regard to the contributions of different sources to the NPS pollution loads in each tributary watershed, human life was the main source for both TN and TP loads from the Hanxi, Shima and main stream watersheds, accounting for more than 50% of the total pollution loads in these areas. For the Xizhi River watershed, TN and TP loads were still the largest. However, the proportions of these two loads from human life and livestock breeding significantly increased. With respect to the Lijiang, Xinfeng and Qiuxiang River watersheds, agricultural land were the greatest contributor to the pollution loads. Both the TN and TP loads from agricultural land accounted for more than 40% of the total pollution loads. For the Xunwu, Beiling and Gongzhuang River watersheds, the TN and TP loads were mainly exported from livestock and agricultural land, respectively. As for the Zengjiang River watershed, human life and agricultural land were the largest contributors to the TN and TP loads (Figure 5).
6
ICAESEE 2017 IOP Conf. Series: Earth and Environmental Science1234567890 113 (2018) 012145
IOP Publishing doi:10.1088/1755-1315/113/1/012145
Figure 5. Contributions of different sources to the NPS pollution loads in each tributary watershed 4. Conclusion In this research, an export coefficient model was used to evaluate the nonpoint source (NPS) pollution loads from various sources in the Dongjiang River basin. The results of the model calculation showed that the annual TN and TP loads from the Dongjiang River basin were 67916114.6 and 7215279.707 kg, respectively. Residents, forestland and pig were the main contributors for the TN load in the Dongjiang River basin, while, residents, forestland and rainfed croplands were the three largest contributors for the TP load. Therefore, the construction of waste water storage, treatment and utilization facilities is an effective measure to control the NPS N pollution. Also, agricultural management measures, such as improving the fertilizer utilization rate, could help control the NPS P pollution. The NPS pollution in this area had a significant spatial variation. The pollution loads were overall increased from the northeast to the southwest part of the area. Also, the pollution loads from the gentle slope area were larger than those from steep slope areas. Among the ten tributary watersheds in the Dongjiang River basin, the TN and TP loads from the Hanxi River watershed were the largest. On the contrary, the Gongzhuang River watershed contributed least to the total pollution loads of the Dongjiang River basin. For the average pollution load intensities, Hanxi River watershed was still the largest. However, the smallest average TN and TP load intensities were in the Xinfeng River watershed. Acknowledgement This work was financially supported by the National Key R & D Program of China (No.2017YFC0405900 and 2016YFC0502800), the Natural Science Foundation for Distinguished Young Scholars of Guangdong Province (No.2017A030306032), Guangdong Innovation Team Project for Colleges and Universities (No. 2016KCXTD023), GDUPS (2017), the Scientific Research Foundation for High-level Talents and Innovation Team in Dongguan University of Technology (No. KCYKYQD2016001), and the Research Start-up Funds of DGUT (No. GC300501-16). References [1] Kun, M., et al., Optimizing water quality monitoring networks using continuous longitudinal monitoring data: a case study of Wen-Rui Tang River, Wenzhou, China. Journal of Environmental Monitoring, 2011. 13(10): p. 2755-2762. [2] Strokal, M., et al., Increasing dissolved nitrogen and phosphorus export by the Pearl River (Zhujiang): a modeling approach at the sub-basin scale to assess effective nutrient management. Biogeochemistry, 2015. 125(2): p. 221-242. [3] Lai, Y.C., et al., Evaluation of non-point source pollution and river water quality using a multimedia two-model system. Journal of Hydrology, 2011. 409(03): p. 583-595. [4] Wellen, C., et al., Quantifying the uncertainty of nonpoint source attribution in distributed water quality models: A Bayesian assessment of SWAT’s sediment export predictions. Journal of
7
ICAESEE 2017 IOP Conf. Series: Earth and Environmental Science1234567890 113 (2018) 012145
IOP Publishing doi:10.1088/1755-1315/113/1/012145
Hydrology, 2014. 519: p. 3353-3368. [5] Shen, Z., et al., An overview of research on agricultural non-point source pollution modelling in China. Separation and Purification Technology, 2012. 84: p. 104-111. [6] Volk, M., et al., SWAT: Agricultural water and nonpoint source pollution management at a watershed scale. Agricultural Water Management, 2016. 175: p. 1-3. [7] Shen, Z., et al., Identifying non-point source priority management areas in watersheds with multiple functional zones. Water Research, 2015. 68C: p. 563-571. [8] Dai, C., et al., Identification of optimal placements of best management practices through an interval-fuzzy possibilistic programming model. Agricultural Water Management, 2016. 165: p. 108-121. [9] Rong, Q., et al., An enhanced export coefficient based optimization model for supporting agricultural nonpoint source pollution mitigation under uncertainty. Science of Total Environment, 2017. 580: p. 1351-1362. [10] Wu, L., et al., Application of modified export coefficient method on the load estimation of non-point source nitrogen and phosphorus pollution of soil and water loss in semiarid regions. Environmental Science and Pollution Research, 2015. 22(14): p. 10647-10660. [11] Liu, R., et al., Spatial-temporal characteristics of phosphorus in non-point source pollution with grid-based export coefficient model and geographical information system. Water Science & Technology, 2015. 71(11): p. 1709. [12] Wang, J., et al., Simulation of the dissolved nitrogen and phosphorus loads in different land uses in the Three Gorges Reservoir Region-based on the improved export coefficient model. Environmental Science Processes & Impacts, 2015. 17(11): p. 1976. [13] Johnes, P.J., An Investigation of the Effects of Land Use Upon Water Quality in the Windrush Catchment. Biotropica, 1990. 31(2): p. 279-287. [14] Johnes, P.J., Evaluation and management of the impact of land use change on the nitrogen and phosphorus load delivered to surface waters: the export coefficient modelling approach. Journal of Hydrology, 1996. 183(3-4): p. 323-349.
8