Environ Monit Assess (2014) 186:6017–6038 DOI 10.1007/s10661-014-3837-z
Spatial distribution and source identification of trace elements in topsoil from heavily industrialized region, Aliaga, Turkey Melik Kara & Yetkin Dumanoğlu & Hasan Altıok & Tolga Elbir & Mustafa Odabası & Abdurrahman Bayram
Received: 22 January 2014 / Accepted: 14 May 2014 / Published online: 24 May 2014 # Springer International Publishing Switzerland 2014
Abstract Topsoil samples (n=40) were collected from a heavily industrialized region in Turkey. The region includes several scrap processing iron–steel plants with electric arc furnaces (EAFs), a petroleum refinery, a petrochemical complex, steel rolling mills, a natural gas-fired power plant, ship-breaking yards and very dense transportation activities. The region has undergone a rapid transition from an agricultural region to a heavily industrialized region in the last three decades. Collected soil samples were analyzed for 48 trace elements using inductively coupled plasma-mass spectrometry (ICP-MS). The elemental distribution pattern in the region indicated that Nemrut area with dense iron–steel production activities was a hotspot for elemental pollution. In addition to crustal elements, concentrations of anthropogenic trace elements (i.e., Fe, Zn, Pb, Mn, Cu, Cd, Cr and Mo) were very high in the area influencing many parts of the region. Elemental compositions of fugitive sources polluting the soil (i.e., paved and unpaved roads, slag piles, EAFs filter dust piles and coal piles) were also determined. The methods (enrichment factors [EFs] and the index of geoaccumulation [Igeo]) used for determination of pollution status of soil showed that Cr, Ag, Zn, As and Pb were the strongly M. Kara (*) Center for Air Resources Engineering and Science, Clarkson University, Potsdam, NY 13699-5708, USA e-mail:
[email protected] M. Kara : Y. Dumanoğlu : H. Altıok : T. Elbir : M. Odabası : A. Bayram Department of Environmental Engineering, Dokuz Eylul University, Tinaztepe Campus, Izmir 35160, Turkey
contaminating elements for the region. Principal component analysis (PCA) clearly indicated that anthropogenic sources (steel production, refinery and petrochemical processes and traffic) were important sources in this region. Keywords Trace elements . Topsoil . Pollution assessment . GIS . Fugitive sources . Iron–steel emissions
Introduction In industrial and urban areas, several pollutants are emitted from different sources such as industrial plants, vehicle emissions, residential heating, fugitive sources and natural activities (Guo et al. 2012; Anatolaki and Tsitouridou 2007; Azimi et al. 2005; Salvador et al. 2004). Soil is a crucial component of the ecosystem, and in industrial and urban areas it receives large amounts of trace elements from several sources. Therefore, accumulated pollutants in surface soils can be transported to different environmental components, such as deep soil, water, plants and dust particles. While elemental contamination of soils is caused mainly by atmospheric deposition, soil also affects the air quality since enriched trace elemental contents in atmospheric particulate matter originate from resuspension of polluted soils (Ashbaugh et al. 2003). Assessment of the trace elemental contents in soil and their origin are primary objectives for maintaining and improving soil quality in many regions. Therefore, to establish reliable policies for a sustainable soil quality
6018
for a region, it is necessary to have a good knowledge of soil pollution. Soil pollution is often determined by comparing elemental concentrations with the related environmental guidelines (CCME 2007; VROM 2000) and by using potential ecological risk index with respect to relevant background levels (Luo et al. 2012). Several statistical methods have also been widely used to determine the degree of the pollution in the soil. (Dragovic et al. 2008; Wei and Yang 2010; Li et al. 2014). Multivariate analyses (principal component analysis [PCA] and cluster analysis [CA]) for identification of possible sources (Zhao et al. 2007; Chen et al. 2008; Li and Feng 2012) and geostatistical analysis (spatial mapping based on GIS) for determining of possible hotspots of trace elements (Zhao et al. 2014; Yesilonis et al. 2008; Guo et al. 2012; Yuan et al. 2014) have also been used for industrial and urban soils. Soil pollution has become a severe problem in many parts of the world due to human activities (Facchinelli et al. 2001; Solgi et al. 2012; Zhang 2006; Davis et al. 2009). Following rapid social and economic development over the past several decades, soil trace elemental pollution in urban, industrial, agricultural and mining areas has also become serious and widespread in some regions of Turkey. Recently, studies were carried out on soils affected by human activities (i.e., industrial and mining) in different regions of Turkey (Odabasi et al. 2010; Canbay et al. 2010; Gemici et al. 2009; Koz et al. 2012; Kumru and Bakac 2003; Yatkin and Bayram 2011; Yaylalı-Abanuz 2011). Results have indicated that trace element concentrations in soil reached up to high levels in some heavily industrialized regions (i.e., Iskenderun, Gebze). Aliaga region is also one of the heavily industrialized regions in Turkey. The region has undergone a rapid transition from an agricultural region to a heavily industrial region, and has formed a complete industrial structure arising from iron–steel production from scrap, petroleum refining, petrochemical plants, electric power generation and other industries (i.e., fertilizer plants, steel rolling mills). The establishment of industrial activities without proper planning and subsequent population increase have resulted in important impacts on the local ecosystem and posed a potential threat to human health. The objectives of this study were (1) to determine the concentrations of trace elements in soils of a heavily industrialized region (Aliaga, Turkey) and characterize their spatial distribution using a GIS (Geographic Information System)-based interpolation method, and
Environ Monit Assess (2014) 186:6017–6038
(2) to identify the possible sources of trace elements in soils. Samples from fugitive dust sources (paved and unpaved roads, slag and coal piles, and stack dust from scrap processing iron–steel plants with electric arc furnaces [EAFs]) were also characterized to determine their effect on soil pollution.
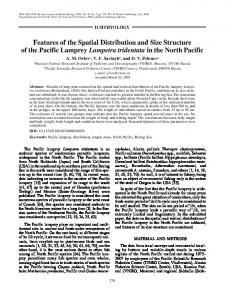
Materials and methods Study area and sampling sites Located in ∼50 km north of Izmir, Turkey, the Aliaga region contains several significant pollutant sources including scrap processing iron–steel plants with EAFs, a large petroleum refinery, a petrochemical complex, several steel rolling mills, a natural gas-fired power plant, a fertilizer plant, scrap storage and classification sites, large slag and scrap piles, a very dense transportation activity of ferrous scrap trucks, heavy road and rail traffic, ship-breaking yards and busy ports used for product and raw material shipping. The Aliaga town, with a population of ∼60,000, several villages and agricultural areas, are also located in the region. The region located on the coast of Aegean Sea is mainly classified within the local climate of the Mediterranean Sea characterized by hot, dry summers and cool, wet winters and spring. The annual rainfall reaches to 688 mm while highest monthly rainfall is 131 mm during December (TSMS 2013). The prevailing wind directions are northwest for summer and southeast for winter. Locations of the sampling sites, industrial activities and settlements in the study area and wind rose for the region are illustrated in Fig. 1. Sample collection and analysis The topsoil samples (upper 5 cm layer) were collected from industrial (n=7), Nemrut area (n=13) and nonindustrial (rural or residential) (n=20) sites in July 2009 (in dry period) in the study area. Also, fugitive dust samples were collected from paved roads (n=13), unpaved roads (n=8), slag piles (n=4), EAF filter dust (n=3), coal dust (n=1), PM10 and PM2.5 (n=3) from the stack gas of EAFs after fabric filters in the Nemrut industrial area (Fig. 1). The soil samples were collected as composites of at the least 10 points in each sampling site and the plant roots, leaves and stones were initially removed. Approximately
Environ Monit Assess (2014) 186:6017–6038
Fig. 1 General view of the study area
6019
6020
500-g samples were placed into polyethylene bags and transported to laboratory within a portable icebox. At the laboratory, the samples were passed through a plastic sieve (1 mm mesh size) after being homogenized manually. Soil samples for each site (∼0.5 g) were weighed using a microbalance (GEC Avery, capable of weighing 100 μg) and they were digested using a HNO3 (65 %, Merck, Suprapur®) and HCl (30 %, Merck, Suprapur®) mixture with a microwave digestion system (MARS 5, CEM Corp.). Digested samples were diluted to 100 mL with deionized water (18.2 MΩ/cm) and filtered through a 0.45 μm PTFE filter (Millipore) before analysis. The same procedures were applied for the fugitive dust samples after they were sieved through a 75-μm mesh sieve (i.e., the fine size fraction classified by EPA Method AP-42). PM10 and PM2.5 samples from the stack gas of EAFs were collected using a sampling train for PM10 and PM2.5 fractions (Model PF 20357, PF 20358, PF 20359; Zambelli Inc.) according to EPA Method 201/ 201A. The sampling was carried out with a flow rate of 14.27 l/min determined according to stack gas properties and 4 mm nozzle size was used to obtain an isokinetic sampling. Teflon filters (PTFE) (47 mm, 2.0–μm pore size; Whatman) conditioned at 103 °C for 1 h followed by 1 h in a desiccator were weighed before and after sample collection using a microbalance (Mettler-Toledo; capable of weighing 1 μg). The filters were digested and prepared using the same procedures utilized for other samples. Analysis of trace elements (Ag, Al, As, B, Ba, Be, Bi, Ca, Cd, Ce, Co, Cr, Cu, Dy, Er, Eu, Fe, Ga, Gd, Hg, Ho, K, La, Li, Lu, Mg, Mn, Mo, Na, Nd, Ni, P, Pb, Pr, Rb, Sb, Se, Sm, Sn, Sr, Tb, Th, Tl, U, V, Y, Yb and Zn) were carried out using inductively coupled plasma-mass spectrometry (ICP-MS) (Agilent 7700x, with HMI). Quality control/quality assurance procedures were applied during the sample preparation and analysis. Aliquots of reference material sandy loam soil (CRM030-50) from RTC (RT Corp.) were digested and analyzed along with the samples to determine recovery efficiencies of the extraction procedure. The recovery of elements was in the range of 80–110 % of the certified elemental concentrations. The continuing check verification standard solution was used to check the validity of calibration curve during the analysis. The limit of detection (LOD) values for all elements was defined as the average plus three standard deviations of the blank sample amounts.
Environ Monit Assess (2014) 186:6017–6038
Physical and chemical properties of soil In the study area, the most common soil group (67.5 %) is non-calcareous brown soils which are non-calcareous soils over non-calcareous rock or massive limestone. They are followed by colluvial soils (11.5 %), brown forest soils (7.7 %), rendzina soils (5.4 %), alluvial soils (5.2 %), red brown Mediterranean soils (1.3 %), noncalcareous brown forest soils (1.2 %) and saline–alkaline soils (0.2 %) (Eroglu and Bozyigit 2013). The pH of all soils was measured potentiometrically in a 1:2.5 soil–water suspension using a pH meter (WTW pH 720) instrument. The mean pH value was 7.8 while soil samples according to pH ranges were determined as slight acid for 2 %, neutral for 20 %, slightly alkaline for 42 %, moderately alkaline for 23 %, strongly alkaline for 5 % and very strong alkaline for 8 %. On the other hand, soil moisture content was determined by weighting sub-samples of soils before and after drying at 103 °C in an oven for 24 h, and the organic matter content was determined by loss on ignition in a muffle furnace at 600 °C for 4 h. While the average water content of soil was 3.1±1.8 % (with min. 0.8 % and max. 9.1 %), average organic matter content was 8.5±5.2 % (with min. 2.9 % and max. 30.7 %) and average clay content was 36.8±11.9 % (with min. 13.6 % and max. 61.3 %). Statistical analysis The statistical methods were applied to process the analytical data to determine its distribution and correlation among the parameters. The IBM SPSS Statistics version 21 software was used for statistical analyses of elemental concentrations in the soil samples. Basic statistical parameters such as mean, median, standard deviation, skewness and kurtosis were computed along with multivariate statistical techniques (PCA and CA). The PCA was carried out using Varimax rotation and Kaiser Normalization and the CA was applied to the standardized matrix of samples, using hierarchical clustering method. While PCA is used to describe possible sources, CA organizes a set of variables into two or more mutually exclusive unknown groups/clusters based on combination of internal variables. In addition, an interpolation method (the inverse distance weighted [IDW]) was employed using GIS mapping software (ArcGIS 10) to determine the concentration levels of trace elements in unsampled sites.
Environ Monit Assess (2014) 186:6017–6038
6021
Contamination assessment methods The enrichment factor (EF) for trace elements in soil is widely used as an index to identify their origins (crustal or anthropogenic) and to evaluate the degree of anthropogenic influences. It is calculated by Eq. 1: E F TE ¼
ðC TE =C R Þsample ðC TE =C R Þbackground
;
ð1Þ
where (CTE/CR)sample is the ratio of the concentration of the trace elements (TE) to that of reference element (R) in the soil sample, and (CTE/CR)background is the same ratio in the background soil. In this study, EF values for surface soil samples were calculated using local background soil to represent the regional geochemistry. Al was selected as the reference element since it is one of the major components of the local soil. However, different crustal elements (i.e., Ti, Sr, Fe, Mn and Na) have been used as the reference in the previous studies (Srinivasa Gowd et al. 2010; Iqbal and Shah 2011). Different classifications of EFs have been used to assess the degree of anthropogenic input to soil (Acosta et al. 2009; Gerdol et al. 2000; Varrica et al. 2000; Yuan et al. 2014). Five categories were used in the present study; deficiency to minimal enrichment (EF