Research Article
Mediterranean Marine Science Indexed in WoS (Web of Science, ISI Thomson) and SCOPUS The journal is available on line at http://www.medit-mar-sc.net DOI: http://dx.doi.org/10.12681/mms.796
Spatial distribution modelling of the endangered bivalve Pinna nobilis in a Marine Protected Area M. VÁZQUEZ-LUIS1, D. MARCH2, E. ALVAREZ3, D. ALVAREZ-BERASTEGUI4 and S. DEUDERO1 Instituto Español de Oceanografía (IEO). Centro Oceanográfico de Baleares. Muelle de Poniente s/n, 07015 Palma de Mallorca, Spain 2 Instituto Mediterráneo de Estudios Avanzados, IMEDEA (UIB-CSIC), Miquel Marqués 21, 07190 Esporles, Islas Baleares, Spain 3 Govern de les Illes Balears. Direcció General de Medi Rural i Marí. C/ Foners, 10. 07006 Palma de Mallorca, Spain 4 SOCIB- Balearic Islands Coastal Observing and Forecasting System Parc Bit, Norte, Bloc A 2ºp. pta. 3, E-07121 Palma de Mallorca, Spain 1
Corresponding author:
[email protected] Handling Editor: Stelios Katsanevakis Received: 3 February 2014 Accepted: 11 July 2014; Published on line: 26 September 2014
Abstract The spatial distribution of Pinna nobilis densities have been analysed through a geostatistical approach in the MPA of Cabrera National Park, Balearic Islands (Spain), Western Mediterranean Sea. Regression kriging was used to model the effect of environmental variables on the density of living individuals of P. nobilis and generate a predictive map of its distribution within the MPA. The environmental variables considered for the model were: depth; slope; habitat type and heterogeneity; wave exposure; and MPA zoning. A total of 378 transects were randomly distributed with a total of 149,000 m2 surveyed at a depth range from 4.2 to 46 m. The recorded P. nobilis densities are among the highest in the Mediterranean Sea. With respect to the prediction model, results indicate that benthic habitats play a key role in the spatial distribution of P. nobilis, with higher densities in seagrass meadows of Posidonia oceanica. The fan mussel population density peaked at 9 m depth, decreasing with depth. Also, decreasing densities are expected with increasing exposure to waves. The predicted map shows some hotspots of density different in size and distributed along the MPA, and provides valuable information for the spatial conservation management of this species. Keywords: Pinna nobilis, benthic mapping, regression kriging, MPAs, Mediterranean Sea, protected species, species distribution model.
Introduction Marine Protected Areas (MPAs) are aimed to conserve and preserve biodiversity and natural habitats. This spatial management tool is based on the protection of a representative set of habitat types from anthropogenic impacts and pressures that would ensure, in turn, the protection of many rare and vulnerable species and maintain genetic and/or species diversity, thus preserving the structure and function of the ecosystem (Daily et al., 2000; Libralato et al., 2010). In addition, promoting integrated coastal management that considers both MPAs and coastal resources will ensure the protection of coastal areas (Murray and Ferguson, 1998; Cho, 2005). In response to the widespread decline of marine resources worldwide, the international community is supporting increased implementation of Marine Protected Areas (Lubchenco et al., 2003). To optimise the implementation process, decision-support tools and high-quality information are needed (Roberts et al., 2003; Bellwood et al., 2004; Sale, 2008). To date, as regards terrestrial and marine conservation, species richness has most commonly been used as an estimate of biodiversity (Sarkar et al., 2005). Conservation planning initiatives have, in turn, focused on species-specific conservation cri626
teria such as representativeness, rarity or endemicity (Margules and Pressey, 2000; Roberts et al., 2003). In the Mediterranean Basin, MPAs have demonstrated their ability to provide a range of benefits (Garcia-Charton et al., 2008) and have been proposed as an appropriate approach for conservation and fisheries management (Hoffmann and Pérez-Ruzafa, 2008). The species constituting the object of conservation in MPAs include the fan mussel, Pinna nobilis (Linnaeus, 1758). This is the largest Mediterranean bivalve and one of the biggest bivalves worldwide (Zavodnik et al., 1991), living up to 28 years (García-March & Márquez-Aliaga, 2007) and found at depths ranging from 0.5 to 60 m (Butler et al., 1993). Its main habitats are soft sediments overgrown by seagrass meadows of Posidonia oceanica or Cymodocea nodosa (Zavodnik, 1967; Zavodnik et al., 1991), but also in estuarine areas without vegetation (Addis et al., 2009) and unvegetated soft bottoms of marine lakes (Katsanevakis, 2005). The population of P. nobilis has been greatly reduced throughout the Mediterranean during the past (Vicente and Moreteau, 1991) as a result of anthropogenic activities such as recreational and commercial fishing, degradation of its main habitats and incidental killing by trawlers, bottom nets or Medit. Mar. Sci., 15/3, 2014, 626-634
anchoring (Katsanevakis & Thessalou-Legaki, 2009). Nowadays, P. nobilis is protected under the EU Habitats Directive, and it is also protected by the Protocol of the Barcelona Convention, to which most Mediterranean countries are signatories, and all forms of deliberate capturing or killing of this species is prohibited (EEC, 1992). Therefore, to ensure proper development of sustainable management strategies (i.e. MPAs), it is highly necessary to increase existing knowledge on factors and processes determining the distribution of such species. How environmental conditions and population processes determine the abundance and distribution of species is a central problem of ecology and biogeography (Brown et al., 1984). Usually, variation in population density is a combination of several factors, such as spatial variables that affect the distribution of organisms. Species distribution models (SDMs) relate the effects of environment characteristics on species distribution and provide the ability to predict species distribution (Peterson et al., 2002; Crase et al., 2012). Modelling spatial distribution density of P. nobilis has been previously used as a very advantageous method for estimating the abundance of benthic fauna in the Mediterranean Sea (i.e. Lake Vouliagmeni, Korinthiakos Gulf of Greece, Katsanevakis, 2007a; Souda Bay, Crete, Katsanevakis & Thessalou-Legaki, 2009; and Tunisia, Rabaoui et al., 2010). Moreover, relationships between population density and spatial distribution or other ecologically meaningful covariates might have great biological significance and could be of more importance than simply abundance estimation (Katsanevakis, 2007a). In the present study, we include new covariates, and we apply a different method to model the effect of environmental variables on the density of living individuals of P. nobilis. Assessing essential habitats and factors affecting the spatial distribution of P. nobilis, and the conservation status of this species in a Mediterranean MPA, will guarantee its protection. Therefore, this work aimed: (i) to evaluate whether environmental variables and conservation zoning affect the density of P. nobilis; and (ii) to assess the potential spatial distribution of P. nobilis (i.e. densities) within the Cabrera National Park MPA.
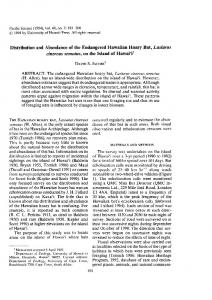
The field survey was carried out at the end of July 2011 and July 2012. Pinna nobilis individuals were sampled with strip transects. Visual censuses along transects of 30 m length and 2.5 m width (total area per transect of 75 m2) were conducted by scuba diving in order to survey the P. nobilis population density and size (as shell width) in P. oceanica seagrass meadows. A total of 239 strip transects were addressed by two divers in P. oceanica. In habitats with no seagrass coverage, such as detritic, rock or sand, strip transects of different lengths and widths were also conducted according to habitat type availability. In the deepest areas, strip transects were conducted with the help of an underwater scooter. A total of 139 strip transects were conducted in areas of no seagrass coverage. The total prospected surface accounting for all habitats was 149,000 m2. Finally, all the data gathered were expressed in individuals per 100 m2. Environmental variables Spatial models of environmental variables that were selected a priori as putative explanatory variables of P. nobilis were generated. These environmental variables included geomorphological features (depth and slope), wave exposure, benthic habitat (type and diversity), and MPA zoning (Fig. 2). Models were used at their highest resolution in order to assign a value to samples of P. nobilis. Then, all variables were rescaled for model prediction using a regular grid of 30 x 30 m in the entire study area and,
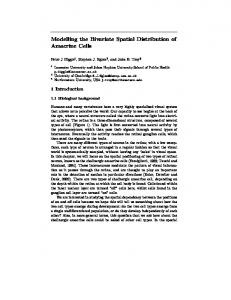
Materials and Methods Study area and data collection The study was carried out in the Cabrera National Park MPA, in the south of Majorca Island (N 9º10’50”, E 2º56’0”, Balearic Islands, NW Mediterranean, Fig. 1). The MPA was established in 1991 with an area of 100.21 km2, of which 87.03 km2 are maritime and comprises 19 small islands. Anchorage and navigation are not allowed in most places, and the low degree of human activity ensures the evolution of species in a natural and pristine environment. A total of 378 visual censuses were conducted by scuba diving to survey P. nobilis density in different habitats of the MPA (detritic, rocky, sandy and P. oceanica seagrass meadows) at depths ranging from 4 to 50 metres (Fig. 1). Medit. Mar. Sci., 15/3, 2014, 626-634
Fig. 1: Location of Cabrera National Park MPA. The points show the 378 visual transects conducted in the area and the densities found on each (ind/100m2). 627
when necessary, reprojected into the Universal Transverse Mercator coordinate system (WGS84 UTM Zone 31N). Topographic variables, benthic habitat and landscape metrics A digital bathymetric model at a resolution of 2 x 2 m was generated based on isobaths (separated each 5 m) provided by local authorities (Government of Balearic Islands, http://lifeposidonia.caib.es). Slope calculations were processed following Burrough (1986) over a raster of four square metres using ArcView 3.2 (ESRI Inc.). With respect to benthic habitat and landscape metrics, we used a recent benthic map generated with side scan sonar (SSS), aerial imagery and video observations in Cabrera National Park (Government of Balearic Islands, http://lifeposidonia.caib.es). In order to reduce the number of levels for this analysis, we reclassified the benthic map into four categories (seagrass, rocky, sandy, and detritic bottoms). We also used a landscape metric processed with patch analyst 3.1 (Rempel et al., 2012; i.e. Shannon, in order to account for habitat diversity). This metric was calculated with the percentages of each type of habitat within the area of a 100-metres radius circle (31,416 square metres) around the sampling location. Higher values indicated a higher number of habitats and evenness. This calculation was computed over a rasterised map of habitats of four square
metres. We then rasterised the map into a resolution of 30 x 30 m by assigning one benthic category per cell based on the percentage of occurrence. MPA zoning Marine Reserve boundaries were used to account for protection zoning. Four categories of MPA zoning were considered: integral reserve (IR) for areas where only research activities are allowed; moderate use (MU) where recreational diving or boating is allowed; special use (EU) for the harbouring bay, and fishery allowed (FA) for areas where professional artisanal fishery is permitted under limited regulations. Wave climate Wave exposure maps were obtained from the Balearic Islands Coastal Ocean Observing and Forecasting System (Tintore et al., 2013) (http://www.socib.es). The analysis of the wave data from the closest WANA node for the period 1996–2010 showed that, in the study area, the most energetic waves were from the SW, with an average significant wave height (Hs) of 1 m and peak period (Tp) of 6 s. These conditions were propagated to the shore using a numerical model based on the mild slope parabolic approximation (Kirby & Dalrymple, 1983). The model output provided a
Fig. 2: Environmental variables used to model P. nobilis densities. a) Slope, b) Depth, c) Habitat type, d) Wave height (Hs), e) MPA zoning: FA, fishery allowed; IR, integral reserve; EU, especial use; MU, moderate use; and f) Habitat diversity (Shannon Index). 628
Medit. Mar. Sci., 15/3, 2014, 626-634
wave field of Hs for the whole study area at a scale of 200 x 200 m grid size, which was downscaled to 30 x 30 m for model prediction using bilinear interpolation. Data analysis Regression kriging (RK) was used to model the effect of environmental variables on the density of living individuals of Pinna nobilis and generate a predictive map of its potential distribution within the MPA. RK is a geostatistical approach that combines the prediction of different kinds of regression (e.g. multiple linear, Poisson, logistic) with spatially autocorrelated error terms (Hengl et al., 2004; Fortin et al., 2012). A training dataset with the 80% of the samples (n = 303) was used for model building, whereas a holdout testing dataset with the remaining 20% of the samples (n = 75) was used for assessing model performance. A generalised linear model (GLM) was fitted to model the effect of predictor variables on P. nobilis densities using a Gaussian error distribution. In addition, quadratic forms of the depth and slope were added in order to account for possible non-linear effects, and included one interaction term between depth and wave exposure, since wave effects may vary at different depths. Continuous explanatory variables were standardised (i.e. transforming them to yield a mean of zero and standard deviation of one). Such transformation reduces collinearity effects among variables (Dormann, 2011). Multicollinearity was checked via the generalised variance inflation factor (GVIF) and the calculation of the Spearman pair-wise correlation coefficient. Homoscedasticity was examined through graphical checking using plots of residuals across categories and continuous predictors. Normality by visually inspecting residual histograms, normal quantile–quantile plots, and the Shapiro-Wilk test were tested. As normality and homoscedasticity assumptions were violated, the response variable was transformed as log(x + 1). Model selection was accomplished through information-theoretic procedures based on the Akaike information criterion (AIC). The linear term was forced into the model each time the quadratic term or the interaction term was selected in the final model (Zurell et al., 2009). Once the optimal model was achieved, the response variable across the study area was predicted using spatial models of predictor variables.
The RK approach was completed by exploring the spatial structure of the residuals by semivariography (see Figure A2 of supplementary material). Residuals were interpolated using ordinary kriging with an exponential model, and adding this autocorrelation map to the model prediction (e.g. Stelzenmüller et al., 2008). Model performance was assessed by predicting densities on the testing dataset using both the RK and the GLM models. Different metrics were calculated (Potts & Elith, 2006): Pearson’s correlation coefficient (r), Spearman’s rank correlation (rho), and Root mean square error (RMSE). Model calibration was assessed by fitting a simple linear regression between the observed and predicted values (e.g. observed = m(predicted) + b). For a perfectly calibrated model, bias (b) should be equal to zero and the spread (m) should be equal to one (Potts & Elith, 2006). The percentage of deviance explained (D2) was calculated to provide an overall measure of the success of the fitting. Strong explanatory power is indicated by a high percentage of deviance explained. All analyses were performed using the R statistical language and the raster (Hijmans & van Etten, 2010) and gstat (Pebesma, 2004) packages. Results Collected data During our surveys, a total of 1,457 living individuals of P. nobilis were recorded along 149,000 m2. P. nobilis was recorded at a depth range from 4.2 to 46 metres. 70.37% of transects were conducted in P. oceanica seagrass meadows, 14.02% on rocky bottoms, 7.94% on detritic bottoms and 7.67% on sandy bottoms. Most specimens were found in P. oceanica meadows. Total observed average density among habitats was 3.81 ind/100 m2, although average density varied across habitats (Fig. 3). In P. oceanica seagrass, mean density was 5.21 ind/100 m2 (with min=0 and maximum=37.33 ind/100 m2 at 8 m depth in Santa Maria Bay, which represents the highest density found in the MPA, Fig. 1). Density in other habitats was lower: on sandy bottoms, the average was 0.22 ind/100 m2 (0-1.38 ind/100 m2); on rocky bottoms, the average was 0.43 ind/100 m2 (0-4.17 ind/100 m2); and on detritic bottoms, the average was 0.69 ind/100 m2 (0-4.44 ind/100 m2).
Fig. 3: Density box-plot of P. nobilis surveyed in the field for habitat type. Medit. Mar. Sci., 15/3, 2014, 626-634
629
Potential spatial distribution of Pinna nobilis All predictor variables were used for model selection because they were uncorrelated (i.e. Spearman correlations < 0.4, GVIF < 2.5; see Figure A1 and Table A1 of supplementary material- electronic on line only).). Either backward or forward stepwise approaches yielded the same selected model based on the lowest AIC (Table 1). This optimal model incorporated all variables except the slope and its quadratic term. The RK approach outperformed the GLM (Table 1). Parameter estimates of the optimal model are detailed in Table 2, whereas the plots of the partial effects for the selected variables are presented in Figure 4. There were differences between RK and GLM models, with more accurate estimates for the former. The results of model performance for independent data are presented in Table 3. The prediction map illustrates a patchy or heterogeneous distribution of P. nobilis along the MPA, and highlights the presence of some hotspots within the MPA (Fig. 5). Maximum expected population density according to the model was 16 ind/100 m2. With respect to predictor variables, fan mussel population density decreased
gradually with increasing depths (Table 2 and Fig. 4a). Highest densities were predicted in P. oceanica seagrass meadows, being lower in the rest of the habitats (Table 2 and Fig. 4b). Regarding wave exposure, a general pattern was found, namely, a decrease of densities of P. nobilis with increasing exposure to waves (Table 2, and 4c). However, the interaction term of wave height with depth revealed that such pattern was attenuated with increasing depths (Fig. 4d). Based on the MPA zoning, the areas expected to have the highest abundances are the MU and IR, being lower in FA and EU (Table 2 and Fig. 4e). A significant effect of habitat diversity (Shannon index) on fan mussel density was found, with highest densities within more homogeneous areas (Table 2 and Fig. 4f). Discussion Observed field densities In the present study, a big sampling effort has been undertaken, with a total of 378 transects randomly distributed in a large surveyed area and over a wide depth range. It is important to remark, that although methods
Table 1. Akaike information criterion (AIC) of models used during the environmental covariable selection process. Increments of AIC (∆AIC) are calculated as the AIC of each model minus the AIC of model id.1, a model with no environmental covariable. Variable Selection Approach Forward
Model id
Environmental variables
AIC
∆AIC
1 2 3 4 5 6
No environmental covariable habitat habitat + wave habitat + wave + zonation habitat + wave + zonation + shanon habitat + wave + zonation + shanon + depth habitat + wave + zonation + shanon + depth + I(wave * depth) habitat + wave + zonation + shanon + depth + I(wave * depth) + I(depth2) depth + I(depth2) + slope + I(slope2) + wave + habitat + zonation + shanon + I (wave * depth) depth + I(depth2) + slope + wave + habitat + zonation + shanon + I(wave * depth) depth + I(depth2) + wave + habitat + zonation + shanon + I(wave * depth)
845.35 747.33 728.54 717.26 706.68 699.81
0.00 -98.02 -116.81 -128.09 -138.67 -145.54
693.55
-151.80
685.14
-160.21
687.83
-157.52
686.57
-158.78
685.14
-160.21
7 8 Backward
9 10 11
Table 2. Parameter estimates and p-values of the selected model. Significance codes: 0 ‘***’ 0.001 ‘**’ 0.01 ‘*’ 0.05 ‘.’ 0.1 ‘ ’ 1. Parameters Intercept depth depth2 wave habitat (rock) habitat (sand) habitat (seagrass) zonation (IR) zonation (EU) zonation (MU) shannon wave*depth 630
Estimate 0.723 -0.142 -0.139 -0.137 -0.219 -0.225 0.561 0.157 -0.398 0.489 -0.206 0.237
S.E. 0.171 0.062 0.044 0.055 0.187 0.232 0.180 0.103 0.219 0.183 0.048 0.056
Significance *** * ** *
** . ** *** *** Medit. Mar. Sci., 15/3, 2014, 626-634
accounting for imperfect detection have been developed and applied specifically for Pinna nobilis (distance sampling, mark-recapture, García-March & Vicente, 2006; Hendriks et al., 2012), we have conducted simple strip transects because of cost/benefit considerations and because the related bias was small (as the prior intercallibration transects showed). The recorded P. nobilis densities found are among the highest in the Mediterranean Sea (see Table 3 for densities overview in Rabaoui et al., 2010). The mean density among all transects is 3.81 ind/100 m2, which agrees with previous studies; being the maximum values found in P. oceanica seagrass meadows (5.21 ind/100 m2). For instance, Coppa et al.
(2010) found that dead matte substrate supported a higher population density (3.8 ind/100 m2) than P. oceanica (0.3 ind/100 m2) or sand (0.1 ind/100 m2). It is important to take into account that several studies have calculated the densities excluding zero density values and occasionally following a non-random sampling design; therefore, any comparison should be made with caution. In our case, the mean values have been calculated with all the data including zeros (which comprised 24.3% of transects). Therefore, as suggested by Coppa et al. (2010) density may be overestimated when the sampling areas with no specimens are excluded from the mean estimate or when the investigated area coincides with the patches with the
Table 3. Predictive performance of the GLM and RK models on the testing data. Metrics include Pearson’s correlation coefficient (r), Spearman’s rank correlation (rho), root-mean-squared error (RMSE), bias (b), spread (m) and percentage of deviance explained. Model glm rk
r 0.330 0.521
ρ 0.531 0.665
m 0.702 0.871
b 1.370 0.548
RMSE 4.269 3.818
Deviance explained (%) 8.106 26.502
Fig. 4: Effects of predictor variables in P. nobilis density (ind/100m2). a) Depth, b) Habitat type, c) Wave height (Hs), d) Interaction between Depth and Wave height, e) MPA zoning and f) Habitat diversity (Shannon Index). Medit. Mar. Sci., 15/3, 2014, 626-634
631
Fig. 5: Prediction map obtained by regression kriging of P. nobilis densities within the Cabrera National Park MPA. Colour scale stretches based on standard deviations (n: 4).
highest population densities (e.g. Galinou-Mitsoudi et al., 2006; Centoducati et al., 2007). Effect of predictor variables in relation to previous works Pinna nobilis in the Cabrera MPA appears in the whole study area; with highest densities mostly restricted to the shallow coastal zone, with a maximum expected density below 20 metres and progressively decreasing densities with depth. This pattern was also found in Souda Bay, since Katsanevakis & Thessalou-Legaki (2009) predicted a main density peak of P. nobilis at depths of around 15 m and practically zero in shallow (< 4 m) and deeper areas (> 30 m). In Lake Vouliagmeni, most individuals were predicted to be in the strip between the 10 and 15 m contours, with no individuals deeper than 22 m (possibly due to the high silt content of the deeper areas; Katsanevakis, 2007a). In Tunisia, Rabaoui et al. (2010) predicted a density of practically zero at 0.3 m depth, but an increasing density with depth. However, this study was conducted only at a depth of 0 to 6 metres. In view of the results of our model, wave action seems to have a negative effect on P. nobilis density in the study area. However, in the Gulf of Oristano, wave action is not a significant factor influencing the orientation of the P. nobilis shell due to its low energetic features (Coppa et al., 2013). These authors demonstrated that bottom cur632
rent direction and speed have more influence on the spatial density pattern in the study area than waves (Coppa et al., 2013). Hendriks et al. (2011) demonstrated that P. oceanica meadows provide shelter from hydrodynamic forces to P. nobilis but this facilitation is highest in shallow meadows where the smaller animals remain within the canopy. García-March et al. (2007) evidenced that selective pressures regulate population parameters, producing a trade-off between hydrodynamics, shell size and orientation, for each shore type and water depth. Regarding the interaction of wave action and depth, some studies carried out by Infantes et al. (2009) showed that waves affect the distribution of the seagrass P. oceanica until a certain depth, from which the waves cease to have an effect. In our case, the interaction among these factors makes sense up to around 23 m depth, where the effect of waves decreases with increasing depth. The positive effect from 23 m could be a consequence of the low number of transects in those depths. In future studies it will be useful to include models of bottom currents in order to have a direct measure of local hydrodynamics at the bottom. The selected model predicts the highest densities in P. oceanica seagrass meadows, being lower in the rest of the habitats considered in the model (rocky, sandy and detritic). This prediction concurs with the widely known relationship and habitat fidelity of P. nobilis for P. oceanica seagrass meadows (García-March et al., 2007; Rabaoui et al., 2010) and other vegetated habitats (Katsanevakis and Thessalou-Legaki, 2009). Accordingly, the high densities were also predicted in areas with low values of habitat diversity index, which correspond to a strong homogeneity of P. oceanica seagrass meadows. Regarding predicted densities according to MPA zonation, the model predicts the highest densities to be found in the MU and IR areas, being lower in FA and EU. With respect to different uses allowed, in MU areas activities impacting populations of P. nobilis and its habitat (as anchoring, fishing …) are not allowed; so both areas (IR and MU) seem to act as an IR not affecting P. nobilis populations. In contrast, low densities are predicted to be found in the EU and FA areas, where more intense anthropogenic activities are conducted. The EU area corresponds to the inner part of Cabrera port, which is characterised by low water renewal (Orfila et al., 2005), presence of recreational boats and the only inhabited area, being probably the most polluted part of the MPA. Moreover, in areas where fishing is permitted, this activity might directly affect the spatial distribution of P. nobilis in the MPA. In Greek areas, fishing mortality has been found to be much higher than natural mortality in adults, and it is an important driver of the spatial distribution of this species and its population viability (Katsanevakis, 2007b). It should be noted that net-fishing activity (trammel-netters and gill-netters) is not allowed from zero to 20 m depth in FA areas and, therefore, fishing driving effects might be more evident at deeper waters. Medit. Mar. Sci., 15/3, 2014, 626-634
However, comparisons of average density among areas should be made with caution because of the differences in the whole studied area, included different habitats and the number of transects per surface unit. Sources of uncertainty In this work, biological processes such as larval dispersal, density-dependent process, or interactions with predators were not taken into account. These ecological processes may be driving the spatial distribution of density hotspots of P. nobilis. Although recruitment periods have already been identified in nearby areas (CabanellasReboredo et al., 2009), information about larval dispersal using high-resolution current models would provide new insights into the connectivity and settlement areas in Cabrera. Similarly, the spatial distribution of possible predators (e.g. octopus) would be valuable information to incorporate in our model. The lack of environmental data to parameterise these variables, predation and dispersal, could be the main reason for the underestimation of density values higher than 17 ind/100 m2, which is the maximum value predicted by the model. Management application Abundance estimates and, more importantly, trends in such estimates are a prerequisite for assessing the status of the species and proposing prompt measures to ensure the viability of local populations (Katsanevakis & Thessalou-Legaki, 2009). After more than 20 years of protection and exclusion of human impacts in the Cabrera MPA, this is the first study evaluating the protected species P. nobilis. A map of the spatial distribution of P. nobilis, together with knowledge of its population ecology, provides useful information for management and monitoring of this endangered species in the MPA. Moreover, the mapping and knowledge of such species are of great interest for the spatial conservation planning. In fact, biological diversity is one of the 11 descriptors targeted by the EU Marine Strategy Framework Directive (MSFD, 2008/56/EC) to achieve Good Environmental Status (GES) by 2020. Therefore, it can be used as a baseline for sound management of the MPA and for further studies given the environmental characteristics. Acknowledgements This work was supported by research Project “Estado de conservación del bivalvo amenazado Pinna nobilis en el Parque Nacional del Archipiélago de Cabrera” (024/2010), “Organismo Autónomo de Parques Nacionales, Ministerio de Medio Ambiente y Medio Rural y Marino”. Thanks are due to the staff of Cabrera National Park for giving permission and facilities. We are very grateful to several colleagues for fieldwork assistance and to SOCIB for giving support with the computing and modelling facilities, and especially to A. Alvarez-Ellacuría for providing the wave climate models. Medit. Mar. Sci., 15/3, 2014, 626-634
References Addis, P., Secci, M., Brundu, G., Manunza, A., Corrias, S. et al., 2009. Density, size structure, shell orientation and epibiontic colonization of the fan mussel Pinna nobilis L. 1758 (Mollusca: Bivalvia) in three contrasting habitats in an estuarine area of Sardinia (W Mediterranean). Scientia Marina, 73 (1), 143-152. Bellwood, D.R., Hughes, T.P., Folke, C., Nystrom, M., 2004. Confronting the coral reef crisis. Nature, 429, 827-833. Brown, J.H., 1984. On the relationship between abundance and distribution of species. The American Nauralist, 124 (2), 255-279. Burrough, P.A., 1986. Principles of Geographical Information Systems for Land Resources Assessment. Oxford University Press, New York, p. 50. Butler, A.J., Vicente, N., De Gaulejac, B., 1993. Ecology of the pteroid bivalves Pinna bicolor Gmelin and Pinna nobilis Linnaeus. Marine Life, 3, 37-45. Cabanellas-Reboredo, M., Deudero, S., Alós, J., Valencia, J.M., March, D. et al., 2009. Recruitment of Pinna nobilis (Mollusca: Bivalvia) on artificial structures. Marine Biodiversity Records, vol. 2, p. 126. Centoducati, G., Tarsitano, E., Bottalico, A., Marvulli, M., Lai, O.R., Crescenzo, G., 2007. Monitoring of the Endangered Pinna nobilis Linné, 1758 in the Mar Grande of Taranto (Ionian Sea, Italy). Environmental Monitoring and Assessment, 131, 339-347. Cho, L., 2005. Marine protected areas: a tool for integrated coastal management in Belize. Ocean & Coastal Management, 48, 932-947. Commission of the European Communities (CEC), 2008. Directive 2008/56/ EC of the European Parliament and the Council of 17 June 2008 establishing a framework for community action in the field of marine environmental policy (Marine Strategy Framework Directive). Official Journal of the European Union 164, 19-40. Coppa, S., Guala, I., de Lucia, G.A., Massaro, G., Bressan, M., 2010. Density and distribution patterns of the endangered species Pinna nobilis within a Posidonia oceanica meadow in the Gulf of Oristano (Italy). Journal of the Marine Biological Association of the United Kingdom, 90 (5), 885-894. Coppa, S., Andrea de Lucia, G., Magni, P., Domenici, P., Antognarelli, F. et al., 2013. The effect of hydrodynamics on shell orientation and population density of Pinna nobilis in the Gulf of Oristano (Sardinia, Italy). Journal of Sea Research, 76, 201-210. Crase, B., Liedloff, A.C., Wintle, B.A., 2012. A new method for dealing with residual spatial autocorrelation in species distribution models. Ecography, 35, 1-10. Daily, G.C., Soderqvist, T., Aniyar, S., Arrow, K., Dasgupta, P. et al., 2000. The value of nature and the nature value. Science, 289, 395-396. Dormann, C.F., 2011. Modelling species’ distributions. Modelling Complex Ecological Dynamics. Springer Berlin Heidelberg, pp. 179-196. EEC, 1992. Council directive on the conservation of natural habitats and of wild fauna and flora (The habitats and species directive), 92/43/EEC. Official Journal of the European Communities No L 206/7, Brussels Council Directive. Fortin, M.J., James, P.M.A., MacKenzie, A., Melles, S.J., Rayfield, B., 2012. Spatial statistics, spatial regression, and graph theory in ecology. Spatial Statistics, 1, 100-109. 633
Galinou-Mitsoudi, S., Vlahavas, G., Papoutsi, O., 2006. Population study of the protected bivalve Pinna nobilis (Linnaeus, 1758) in Thermaikos Gulf (North Aegean Sea). Journal of Biological Research, 5, 47-53. Garcia-Charton, J.A., Perez-Ruzafa, A., Marcos, C., Claudet, J., Badalamenti, F. et al., 2008. Effectiveness of European Atlanto-Mediterranean MPAs: Do they accomplish the expected effects on populations, communities and ecosystems? Journal for Nature Conservation, 16, 193-221. García-March, J.R., Vicente, N., 2006. Protocol to study and monitor Pinna nobilis populations within marine protected areas. MedPAN-Interreg IIIC-project. García-March, J.R., Márquez-Aliaga, A., 2007. Pinna nobilis L., 1758 age determination by integral shell register. Marine Biology ,151, 1077-1085. García-March, J.R., Pérez-Rojas, L., García-Carrascosa, A.M., 2007. Influence of hydrodynamic forces on population structure of Pinna nobilis L., 1758 (Mollusca: Bivalvia): The critical combination of drag force, water depth, shell size and orientation. Journal of Experimental Marine Biology and Ecology, 342, 202-212. Hendriks, I.E., Cabanellas-Reboredo, M., Bouma, T.J., Deudero, S., Duarte, C.M., 2011. Seagrass meadows modify drag forces on the Shell of the Fan Mussel Pinna nobilis. Estuaries and Coasts, 34, 60-67. Hendriks, I.E., Deudero S., Tavecchia G. 2012. Recapture probability underwater: predicting the detection of the threatened noble pen shell in seagrass meadows. Limnology and Oceanography: Methods, 10, 824-83. Hengl, T., Heuvelink, G.B.M., Stein, A., 2004. A generic framework for spatial prediction of soil variables based on regression-kriging. Geoderma, 120, 75-93. Hijmans, R.J., van Etten, J., 2010. raster: Geographic analysis and modelling with raster data. R package version 1, r948. Hoffmann, E., Pérez-Ruzafa, A., 2008. Marine Protected Areas as a tool for fishery management and ecosystem conservation: an Introduction. ICES Journal of Marine Science, 66, 1-5. Infantes, E., Terrados, J., Orfila, A., Cañellas, B., Álvarez-Ellacuria, A., 2009. Wave energy and the upper depth limit distribution of Posidonia oceanica. Botanica Marina, 52, 419-427. Katsanevakis, S., 2005. Population ecology of the endangered fan mussel Pinna nobilis in a marine lake. Endangered Species Research, 1, 1-9. Katsanevakis, S., 2007a. Density surface modelling with line transect sampling as a tool for abundance estimation of marine benthic species: the Pinna nobilis example in a marine lake. Marine Biology, 152, 77-85. Katsanevakis S, 2007b. Growth and mortality rates of the fan mussel Pinna nobilis in Lake Vouliagmeni (Korinthiakos Gulf, Greece): a generalized additive modelling approach. Marine Biology, 152,1319-1331. Katsanevakis, S., Thessalou-Legaki, M., 2009. Spatial distribution, abundance and habitat use of the protected fan mussel Pinna nobilis in Souda Bay, Crete. Aquatic Biology, 8, 45-54. Kirby, J.T., Dalrymple, R.A., 1983. The propagation of weakly nonlinear waves in the presence of varying depth and currents. Proc. XXth Congress I.A.H.R., Moscow. Libralato, S., Coll, M., Tempesta, M., Santojanni, A., Spoto, M. et al., 2010. Food-web traits of protected and exploited areas of the Adriatic Sea. Biological Conservation 143, 2182-2194. Lubchenco, J., Palumbi, S.R., Gaines, S.D., Andelman, S., 2003. Plugging a hole in the ocean: The emerging science of marine 634
reserves. Ecological Applications, 13, 3-7. Margules, C. R., Pressey, R.L., 2000. Systematic conservation planning. Nature, 405, 243-253. Murray, M., Ferguson, L., 1998. The status of Marine Protected Areas in Puget Sound. Volumes I and II. Puget Sound-Georgia Basin Environmental Report Series, No, 8. Seattle, Washington. Orfila, A., Jordi, J., Basterretxea, G., Vizoso, G., Marbà, N. et al., 2005. Residence time and Posidonia oceanica in Cabrera Archipelago National Park, Spain. Continental Shelf Research, 25, 1339-1352. Pebesma, E.J., 2004. Multivariable geostatistics in S: the gstat package. Computers & Geosciences, 30, 683-691. Peterson, A.T., Ortega-Huerta, M.A., Bartley, J., Sanchez-Cordero, V., Soberon, J., et al., 2002. Future projections for Mexican faunas under global climate change scenarios. Nature, 416, 626-629. Potts, J.M., Elith, J., 2006. Comparing species abundance models. Ecological Modelling, 199, 153-163. Rabaoui, L., Tlig-Zouari, S., Katsanevakis, S., Ben Hassine, O.K., 2010. Modelling population density of Pinna nobilis (Bivalvia) on the eastern and southertern coast of Tunisia. Journal of Molluscan Studies, 76, 340-347. Rempel, R.S., Kaukinen., D., Carr, A.P., 2012. Patch Analyst and Patch Grid. Ontario Ministry of Natural Resources. Centre for Northern Forest Ecosystem Research, Thunder Bay, Ontario. Roberts, C.M., Branch, G., Bustamante, R.H., Castilla, J.C., Dugan, J. et al., 2003. Application of ecological criteria in selecting marine reserves and developing reserve networks. Ecological Applications, 13, S215-S228. Sale, P.F., 2008. Management of coral reefs: where we have gone wrong and what we can do about it. Marine Pollution Bulletin, 56, 805-809. Sarkar, S., Justus, J., Fuller, T., Kelley, C., Garson, J. et al., 2005. Effectiveness of environmental surrogates for the selection of conservation area networks. Conservation Biology, 19, 815-825. Stelzenmüller, V., Maynou, F., Bernard, G., Cadiou, G., Camilleri, M. et al., 2008. Spatial assessment of fishing effort around European marine reserves: Implications for successful fisheries management. Marine Pollution Bulletin, 56, 2018-2026. Tintore, J., Vizoso, G., Casas, B., Heslop, E., Pascual, A. et al., 2013. SOCIB: The Balearic Islands Coastal Ocean Observing and Forecasting System, Responding to Science, Technology and Society Needs. Marine Technology Society Journal, 47. Vicente, N., Moreteau, J.C., 1991. Statust of Pinna nobilis L. en Méditerranée (Mollusque Eulamellibranche). In: Les Espèces Marines à Protèger en Méditerranée. Boudouresque, C.F., Avon, M., Garvez, M., (Eds). GIS Posidonie Publ, pp. 159-168. Zavodnik, D., 1967. Contribution to the ecology of Pinna nobilis L. (Mollusca: Bivalvia) in the Northern Adriatic Sea. Thalassia Jugoslavica, 3, 93-102. Zavodnik, D., Hrs-Brenko, M., Legac, M., 1991. Synopsis of the fan shell Pinna nobilis L. in the eastern Adriatic Sea. In: Les Espèces Marines à Protéger en Méditerranée. Boudouresque C.F. Avon M. and Gravez V. (Eds). GIS Posidonie Publ. Marseille, 169-178. Zurell, D., Jeltsch, F., Dormann, C.F., Schröder, B., 2009. Static species distribution models in dynamically changing systems: how good can predictions really be? Ecography, 32, 733-744. Medit. Mar. Sci., 15/3, 2014, 626-634
Supplementary Data Spatial distribution modelling of the endangered bivalve Pinna nobilis in a Marine Protected Area M. VÁZQUEZ-LUIS1, D. MARCH2, E. ALVAREZ3, D. ALVAREZ-BERASTEGUI4 and S. DEUDERO1 Mediterranean Marine Science, 2014, 15 (3), 626-634.
Suppl. Figure A1. Hierarchical cluster on exploratory variables using squared Spearman correlation (ρ2). Suppl. Table A1. Generalised variance inflation factor (GVIF) values for the variables of the optimal model. Parameters depth I(depth2) wave habitat zonation shannon I(wave*depth)
GVIF 2.132 2.463 1.688 1.979 1.725 1.324 1.985
Suppl. Figure A2. Empirical semivariogram computed for the residuals from the GLM. Distance in metres. Medit. Mar. Sci., suppl.data, 15/3, 2014
1