Article
Spatial Heterogeneity in Tree Diversity and Forest Structure of Evergreen Broadleaf Forests in Southern China along an Altitudinal Gradient Wei Cui and Xiao-Xian Zheng * Ministry of Education Key Laboratory for Silviculture and Conservation, College of Forestry, Beijing Forestry University, Beijing 100083, China;
[email protected] * Correspondence:
[email protected]; Tel./Fax: +86-10-6233-8133 Academic Editors: Brian J. Palik and Timothy A. Martin Received: 14 July 2016; Accepted: 21 September 2016; Published: 30 September 2016
Abstract: We studied the influence of altitude on the spatial heterogeneity of tree diversity and forest structure in a subtropical evergreen broadleaf forest in southern China. Significant positive correlation was found between tree species diversity, basal area and altitude, but negative correlation between slenderness of trunks and altitude. According to topography, tree species diversity, diameter at breast height, height and basal area increased from ridges to valleys, while slenderness and stem density did not differ significantly with topography. Redundancy analysis (RDA) was employed to clarify relationships between tree species diversity and environmental factors (topography and soil water holding capacity). Topography and water conditions jointly explained 57.8% of the diversity variation. Tree species diversity was significantly correlated with altitude, slope and bulk density (Monte Carlo permutation test with 999 permutations, p < 0.05). A positive relationship existed between altitude, soil non-capillary porosity and diversity, while slope, aspect and soil water content were the opposite. Our results show that soil water holding capacity has a positive effect on maintaining species diversity. When comparing with topographic factors—the main driving forces affecting the pattern of tree species diversity—the effect of soil water holding capacity was weak. Keywords: subtropical evergreen broadleaf forest; tree species diversity; topography; water holding capacity; redundancy analysis
1. Introduction Plant species diversity along altitudinal and environmental gradients has long been the focus of attention of ecologists [1–4]. Different patterns of plant species diversity variation with altitude have been recorded: (I) a decline in diversity with increased altitude [5]; (II) an increase in diversity with increasing altitude [6]; (III) a hump in diversity at mid-altitude [7,8]; (iv) a dip in diversity at mid-altitude [9]; (v) no relationship with altitude [10]. At a local scale, previous studies looking at altitude variation have focused on total trend of plant diversity patterns without considering different types of forest. Despite being a key source of the world’s biodiversity and sustainable development [11], there is little research on tree species diversity patterns and factors that impact on subtropical evergreen broadleaf forest. Studies of tree species-environment associations in forests are often based on topography and water conditions [12]. Topographic variations bring changes in soil fertility and distribution of forest types and tree species are limited by soil conditions [13–16]. Compared with topography, water conditions are also an important factor influencing tree species diversity. At relatively large spatial scales, the relationship between water conditions and diversity is primarily influenced by climate, especially temperature and precipitation [17]. At local scale, previous studies mainly focus on water
Forests 2016, 7, 216; doi:10.3390/f7100216
www.mdpi.com/journal/forests
Forests 2016, 7, 216
2 of 12
Forests 2016, 7, 216
2 of 12
availability for plants [18], however the water holding capacity is non-negligible. Soil water holding availability for plants [18], however the water holding capacity is non‐negligible. Soil water holding capacity has been long discussed and has well known effects on the distribution of plant species [19]. capacity has been long discussed and has well known effects on the distribution of plant species [19]. Former studies mostly focus on the forests with seasonal changes in water status and suggest that Former studies mostly focus on the forests with seasonal changes in water status and suggest that soilsoil water condition is likely to determine the species coexistence. However, how the water‐diversity water condition is likely to determine the species coexistence. However, how the water-diversity association changes across plant communities ambiguous [20]. [20]. The Theclassical classicalhabitat habitat control association changes across plant communities isis still still ambiguous control model suggests that species assemblage is determined by variation in environmental conditions, but model suggests that species assemblage is determined by variation in environmental conditions, but which factor is theis dominant component remains obscure [21]. Whether topographic or water which factor the dominant component remains obscure [21]. Whether topographic or gradients water gradients are the main driving force of variations in diversity is still been discussed in relation to local are the main driving force of variations in diversity is still been discussed in relation to local habitats. habitats. As a hotspot of the subtropical evergreen broadleaf forests in southern China, forests in Jiangle As a hotspot of the subtropical evergreen broadleaf forests in southern China, forests in Jiangle region, Sanming City, Fujian province present an ideal location to test the altitudinal patterns of tree region, Sanming City, Fujian province present an ideal location to test the altitudinal patterns of tree species diversity and their relation to environmental gradients [22,23]. To identify possible causes species diversity and their relation to environmental gradients [22,23]. To identify possible causes of of the spatial heterogeneity of tree species diversity and stand structure, an array of plots with an the spatial heterogeneity of tree species diversity and stand structure, an array of plots with an altitudinal gradient of 900 m were set within a homogeneous evergreen broadleaf forest. The aims of altitudinal gradient of 900 m were set within a homogeneous evergreen broadleaf forest. The aims of the study were: (1) to quantify changes in tree species diversity and stand structure along altitudinal the study were: (1) to quantify changes in tree species diversity and stand structure along altitudinal gradients; (2) analyze interrelations between tree diversity and environmental factors; and (3) clarify gradients, (2) analyze interrelations between tree diversity and environmental factors, and (3) clarify the main factors influencing tree species diversity. the main factors influencing tree species diversity.
2. Materials and Methods
2. Materials and Methods
2.1. Study Site
2.1. Study Site
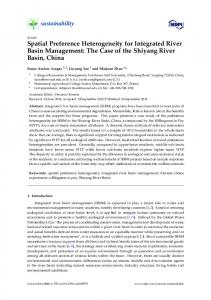
This study was conducted in Jiangle County, Sanming City, Fujian province, China on the This study was conducted in Jiangle County, Sanming City, Fujian province, China on the southeast slope of the Cordillera Wuyi, covering a 16◦ latitudinal range and an altitude range from 230 southeast slope of the Cordillera Wuyi, covering a 16° latitudinal range and an altitude range from to 1190 m. Two sites at different altitudes and covered by well-conserved subtropical evergreen 230 to 1190 m. Two sites at different altitudes and covered by well‐conserved subtropical evergreen broadleaf forest were chosen for plotting (Figure 1). One site, over 500 m above sea level (a.s.l.), broadleaf forest were chosen for plotting (Figure 1). One site, over 500 m above sea level (a.s.l.), is is located (LQS), and andthe theother, other,below below500 500m ma.s.l., a.s.l.,at atGuangming Guangming located atat Longqishan Longqishan Nature Nature Reserve Reserve (LQS), township, 46 km to the northeast of the reserve. There are two dominant types of soils in the region, township, 46 km to the northeast of the reserve. There are two dominant types of soils in the region, which developed on top of igneous rocks including granite, quartzite and metamorphic rocks, with which developed on top of igneous rocks including granite, quartzite and metamorphic rocks, with red red soil at high altitudes and yellow soil in low mountains. The area is dominated by mid‐to‐low soil at high altitudes and yellow soil in low mountains. The area is dominated by mid-to-low mountains predominantly covered by evergreen broadleaf forest. The main part of the study site was mountains predominantly covered by evergreen broadleaf forest. The main part of the study site waslocated on steep slopes (20°–40°). Mean annual temperature is 14.6–18.8 °C in Guangming and below located on steep slopes (20◦ –40◦ ). Mean annual temperature is 14.6–18.8 ◦ C in Guangming and 14 °C in the reserve; mean annual precipitation is 1797 mm (range 799–1859 mm, data from Jiangle below 14 ◦ C in the reserve; mean annual precipitation is 1797 mm (range 799–1859 mm, data from County meteorological station, observed from 1943 to 2005). Jiangle County meteorological station, observed from 1943 to 2005).
Figure 1. Location of study area and sampling sites. Figure 1. Location of study area and sampling sites.
Forests 2016, 7, 216
3 of 12
The target evergreen broadleaf forest is mainly distributed under 1200 m a.s.l., with broadleaf deciduous and mixed forest at 1100–1300 m a.s.l. There is no significant pattern of changes in tree composition along the altitudinal gradient. However, we limited the study of environmental control to the effect of topography on the distribution of tree species diversity and forest structure and in this case a significant difference was observed. Two dominant types of forest were distinguished for the study site. Type A is mainly distributed in ridges with trees rarely reaching a height of 15 m. The shrub and herb layers of this forest were well developed. The most speciose tree taxa are Castanopsis spp. (Fagaceae), Castanea spp. (Fagaceae), Alniphyllum spp. (Styracaceae) and Schima spp. (Theaceae). Compared with type A, type B is mainly located in valleys with higher canopy density, but few herbs and shrubs under the canopy. It is dominated by Ilex spp. (Aquifoliaceae), Elaeocarpus spp. (Elaeocarpaceae) and Cyclobalanopsis spp. (Fagaceae). The two forest types were classified to be a comprehensive effect of topography on species diversity and forest structure. 2.2. Study Design and Sample Collection The distribution of evergreen broadleaf forest was on average between 400 and 600 m a.s.l. with an upper limit of 1200 m a.s.l. [24]. To investigate altitudinal alternation in composition and richness of trees species and forest structure, 20 permanent plots (total area 1.2 ha), each with a size of 600 m2 , were established at 230–1190 m a.s.l., of which 13 plots (altitude > 500 m a.s.l.) were set in LQS and the other 7 plots (altitude ≤ 500m a.s.l.) were set in Guangming. All plots were set within homogenous forest, representative of vegetation for the corresponding altitude. No obviously recent disturbances by either humans or nature are recorded. Plots were located in structurally homogeneous patches, in contrast with the overall heterogeneous environment. Forest structure and capacity of water holding capacity were measured in all plots. Tree Diversity, Stand Structure and Environmental Variables The species of all individual tree was identified along with diameter at breast height (dbh, ≥5 cm) and tree height (m) were measured in each plot. The altitude was measured in the centre of each plot (the span in altitude between the highest and lowest plots was 920 m). To determine how specific topographic factors influence tree species, another two micro-topographic parameters were measured: slope, and aspect. Aspect was transformed using A0 = cos ( Amax − A) + 1, where A = transformed aspect, where Amax = 45◦ and A = measured aspect [25]. In each permanent plot, three soil profiles were randomly set to test soil water holding capacity. Five soil samples were collected using the cutting ring method within each profile at a depth of up to 80 cm: two top soil layers each with 10 cm thick and the remaining three were layers of 20 cm respectively. Bulk density, non-capillary porosity and water content were tested [26–28]. 3. Data Analysis The least-square method was used for correlation analysis, with a significance threshold of p < 0.05. Three parameters were adopted to describe stand structure [29]: basal area (m2 /ha), stem density (stems/ha) for dbh ≥ 5cm, and slenderness—the ratio of mean height to dbh (with both height and dbh measured in metres). Five parameters were chosen to describe the variation of species diversity [30]: species richness (S) was represented by the number of species in the plot after individual-based rarefaction [31], the rarefied number of species (RS) was on the basis of 59 individuals, which was the smallest number among the 20 permanent plots and was assigned as the standard number for rarefaction. The Shannon diversity index (H 0 ) using the formula H 0 = − ∑ ( pi ln pi ), where pi is the relative abundance of the i-th species, was used to represent species diversity [32]. The Shannon evenness index (E) was derived using the formula E = H 0 /ln S, where H 0 is the Shannon diversity index and S is the maximum diversity [33]. The Sorenson similarity index (Cs ) CS = 2j/( a + b), where a and b are the number of species in each of the plots in comparison and j is the number of species common to both plots, was drawn for each pair of plots within and between forest types. The
Forests 2016, 7, 216 Forests 2016, 7, 216
4 of 12 4 of 12
relationship between tree speciesbetween diversity,tree forest structure and altitude was examined separately forest types. The relationship species diversity, forest structure and altitude was in ourexamined study. To separately compare the relationship of stand structure and diversity between forest types A and B, in our study. To compare the relationship of stand structure and diversity a t-test was applied after the test of Gaussian distribution. between forest types A and B, a t‐test was applied after the test of Gaussian distribution. Redundancy analysis (RDA) was applied to quantify and test the effects of environmental factors Redundancy analysis (RDA) was applied to quantify and test the effects of environmental factors (topography and soil water holding capacity) on tree diversity. Partial RDA was alsowas performed (topography and soil water holding capacity) on species tree species diversity. Partial RDA also performed extract the variation in diversity tree species diversity by explained the oftwo sets of to extract the to variation in tree species explained each of by theeach twoof sets explanatory explanatory variables and shared by the two data sets [34]. Explanatory variables were standardized variables and shared by the two data sets [34]. Explanatory variables were standardized before before analysis, and data diversity were transformed prior to using analysis using log transformations analysis, and diversity weredata transformed prior to analysis log transformations which were which were not normally distributed. The whole process was operated using the VEGAN statistical not normally distributed. The whole process was operated using the VEGAN statistical package of Rpackage of R 3.2.5 [35]. 3.2.5 [35]. 4. 4. Results Results 4.1.4.1. Tree Diversity and Stand Structure as a Function of Altitude Tree Diversity and Stand Structure as a Function of Altitude In In the 20 permanent plots, 2255 stems (dbh ≥ 5 cm) were found in total belonging to 102 species the 20 permanent plots, 2255 stems (dbh ≥ 5 cm) were found in total belonging to 102 and 47 families. The dominant family was Fagaceae (16 species) and Lauraceae (13 species). Both the species and 47 families. The dominant family was Fagaceae (16 species) and Lauraceae (13 species). observed (from 15 to 29) and rarefied (from 12 to 21) species richness increased with altitude (Figure Both the observed (from 15 to 29) and rarefied (from 12 to 21) species richness increased with altitude 2a), and the slope of the rarefied fitted line was steeper because of the higher stem density in the plots (Figure 2a), and the slope of the rarefied fitted line was steeper because of the higher stem density in at higher altitude. the plots at higher altitude.
Figure 2. Tree diversity and structural parameters as a function of altitude. Correlations are significant Figure 2. Tree diversity and structural parameters as a function of altitude. Correlations are significant (p slope (19.53%). The water holding capacity data also showed a high degree of variation and was ranked as follows: soil non-capillary porosity (60.90%) > soil water content (52.71%) > bulk density (8.99%). 4.4. Redundancy Analysis of Topography and Water on Species Diversity RDA applied to tree species diversity constrained by topographic data was performed to quantify the effects of topography on variation in tree species diversity. The eigenvalues of the first and second constrained axes were 0.498 and 0.037 respectively, and axis 1 explained most of the variation in species
Forests 2016, 7, 216
6 of 12
4.4. Redundancy Analysis of Topography and Water on Species Diversity Forests 2016, 7, 216
6 of 12
RDA applied to tree species diversity constrained by topographic data was performed to quantify the effects of topography on variation in tree species diversity. The eigenvalues of the first and second constrained were 0.498 and 0.037 respectively, and axis diversity 1 explained most of the diversity. Integration of allaxes topography data explained 53.5% of species variation (Monte variation in species diversity. Integration of all topography data explained 53.5% of species diversity Carlo permutation test with 999 permutations, p = 0.001). As a key element of topography, altitude variation (Monte Carlo permutation 999 permutations, = 0.001). As community a key element of alone explained 27.7% of the variance intest thewith functional diversity of p soil microbial (Monte topography, altitude alone explained 27.7% of the variance in the functional diversity of soil microbial Carlo permutation test with 999 permutations, p = 0.001). community (Monte Carlo permutation test with 999 permutations, p = 0.001). Tree species diversity constrained by water holding capacity was also tested using RDA. Tree species diversity constrained by water holding capacity was also tested using RDA. The The eigenvalues of the first and second constrained axes were 0.263 and 0.003, respectively. eigenvalues of the first and second constrained axes were 0.263 and 0.003, respectively. The The combination of all water holding capacity variables explained 26.6% of the variance in species combination of all water holding capacity variables explained 26.6% of the variance in species diversity (Monte Carlo permutation test with 999 permutations, p = 0.018). The most significant diversity (Monte Carlo permutation test with 999 permutations, p = 0.018). The most significant variation was bulk density, which explained 10.7% of species diversity variation (Monte Carlo variation was bulk density, which explained 10.7% of species diversity variation (Monte Carlo permutation test with 999 permutations, p < 0.05). permutation test with 999 permutations, p