(Relational Data Base Management Systems) and GIS ... management or, by Electronic Document Management ..... The key features of our proposal are:.
> PAPER IDENTIFICATION NUMBER: 246
PAPER IDENTIFICATION NUMBER: 246 < presented in sections four and five.
II. SPATIAL INFORMATION MANAGEMENT WITHIN HETEROGENEOUS DOCUMENTS COLLECTIONS Information Extraction (IE) generally organizes indexes for a better support Information Retrieval (IR). IE and IR used together have the potential to create powerful new tools in information processing [16] [18]. This section describes IE, IR and Information Visualization (IV) approaches which are combined for specific geographic requirements. A. Information Extraction IE may be described as the activity of populating a structured information repository from an unstructured information source [16]. In a collection of documents, the result of IE constitutes what is called an index. It is generally made of a list of terms linked to each document [28]. These terms have to describe as precisely as possible the contents of the documents. Automatic IE processes extract either the whole information of a document or, specific parts of it. For example, in the first case, textual processes generally use statistical approaches (each term of a document is treated) [5] [28] to associate a weight to each term while, in the second one, they use predefined rules in order to find out specific information [16]. B. Information Retrieval Information Retrieval (IR) deals with models, techniques, procedures to extract information that has already been treated, organized and stored (databases, files, XML files, etc.). [3] explains that satisfying user information requirements is not trivial: “The user first specifies a user need which is then parsed and transformed. Then, query operations might be applied before the actual query, which provides a system representation for the user need, is generated. The query is then processed to obtain the retrieved documents. Fast query processing is made possible by the index structure previously built.”. [3] and [43] note the importance of the query validation and/or reformulation stages to improve the interpretation of the user need. C. Information Retrieval The retrieval of search engine results is a recurring problem because it is important for the user to make use of and to efficiently visualize the retrieved information [13]. We want to pinpoint that the restitution step is always coupled with a calculation and a representation step of the information relevance (according to relevance calculation methods, restored information can differ for the same need expressed). Here is a summary of the different retrieval modes that pinpoints the four most used approaches: 1) List representation: A list presents a collection of elements organized according to a relevance mode defined by the list manager. It is a representation method used by most
2
search engines like Google 2 or Grokker 3 . [38] present a taxonomy for the information visualization strategies relying on techniques adapted to large size lists (e.g. the perspective wall technique of Mackinlay [42]). The relevance of an element is represented by its position in the list. Lists allow to present indefinite result numbers and also provide a simple access mode to the items. However, they do not offer a synthetic overview of the results and the browsing is often limited to the first results [41] [13]. 2) Topic representation: A topic gathers the elements around same concept. The Ujiko 4 or Kartoo 5 search engines use this type of representation. [40] showed that, in comparison with a non-hierarchical classification, such a classification could give better performances in terms of user satisfaction. This representation offers a synthetic overview but choosing the topics to be represented is subjective and difficult to computerize. The relevance is not explicitly represented because it depends on the matching degree between the presented topics and the user requirements. 3) Graph or Tree representation: It is close to topic classification but it integrates the semantics carried by the edges connecting the vertices (which topics or documents can represent). The Kartoo search engine or topic maps [26] with tools such as TM4J 6 use this form of representation. The semantic links between concepts allow guided navigation between topics and documents. However, there are two limits to the number of concepts that can be represented: the size of the display for results presentation and the risk of cognitive overload for the user. As for topic representation, the relevance is not explicitly represented, it depends on the matching between the user requirements and the suggested thematic browsing links. 4) Cartographic representation: The principle consists of representing a space (area, country, building, room, device layout) and associating the data elements related to various points highlighted on this space. An example of geographical application is SPIRIT - Spatially-Aware Information Retrieval one the Internet 7 - which proposes a search engine whose results are Web pages geolocalized on a map. With this approach, the user reads the map looking for spatial reference marks; the relevance is thus spatially represented by the closeness of results with a spatial reference point of interest for the user. This form of representation integrates the space dimension but raises problems when the results are geolocalized on very close places, or on the same place. 5) 2D-3D representation: A particular case of visualization modes deals with element representation in two or three dimensions. All the previous representation modes can be modeled either in 2D or 3D. 3D representations are frequent when the amount of documents is significant [39]. The choice 2
www.google.com www.grokker.com www.ujiko.com 5 www.kartoo.com 6 http://tm4j.org 7 www.geo-spirit.org 3 4
> PAPER IDENTIFICATION NUMBER: 246 < of a 3D representation is justified by the need to increase the visualization space [36] [37]. However, the third dimension entails a more complex navigation. Geographic contents management within heterogeneous documents collections is the main purpose of the paper. Here are linguists’ and GISs’ (Geographic Information Systems) approaches of spatial information management. D. Spatial Information 1) Linguists’ works: They explain our specific manner of representing spatial information in written language. According to [7], we can link a place to a category and associate it with a natural or with an artificial boundary. We consider three main categories: land parcels, expanses of water, dwelling places. Referring to such places involves several elements. In written language, one might define spatial information by referring to a better known position. We thus understand sentence 1 perfectly while sentence 2 seems to be unusual to us: - sentence 1: “the car is near the house” - sentence 2: “the house is near the car” [30] studied this assumption for textual documents and explained the concept of target/site couple. Our objective is to extend this hypothesis to any other expression modes. 2) GIS works: They present a Geographic Feature (GF) as a user-defined geographic phenomenon that can be modeled or represented using geographic data sets. Examples of geographic features include streets, sewer lines, manhole covers, accidents, lot lines, parcels 8 . Important related works address models of spatial relations [9], qualitative spatial representation and reasoning [10] [11] [27] and spatial queries processing [9]. Other interesting works [22] [21] concern digital gazetteers (Alexandria Digital Library 9 ) which can be defined as geo-spatial [2] and support important related dictionaries of geographic names. GIS literature mainly represents a geographic feature by its name and its location. The location covers many facets: - topographical coordinates, with geometric possibilities (the point or the polygon coordinates to locate the building on a map); - topological, direction or metric relations with other GFs (a direction relation to detail the position of the building within the village) [13] [12] [19]; - conceptual links with topics of spatial theory within a specific ontology [11] [20]. As IE, IR and IV approaches are rather generic, spatial information accurate management is yet a great challenge. Moreover, Library Management Systems can neither take into account the geographic semantics of heterogeneous documents, nor the users’ specific geographic requirements. Semantics processing seems to be an interesting way of spatial information management within IE, IR and IV.
E. Semantics Processing It allows specific information extraction; i.e., exploiting the localized property of a corpus in order to focus on the spatial information. In textual expression mode, data processing sequence used for highlighting spatial markers is composed of four main steps [1]: - lemmatization carries out a segmentation of the words; - lexical and morphological analysis proceeds to a word recognition; - syntactic analysis, based on grammars, allows to find the bonds between words; - “semantic” analysis carries out a more specific analysis allowing the extracted syntagms to be interpreted. Some systems like Brill 10 , Cordial 11 or Tree-Tagger 12 morphosyntactical analysers are dedicated to a specific part of such sub-processes. Other systems like Linguastream 13 [31], SPIRIT 14 or GATE 15 [17] [16] support the whole process. In graphic expression mode, semantic processes consider that an image is not represented in single pixels but in meaningful image segments and their mutual relations. [29] and [14] propose semantics definition to represent spatial data. [4] presents fuzzy methods implementing expert spatial knowledge and describes a workflow from remote sensing imagery to GIS. eCognition system provides a new technology for image analysis 16 .
III. A GEOGRAPHIC UNIFIED MODEL According to the linguistic hypothesis, a GF is recursively defined from one or several other GFs and spatial relations are part of the GFs’ definition. The target/site principle [30] can approximately but reasonably be defined in a recursive way.
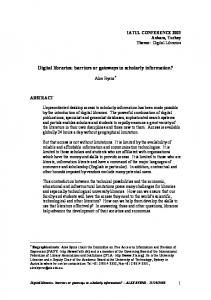
Fig. 1. “North of the Biarritz-Pau line” GF.
For instance, the GF “north of the Biarritz-Pau line” (graphically and textually expressed in Fig. 1): - is first defined by sites “Biarritz” and “Pau” that are well known named districts, - then, term “line” creates a geometrical object linking the two sites and cutting the space into two sub-spaces, - finally, an orientation relation (“North”) creates a reference on the target to focus. In Fig. 2 it appears that a GF has at least one representation 10
www.cs.jhu.edu/brill/ www.synapse.com 12 www.ims.uni-stuttgart.de/projekte/corplex/TreeTagger/ 13 www.linguastream.org 14 www.spiritengine.com 15 http://gate.ac.uk/ 16 www.pcigeomatics.com/products/definiens.html 11
8 9
www.webgis.net/cms.php/glossary.htm www.alexandria.ucsb.edu; www.alexandria.ucsb.edu/gazetteer/
3
> PAPER IDENTIFICATION NUMBER: 246
AGF | RGF. RGF => relation, GF. relation => adjacency | orientation | inclusion | distance | geometrical form. adjacency => ‘‘near’’ | ‘‘periphery’’ | etc. orientation => ‘‘in the south’’ | ‘‘in the north’’ | etc. ... AGF => preposition, candidate. A. GFs' Spatial Relations A GF spatial relation could be an adjacency, an inclusion, a distance, a geometric form or an orientation: - Adjacency relation appears when we evoke a GF by proximity with another GF. This spatial reference is the most widespread in the written language (example: “near Laruns village” is a RGF whereas “Laruns village” is an AGF). - Orientation relation appears when we refer to a zone while being directed according to the 4 cardinal points. - Distance appears when we locate a GF by evoking its distance from another GF. Then, we can model the value of this distance and its unit. - Inclusion relation appears when we evoke the inclusion of a GF in another area. - Geometric form appears when we need to evoke several GFs to define an unnamed feature with a simple and familiar shape: i.e. “The Biarritz-Pau line”. In the unified model all these spatial references have attributes to characterize them [6]. So, a XML tree (cf. PIV system indexes [6]) complying with Fig. 3 XML schema describes any GF.
Fig. 3. Extract of the unified model XML schema (French version).
B. GFs’ Spatial Representations GFs representations rely on their relations description in the Geographic Unified Model as well as on external gazetteers. GFs representation is a set of given or computed geocoded data. 1) AGF representations: If we consider the different levels of granularity and precision, the geometrical shape corresponding to the area of an AGF can change. These representations can be built from points (a church for example), polylines (a road), polygons, multi-polygons (a city), etc. We use external gazetteers services to geo-localize AGFs and to compute their geometric shapes. For instance, a district AGF may be represented with at least the geocode localizing its name, others representations could be its 2D geometrical boundary or its 3D numerical shape and/or its Minimum Bounding Rectangle (MBR) computed from one of the previous representations (Fig. 4).
Fig. 4. Laruns village representations.
For geometrical transformations and topological operations [9] has shown that MBR approach is a quite effective approximation of the objects’ shape. 2) RGF representations: A representation of a RGF like “à l’Est de Laruns” (“in the East of Laruns village”) is computed by the recursive algorithm (Fig. 5) developed for this task [6] [24]. It consists in carrying out recursively geometrical transformations on an AGF thanks to some qualitative spatial reasoning mechanisms.
> PAPER IDENTIFICATION NUMBER: 246
PAPER IDENTIFICATION NUMBER: 246 < the query.
-
Fig. 8. Example of a query and some indexed Pyrenean villages and roads
Fig. 8 shows that indexed documents’ RGFs are represented by MBRs whereas AGFs are represented by more precise geometrics shapes. We are therefore able to calculate the relevance of documents by simply crossing index files and computing GFs representations intersecting surface rates. eXist XML DBMS 17 supports indexes management and relevant documents content access.
V. GEOGRAPHIC CONTENT-BASED INFORMATION VISUALIZATION The visualization of territorial information is taken into account on two levels within the PIV prototype: on the one hand, that of graphical interpretation of the user request and, on the other hand, that of result presentation. Like in SPIRIT, we chose a cartographic visualization mode which allows taking into account the territorial specificity of our documents.
6
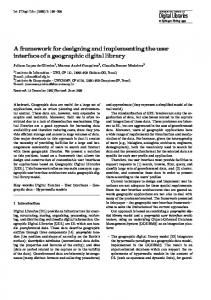
interpretation of these needs by the system, the output representation given to the user and the possible refinement processes. These ones aim at bringing the real needs of the user closer to the ones interpreted by the system. the interactions allowing to exploit the information contents retrieved by the system (Fig. 9 - B). The interactions then relate to: the manner of presenting output, the possibilities offered to the user to browse/explore the restituted informative contents, the way of enhancing the location of the user during his navigation, and the various ways of reading/consulting the same informative contents.
B. Visual Representation of Territorialized Information Our contribution focuses on the visualization of territorial information in the interactions dealing with “requirements expression” and representation of results (Fig. 9 - C). We present how we integrate the geographic characteristics of our corpus in the interpretation phases of the user request and in the phase of result restitution. 1) Graphic interpretation and refinement of the request: In this stage, the system interprets requirements expressed in text form by the user in order to propose him a visual representation of the request which will then be performed. This interpretation can then be amended or refined by the user. This interpretation step is essential in order to favor adequacy between search results and user expectations [43].
A. Interactions in a Documentary System System
User loop
requirements expression
A
interprétation representation
B
interpretation validation
requirements interpretation
C information search
information representation loop
browsing between information marking/localization among information
marking calculation
selection of an element for consultation display of the element
Fig. 9. Interactions with a documentary system
The considered interactions deal with the whole of the exchanges carried out between a user and a software application incorporating an electronic document management system (Fig. 9). Among these interactions, we distinguish: - the interactions allowing a user to express a requirement in term of information contents (Fig. 9 A). The interactions then relate to the expression modes of the need (text, graphics, …), the 17
http://exist.sourceforge.net/
Fig. 10. Refinement of the request.
As previously mentioned, in order to ease documents access by space criterion, our system identifies spatial entities which are present in the request (Fig. 10 - A) and represents them on map (Fig. 10 - B) with MBRs. The user thus visualizes how the system interprets his/her requirements from a geographical point of view. He/she can consequently validate this interpretation and thus launch a search, or, refine this interpretation by indicating geographical new or more precise areas of interests (Fig. 10 - C). 2) Visualization of the request results: In this stage, the system presents the documents likely to answer the user expectations. We chose the cartographic mode to output the results with the PIV prototype. Actually, our goal consists of integrating spatial dimension,
> PAPER IDENTIFICATION NUMBER: 246 < not only in the result presentation of the request but also in the manner of browsing among the results. We consider two assumptions: (a) any document containing at least a spatial entity is geolocalizable and, (b) if the user seeks documents according to spatial criteria, his/her interest focuses (partly) on space. The resulting documents are thus presented on a map according to the places they relate to (Fig. 11).
7
describe several distinct places which can be either precise places (F) or areas (E). Each site of the document is described with an icon. When an icon in such a document is selected, all the other site icons are highlighted to inform the user that it is a single document.
VI. PIV EVALUATION FIRST RESULTS
Fig. 11. Cartographic visualization of the results.
Spatial representation of a document with an iconographic form depends on the nature of the geographical entities which it describes. Thus, we can distinguish: i) Isolated text (A) or image (B) documents. These documents relate to a precise place which is not described in any other document resulting from the request. The representative icons are then positioned on the mentioned place. A click on the icon gives access to the document (or to a significant extract if it is a text document). ii) Documents stacked up on a single place (C). These documents exactly describe the same place. Rather than stacking up all the icons representing these documents on the relevant place, a single dedicated stack icon is put on the right place to inform the user. A click on the stack icon allows the user to explore the stack constitutive documents. As no spatial specific item can be used to distinguish these documents from/to each other, a list representation is then proposed to the user. iii) Conglomerates of documents (D). These documents relate to distinct places but too close according to the current scale of the map. Rather than representing the documents with all their corresponding icons (and no easy access or no access at all on the map), this typical spatial configuration is represented with a dedicated single icon. A click on such an icon initiates a scaling with a zoom up to obtain a broader representation of the area and thus to (hopefully) disperse the corresponding documents icons. iv) Documents associated with an area (E). These documents do not describe a precise place but an area (for example, “south of Eaux-Bonnes village”). The representative icons are then located in the centre of this area, and this area is highlighted with a mouse-over effect on the icon. A click on the icon allows to open the relevant document. v) Multi-site documents (E and F). These documents
Geographic features are described according to the space model (Fig. 2), independently of their representation mode. During the PIV IE evaluation we worked on images and textual books. Some Pyrenean lithographs have been marked manually whereas the end of this iconographic data processing sequence (GFs’ geo-localization) is automatic. We also carried out the scan and the OCR processing of 10 books of our corpus. Then we ran automatic textual IE processes with the PIV prototype. A book of 200 pages processing takes about 5 minutes. The PIV prototype found 9835 candidate GFs in these 10 books. At the same time, we hand-annotated geographic features: like in CLEF 18 campaigns, we have manually marked GFs of samples of all these books. Finally, we compared these hand-crafted annotations to PIV results in order to compute recall and precision rates of PIV IE processes. These PIV IE process evaluation first results are described in [44]: main drawbacks concern DCG rules and the lack of local specific geographic resources. Future research will focus on DCG extension in order to improve RGFs capturing process. In the same way, we are working on the PIV IR process evaluation: first results are described in [45]. It deals with 8000 paragraphs constituting the document units of the sample’s 10 books. We evaluated 12 queries: 8 queries deal with only spatial scope whereas the 4 remaining ones deal with both spatial and thematic scopes. In the framework of space queries, preliminary results show that our spatial approach outperforms the classical full text approach. However, when the queries contain both spatial and thematic features, the full text approach is still better. We plan to couple it within our spatial tools. The evaluation, by end-users, of the information visualization aspects of our PIV prototype is the plan of the next year.
VII. CONCLUSION We focus our work on restricted corpora such as local cultural heritage collections of documents. This specific context makes it possible to implement sensible scans which take into account the document contents. Our contribution is complementary to traditional search methods used in libraries. Our objective is to process the geographic semantics of such collections of documents and users’ queries in a more accurate way. The PIV prototype implements and combines original geographic semantics Information Extraction (IE),
> PAPER IDENTIFICATION NUMBER: 246 < Information Retrieval (IR) and Information Visualization (IV) approaches. Its experimentation with heterogeneous (texts and images) documents collections shows that this approach enhances the relevance of geographic query results. A first IE process evaluation will be soon published [35] and IR process evaluation is on the go. The key features of our proposal are: - the geographic unified model description: it supports a formal description of every Geographic Feature (GF) detected in collections of text or image documents. Complex GFs (Relative GFs) include other GFs: they are recursively defined from Absolute GFs and/or Relative GFs; - any GF’s geo-reference is found out in gazetteers or approached using relation semantics interpretation and the Minimum Bounding Rectangle (MBR) approach: the IR process is based on the intersections of geographic representations extracted from a user’s query and representations of documents collections within indexes; - a spatio-documentary navigation approach supports information visualization: it relies on the geographic characteristics of retrieved information within visualization and navigation scenarios; - the PIV system relies on a web services architecture and supports full XML format (schemas, GFs representations, indexes, documents extracts, etc.); hence, PIV web services can be integrated in existing Library Management Systems. Further work concerns the enhancement of information visualization and navigation. We will therefore design new scenarios to take into account the context and the user requirements both during the querying step and the visualization one. We are also planning to manage the features of a new topic. PIV document collections are characterized by contents referring to a territory and its history. This is the reason why time dimension management would obviously improve our IR process.
[8]
[9]
[10]
[11] [12]
[13]
[14]
[15]
[16]
[17]
[18] [19]
[20]
[21]
[22]
[23]
REFERENCES [1]
M. Abolhassani, N. Fuhr, and N., Govert, Information Extraction and Automatic Markup for XML documents, Springer, p. 159–174. 2003. F. B. Zhan, How much is region q covering region r, a little bit, somewhat, or nearly completely? M. Cristani and B. Bennett (Eds.), SVUG01: The First COSIT (Conference on Spatial Information Theory) Workshop on Spatial Vagueness, Uncertainty and Granularity, Morro Bay, CA, September 2001. R. A. Baeza-Yates, and B. A. Ribeiro-Neto, Modern Information Retrieval. ACM Press / Addison-Wesley, 1999. U. C. Benz, P. Hofmann, G. Willhauck, I. Lingenfelder, and M. Heynen, Multi-resolution, object-oriented fuzzy analysis of remote sensing data for GIS ready information. International Workshop - Semantic Processing of Spatial Data - Geopro, 2002. Zipf, Human Behaviour and the Principle of Least Effort. Addison Wesley, 1949. J. Lesbegueries, M. Gaio, P. Loustau, and C. Sallaberry, Geographical information access for non-structured data, ACM SAC ASIIS 2006. A. Borillo, L’espace et son expression en français. L’essentiel. Ophrys, 1998.
[2]
[3] [4]
[5] [6] [7]
[24]
[25]
[26]
[27] [28]
[29] [30]
18
www.clef-campaign.org
8
T. Charnois, Y. Mathet, P. Enjalbert, and F. Bilhaut, Geographic reference analysis for geographic document querying. workshop on the Analysis of Geographic References, Human Language Technology Conference (NAACL-HLT), Association for Computational Linguistic, 2003. E. Clementini, J. Sharma, and M. Egenhofer, Modeling topological spatial relations: Strategies for query processing. Computers and Graphics 18 (6): 815-822, 1994. A. G. Cohn, Qualitative spatial representation and reasoning techniques. In KI ’97: Proceedings of the 21st Annual German Conference on Artificial Intelligence, Springer-Verlag pp 1–30, London, UK, 1997. A. G. Cohn, and S. M. Hazarika, Qualitative spatial representation and reasoning: An overview. Fundamenta Informaticae, 46(1-2):1–29, 2001. M. J. Egenhofer,Toward the semantic geospatial web. In GIS ’02: Proceedings of the 10th ACM international symposium on Advances in geographic information systems, p. 1–4. ACM Press, 2002. N. Bonnel, F. Moreau, Quel avenir pour les moteurs de recherche ? In Proceedings of the workshop Manifestation des Jeunes Chercheurs francophones dans les domaines des STIC, MajecSTIC 2005, Rennes, France, pp. 291-299, november 2005. P. Enjalbert, and M. Gaio, Traitements sémantiques pour l’information géographique, textes et cartes. Revue Internationale de Géomatique, to be published, 2006. P. Etcheverry, C. Marquesuzaà, and J. Lesbegueries, Revitalisation de documents territorialisés : Principes, outils et premiers résultats. Workshop Met-SI INFORSID, 2005. R. Gaizauskas, An information extraction perspective on text mining: Tasks, technologies and prototype applications. Euromap Text Mining Seminar, Sheffield, 2002. R. Gaizauskas, T. Wakao, K. Humphreys, H. Cunningham, and Y. Wilks, University of sheffield: Description of the lasie system as used for muc, http://acl.ldc.upenn.edu/M/M95/M95-1017.pdf, 1995. R. Gaizauskas, and Y. Wilks, Information extraction: Beyond document retrieval. Journal of Documentation, 54(1):70–105, 1998. N. Gotts, and J. Goodday, A connection based approach to commonsense topological description and reasoning. The Monist. p. 51-75. citeseer.ifi.unizh.ch/gotts95connection.html. 1996. N. Hernandez, Ontologies pour l’aide à l’exploration d’une collection de documents. In Ingénierie des Systèmes d’Information, volume 10, pp 11–31. Hermès Sciences, 2005. L. Hill, Indirect geospatial referencing through place names in the digital library: Alexandria digital library experience with developing and implementing gazetteers. 62nd Annual Meeting of the American Society for Information Science, pp. 57-69. Medford, N.J.: ASIS, 1999. L. Hill, Core elements of digital gazetteers: Place names, categories, and footprints. In ECDL ’00: Proceedings of the 4th European Conference on Research and Advanced Technology for Digital Libraries, pp. 280– 290. Springer-Verlag, 2000. J. Casenave, C. Marquesuzaà, P. Dagorret, and M. Gaio, La revitalisation numérique du patrimoine littéraire territorialisé. In Colloque International EBSI-ENSSIB, Montréal, Octobre 2004, www.ebsi.umontreal.ca/rech/ebsi-enssib/ebsi-enssib-programme.html. P. Loustau, Traitements sémantiques de documents dans leur composante spatiale. Master’s thesis, Université de Pau et des Pays de l’Adour, France, 2005. C. Marquesuzaà, P. Etcheverry, and J. Lesbegueries, “Exploiting geospatial markers to explore and resocialize localized documents“. In Proceedings of the first International Conference on GeoSpatial Semantics, GeoS 2005, Mexico City, november 29-30, Lecture Notes in Computer Science, Vol. 3799, pp. 153-165, 2005. J. Cossanel, J.P. Cahier, M. Zacklad, and J. Charlet, Les Topic Maps sont-ils un bon candidat pour l’ingénierie du Web Sémantique ? In Proceedings of conférence Ingénierie des Connaissances IC2002, Rouen, Mai 2002. P. Muller, Topological spatio-temporal reasoning and representation. Computational Intelligence, 18(3):420–450, 2002. H. Tebri, Formalisation et spécification d’un système de filtrage incrémental d’information. PhD thesis, Université Paul Sabatier de Toulouse, 2004. M. Torres, Semantics definition to represent spatial data. International Workshop - Semantic Processing of Spatial Data - Geopro, 2002. C. Vandeloise, L’espace en français. Travaux Linguistiques. Seuil, 1986.
> PAPER IDENTIFICATION NUMBER: 246 < [31] A. Widlocher, and F. Bilhaut, La plate-forme linguastream : un outil d’exploration linguistique sur corpus. In Actes de la 12e Conférence Traitement Automatique du Langage Naturel, 2005. [32] B. Kules, and B. Schneiderman, Categorized graphical overviews for web search results: An exploratory study using U.S. government agencies as a meaningful and stable structure. In Proceedings of the Third Annual Workshop on HCI Research in MIS, Washington, D.C., December 10-11, 2004. [33] A. Leuski, and J. Allan, Lighthouse: Showing the way to relevant information, In Proceedings of IEEE Symposium on Information Visualization (InfoVis'00), pp. 125-130, Salt Lake City, Utah, USA, October 9-10, 2000. IEEE Computer Society. [34] M. Sanderson, and J. Kohler, Analyzing geographic queries“. In Proceedings of the Workshop on Geographic Information Retrieval, SIGIR 2004, www.geo.unizh.ch/~rsp/gir/, 2004 [35] C. Sallaberry, M. Gaio, J. Lesbegueries, and P. Loustau, “PIV: a Geographic Content-Based Documents Management System“. Submitted to DocEng 2006. [36] N. Bonnel, A. Cotarmanac’h, and A. Morin, Gestion et visualisation des résultats d’une requête, Actes du 3ème Atelier Visualisation et Extraction de Connaissances (associé à EGC'05), pp. 37-47, Paris, France, 2005. [37] N. Bonnel, A. Cotarmanac’h, and A. Morin, Meaning Metaphor for Visualizing Search Results, Proceedings of the 9th International Conference on Information Visualisation (IV'05), pp. 467-472, London, England, 2005. [38] M. Hascoët, and M. Beaudouin-Lafon, Visualisation Interactive d’information, Recherche et Visualisation d’Information. Revue I3, pp. 77-108, Editions Cépaduès, Volume 1, n°1, 2001. www.revuei3.org/volume01/numero01/article01_01_03.pdf [39] C. Jacquemin, H. Folch, K. Garcia, and S. Nugier, Visualisation interactive d’espaces documentaires, Revue Information, Interaction, Intelligence, Revue en Sciences du Traitement de l’Information, Editions http://www.revueCépaduès, Volume 5, n°1, 2005. i3.org/volume05/numero01/revue_i3_05_01_03.pdf [40] B. Kules and B. Schneiderman, Categorized graphical overviews for web search results: An exploratory study using U.S. government agencies as a meaningful and stable structure. Proceedings of the Third Annual Workshop on HCI Research in MIS, Washington, D.C., December 10-11, 2004. [41] A. Leuski and J. Allan, Lighthouse: Showing the way to relevant information, In Steven F. Roth and Daniel A. Keim, editors, Proceedings of IEEE Symposium on Information Visualization (InfoVis'00), pp. 125130, Salt Lake City, Utah, USA, October 9-10, IEEE Computer Society. 2000. [42] J. Mackinlay, G. Robertson, and S. Card, The Perspective Wall : Detail and Context Smoothly Integrated.Proc. ACM Human Factors in Computing Systems (SIGCHI’91), pp. 173-179, 1991. [43] J.M. Torres, and A. Parkes, User modelling and adaptivity in visual information retrieval systems, Workshop on Computational Semiotics for New Media, University of Surrey, UK, June 29-30, http://wwwscm.tees.ac.uk/users/p.c.fencott/newMedia. 2000. [44] C. Sallaberry, M. Gaio, J. Lesbegueries, and P. Loustau, PIV: a Geographic Content-Based Documents Management System. Submitted to the Geospatial Web book, the Advanced Information and Knowledge Processing Series, Springer, 2007. [45] C. Sallaberry, M. Baziz, and J. Lesbegueries, Evaluation of an IE and IR Approach Combining Spatial and Thematic Features. Submitted to The 2006 IEEE International Conference on Data Mining (ICDM) - mining spatial data track, Hong-Cong, 18-22 December 2006.
9