Bird Census News 2005:18/1:30-38
Report on the workshop “Spatial modelling of large scale bird monitoring data: towards pan-European quantitative distribution maps”. Organised by the Catalan Ornithological Institute and the Forest Technology Centre of Catalonia under the EBCC umbrella. Held in Solsona, Catalonia, Spain, 8 –9 April 2005.
Lluís Brotons 1, Henk Sierdsema 1
2
3
2
& Stuart Newson
3
Catalan Ornithological Institute & Centre Tecnològic Forestal de Catalunya, Àrea de Biodiversitat, Pujada del Seminari s/n, 25280, Solsona, Catalonia, Spain,
[email protected] IBED-University of Amsterdam & SOVON (Dutch Centre for Field Ornithology), Rijksstraatweg 178, NL-6573 DG, Beek-Ubbergen, The Netherlands,
[email protected] British Trust for Ornithology, The Nunnery, Thetford,Norfolk, IP24 2PU, United Kingdom,
[email protected]
Background Mostly using volunteers, cost effective regional and national large scale biodiversity monitoring programs, currently provide the basis for identifying population change at large spatial scales. These have been implemented across a number of countries for a range of taxa, of which birds are particularly noteworthy in being monitored now in most European countries using representative and well-designed sampling strategies. Bird monitoring programs such as these provide us with a great deal of spatial data that have the potential to be used to create maps showing changes in species distribution and abundance. In fact, mapping patterns of species distribution have for a long time been a major issue in ecology. Knowing where a species occurs and recording changes in this distribution has major implications, ranging from theoretical ecology to conservation and species management. Interest in mapping species distribution has lead to a number of cartographic experiences amongst which atlas work such as those carried out on birds at large spatial scales, stand as paradigmatic examples. In recent years, some bird atlases have attempted to apply statistical techniques to allow the extrapolation of sampled data to nearby areas from which information is lacking. These methodologies represent a step forward in both the approach employed and in the quality of the obtained results. Furthermore, they allow a convergence between strict mapping attempts, such as those represented by atlases, and
monitoring programs primarily aimed at recording a measure of abundance at sampling sites and describing temporal changes in this parameter. Some early experiences in France, the Netherlands and the United Kingdom have already started to explore the potential of large scale monitoring bird data in producing quantitative bird distribution maps. Contrary to earlier static mapping initiatives (i.e. atlases), these maps have the potential for being updated with the same periodicity as which data is collected. These methodological advances, new perspectives and recent initiatives became apparent at the last EBCC conference held in Kayseri, Turkey, in September 2004, and were recognised by a number of people from different organisations working on different subjects involving large scale mapping of bird monitoring data. The way to exchange information on this subject and move forward in a common way was discussed. It was agreed that a workshop be organised, aimed at setting the stage on spatial modelling of bird monitoring data by attracting different groups working on the topic. Furthermore, and given the role of EBCC in co-ordinating and integrating monitoring programmes at a pan-European scale, the idea arose of exploring the possibility of using the existing panEuropean bird monitoring network as a seed to integrate data for different countries and explore the potential of these data for mapping purposes. The final venue for the spatial modelling workshop was Solsona, a little town located in the foothills of the Spanish Pyrenees. The meeting took place between the 8th and the 10th of April, 2005 and was co-organised by the Forest Technology Centre of Catalonia and the Catalan Ornithological Institute under the umbrella of the EBCC.
Objectives of the workshop. The objectives set up to be addressed during the workshop were as follows: 1. Define explicitly what it was meant to achieve by the proposed panEuropean bird mapping initiative. 2. Compile and assess the different methodologies available for such a purpose and discuss their adequacy in different regions, and their general accessibility and usability. 3. Discuss how we may deal with the problem of a wide diversity of survey methodologies used in different areas (e.g. territory mapping, line transects, point counts, random versus, non-random) where counts are not directly comparable. 4. Conduct a pan-European mapping pilot study with a limited set of species. For the pilot study a number of datasets would be treated as if they represent actual abundances and will feed habitatgeostatistical models to generate such maps.
5. Define the conditions needed to start setting up a meta-database of European monitoring-datasets convenient for large-scale modelling. Protocol should include guidelines for data sharing, confidentiality and data ownership. 6. Discuss and generate ideas to raise funds and advance in the research lines described.
Experiences and approaches The workshop involved 28 people from 13 European countries and consisted of presentations, hands-on sessions and discussions aimed at defining the current state of the art in spatial modelling of large-scale bird monitoring data and define the way to move forward. The first session on Friday introduced, by means of short talks, recent experiences of bird mapping from different European countries. Marc Kery and Stuart Newson from Sempach and BTO discussed issues concerning the difficulties of converting counts obtained from field sampling to true densities. This topic is of major relevance to any attempt to map and integrate data on real densities across different regions. Stuart Newson also introduced some of the first’s trials in using geostatistics to create abundance maps from BBS data. Such methodologies are being explored in Britain to visually show spatial changes in bird abundance as estimated by BBS data. Lluís Brotons from the Catalan Ornithological Institute described the methodology used to produce maps for the new Atlas of Breeding birds of Catalonia 1999-2002, which used a mixture of environmental and spatial models to map relative bird abundance at a regional level. Lluís Brotons introduced a range of niche based models (i.e. models that relate environmental data to species presence or abundance) as potential tools to be used in large scale bird mapping which is particularly critical in areas of poor coverage. Again using environmental data for predicting bird distribution, Javier Bustamante from CSIC showed that environmental data derived from satellite imagery might be extremely useful when used across a wide range of resolutions and qualities. Finally, Henk Sierdsema examined the potential of using abundance data from large scale breeding bird surveys to map changes in species distribution and showed a number of applications regarding this subject. Henk Sierdsema also touched on methodological issues regarding mapping and illustrated the potential of combining different, but to some degree complementary, modelling approaches (i.e. regression habitat modelling and geostatistical modelling). The workshop continued with a hands-on session using participants’ laptops and data aimed at producing tentative pan-European abundance maps for preselected focal species. To this aim, the workshop organisers previously contacted co-ordinators of major bird monitoring surveys in Europe in order to provide data on focal farmland species. In time for the workshop, monitoring data were available from Spain, Catalonia, France, the Netherlands, United Kingdom,
Republic of Ireland, Italy and Hungary could be put together in a digital format appropriate for spatial modelling. Group discussions on different chosen topics follow for most of Saturday and ended up in a summary session in the afternoon.
Main topics for discussion - Products derived from spatial mapping and usefulness. Two kinds of cartographic products that could be produced from bird monitoring data were identified, namely: 1) Distribution maps including information on species abundance. 2) Trends maps identifying spatial variability of temporal changes in species abundance (i.e. pan-European bird indicator trends). These two products have a vast potential to be used in different contexts from basic ecology to biodiversity assessment at a continental scale. Some discussion arose regarding the need to specify in the coming stages of product development clear objectives regarding the use of each of the types of maps to be generated. Mapping of abundance may serve as the basis for a future new European Breeding Bird Atlas based on bird monitoring data. Meanwhile, attempts to map bird abundance at large spatial scales were agreed to be important in providing baseline data for a number of different applications. Regarding the mapping of the spatial variability of changes in bird abundance, it was argued that such an approach may offer a great degree of complementarity with current efforts of the EBCC to produce pan-European bird trend indicators. At present, pan-European trend indicators lack an explicit spatial component. Mapping trends in bird abundance may offer a new tool to identify areas with larger change rates and thus guide future actions. - Methodological issues and mapping During the discussions it was clear that different mapping goals have different constraints and requirements and therefore, require different approaches. In particular, for the mapping of bird abundance, spatial accuracy appears to be critical given that maps will aim to reproduce real distribution patterns. In this case, use of surrogate environmental data and habitat modelling may appear especially useful given that such data offer a great tool to project data to regions with poor coverage. Accurate bird abundance maps may favour methodologies for estimating absolute population for common species for which at present only educated guesses are often available. Some problems may be envisaged regarding the kind of adequate data that may be used at European scale to run habitat models. Corine land cover, and satellite data offer good candidates but a critical comparison is required to test their effectiveness. On the other hand, mapping of population trends may be useful at coarser resolutions than abundance mapping and should concentrate on the temporal
comparability of the mapped abundance change index. Therefore, spatial accuracy may be less important and mapping methodologies used in this context should concentrate on sampled areas and rely more on interpolation techniques which offer the best spatial representation of sampled data. In these cases environmental information may not used at all or used only as ancillary data. The issue of comparability of samples across different temporal periods was object of discussion regarding the best methods potentially used to estimate within site trends in abundance. In this context, missing values are of critical importance since they may be behind local spatial biases in abundance change. The experience gained by EBCC in applying TRIM to solve this kind of missing data at a temporal scale may be useful in this context, although final solutions were not agreed upon. An alternative option aimed at the spatial representation of changes in abundance was proposed by Javier Bustamante referred to as anomaly map. These maps could show, rather than absolute changes in abundance, standardised change estimation as calculated for each different monitoring methodology (i.e. accounting for the variance induced by each method). - Methodological issues concerning data combination from different sources Although it was not considered a priori an in depth-topic for discussion at this workshop, the issue of count-density conversion was the subject of debate during some group discussions. In particular, it was noted that given the wide range of monitoring methods with varying assumptions used in different countries, counts would not be directly comparable in tentative mapping exercises. However, this topic has been under debate ever since monitoring methods have been used to estimate population density and therefore, intrinsic difficulties in solving this issue suggested the progress should advance in two different fronts. First, national and regional monitoring programs should favour the use of techniques (distance sampling, capture-recapture, etc) that control for biases in detectability and to obtain estimates of absolute densities for each species. However, progress in producing estimates of absolute densities from bird monitoring data is expected to be slow and asymmetric between countries and methodologies. Therefore, it was also suggested to investigate shortcut alternatives for allowing comparability of counts obtained from different monitoring schemes. At this point, the input from Lorenzo Fornasari offered some hope. He suggested using information on country area and population size to scale data from different monitoring surveys to the same units. In spite of the biases probably induced by errors in total country population estimations and lack of spatial representativity of many monitoring networks, preliminary results using this methodology applied to the French and the Italian data rendered promising results.
Conclusions/recommendations from the workshop The workshop on spatial modelling held in Solsona confirmed a large deal of interest in this subject, it showed potential for producing large scale abundance and trend maps at a pan-European scales and to identify the main constraints expected in the road ahead. The main conclusions from the workshop were as follows: -
Pan-European mapping has a great potential and given the methodologies, data availability and experience accumulated, the present time offers a great opportunity for developing this initiative. The pan-European bird mapping initiative born from the Solsona workshop should explore methodologies and approaches to integrate data from monitoring schemes across Europe and produce spatial representations of such data.
-
Two main types of maps may be initially produced. Distribution maps showing spatial variability on in species abundance, and trend maps showing spatial variability in changes of species abundance. Both pathways are promising but preliminary tests are required to solve identified problems such as homogenisation of abundance between countries (i.e. count-density conversion, estimation of alternative abundance indices comparable between methodologies), evaluation of habitat modelling across regions and suitability of environmental data available.
-
Data integration from different survey methodologies was identified as a major issue. Progress at a country level in transforming counts to absolute densities and the investigation of shortcuts aimed at creating abundance indices comparable between methodologies were proposed.
-
The pilot study conducted on a number of monitoring schemes produced the first tentative, abundance pan-European maps for a number of bird species ever. This showed the potential to develop a mapping initiative. These maps are intuitive and appealing. Since policy making is expected to be a major use of such maps, special care should be allocated to justification of methodologies used in different applications including limitations and orientation for data interpretation.
The way forward Given the discussions and main conclusions agreed upon during the workshop, a number of steps were proposed to advance the application of spatial modelling to large-scale bird monitoring data. -
Promote experiences at regional and national level to advance the use of monitoring data in spatial modelling and map generation.
-
Creation of a working group within the EBCC aimed at co-ordination, discussing and promoting spatial modelling initiatives within the EBCC
context. The group is open to everybody and will be co-ordinated by Lluís Brotons (ICO, Catalan Ornithological Institute), Henk Sierdsema (SOVON, Dutch Centre for Field Ornithology), Stuart Newson (BTO, British Trust for Ornithology) and Frederic Jiguet (Musée d'Histoire Naturelle Paris). -
Collate data from different European monitoring schemes in order to complete the mapping initiatives carried out during the workshop. Given the recent adoption of the bird farmland index as a biodiversity indicator by the European Union, it was argued that mapping initiatives carried out in a first stage will prioritise the use of farmland bird species individually or as a group.
-
Carrying out a pilot study on farmland birds that would serve to illustrate the potential of different methodologies and allow evaluation of its constraints and limitations. As a first step, the pilot study would concentrate on geo-statistical modelling of bird abundance and trends in bird abundance. This pilot study should assess the adequacy of different study resolutions to be used to generate pan-European maps.
-
Collection of pan-European environmental data, Corine land cover, satellite data, and freely available data sets to identify suitable and convenient data to carry out appropriate habitat modelling aimed at careful mapping of bird abundance in Europe.
-
Presentation of the mapping initiative to the scientific community. Tentatively to the IOC conference to be held in Hamburg, Germany, in 2006.
Acknowledgements The organisers’ thanks all people who contributed to the workshop and excursions’ organisation: Oriol Baltà, Sergi Herrando, Gabriel Gargallo, Montse Garcia, Rosa Argerich, Gerard Bota, Montse Raurell, Anni Ponjoan, David Guixe and all those volunteers who contributed to the workshop success. We thank “Fundació Territori i Paisatge” for the organisation of the excursion to the Alinyà mountain. The workshop organisation had the financial support of the Catalan Government (DURSI, “Departament d’Universitats, Recerca i Societat de la Informació”, and DMAH, “Departament de Medi Ambient i Habitatge”).
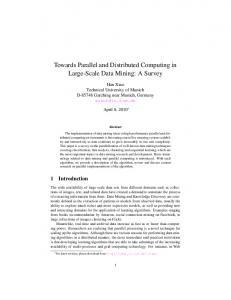
First tentative, pan-European abundance maps for the Skylark, Alauda arvensis and Corn Bunting Milaria calandra. The maps were obtained by means of kriging survey count data from Ireland, United Kingdom, the Netherlands, France, Spain, Catalonia, Italy and Hungary. Note scaling problems for the Skylark between Hungarian data and the rest of countries suggesting biases derived from count-density conversion. Units are pairs/km2.
List of participants to the workshop: Anselin, Anny,
[email protected], Belgium; Vorisek, Petr,
[email protected], Czech Republic; Bauer Hans-Günther,
[email protected], Germany; Crowe Olivia,
[email protected], Ireland; de Carli Elisabetta,
[email protected] , Italy; Fornasari, Lorenzo,
[email protected], Italy; Foppen, Ruud,
[email protected], Netherlands; Sierdsema, Henk,
[email protected], Netherlands; Chylarecki,Przemek,
[email protected], Poland; Mischenko, Alexander,
[email protected], Russia; Bonan, Arnau,
[email protected], Spain; Brotons, Lluís,
[email protected], Spain; Bustamante,Javier,
[email protected], Spain; Gargallo, Gabriel,
[email protected], Spain; Herrando, Sergi,
[email protected], Spain, , Spain; Lindström, Seoane, Javier,
[email protected] , Ake,
[email protected], Sweden; Kery, Marc,
[email protected] Switzerland; Ozesmi, Uygar,
[email protected], Turkey; Burfield, Ian,
[email protected], UK; David Noble,
[email protected], UK; Gregory, Richard,
[email protected]; UK; Newson, Stuart,
[email protected], UK; Simon Gillings,
[email protected], UK.