May 20, 2006 - Spatial organization and ecohydrological interactions ...... scale ecogeomorphological organization have not been ..... II, edited by H. S. Seo.
WATER RESOURCES RESEARCH, VOL. 42, W06D06, doi:10.1029/2005WR004582, 2006
Spatial organization and ecohydrological interactions in oxygen-limited vegetation ecosystems Marco Marani,1 Sonia Silvestri,2 Enrica Belluco,1 Nadia Ursino,3 Andrea Comerlati,4 Omar Tosatto,3 and Mario Putti4 Received 14 September 2005; revised 2 December 2005; accepted 10 January 2006; published 20 May 2006.
[1] Wetlands are characterized by extremely high biodiversity and primary productivity
(comparable to tropical rain forests), provide critical habitats for rare and endangered vegetation and animal species, and mediate the effects of floods and the action of the sea on the coast. A deep understanding of wetland system functioning cannot be acquired by simply reducing its dynamics to a collection of parts but requires the explicit description of wetland physical and ecological processes as fully interacting components. In fact, the complex spatial ecohydrological patterns characterizing wetland areas arise as a result of the coupled evolution of their ecological, hydrological, and morphological features. Here we examine observations of prominent spatial patterns in wetland vegetation and link them to the relevant hydrological and ecological processes. We describe the limitations to vegetation development due to scarce soil oxygen availability and implement a mathematical model, based on Richards’ equation, coupling subsurface water flow and plant water uptake in a tidal salt marsh. The soil aeration patterns arising from such interactions highlight the central role of vegetation in increasing soil aeration, possibly inducing the establishment of a permanently aerated soil layer (in spite of tidal flooding), and the influence of different soil characteristics on soil oxygen availability. Finally, we discuss how ecohydrological interactions can contribute to explain patterns of vegetation colonization and spatial heterogeneity. Citation: Marani, M., S. Silvestri, E. Belluco, N. Ursino, A. Comerlati, O. Tosatto, and M. Putti (2006), Spatial organization and ecohydrological interactions in oxygen-limited vegetation ecosystems, Water Resour. Res., 42, W06D06, doi:10.1029/2005WR004582.
1. Introduction [2] Wetlands are areas permanently or periodically inundated by floods or by the tide and constitute a transition zone between deep water aquatic systems and terrestrial environments. They are characterized by extremely high primary productivity (comparable to tropical rain forests [see, e.g., Sculthorpe, 1967; Cronk and Fennessy, 2001]), provide critical habitats for a very diverse micro and macro flora and fauna [Mitsch and Gosselink, 2000; Aspden et al., 2004], and mediate the effects of floods and the action of the sea on the coast. Wetland areas throughout the world have been dramatically reduced over the last century, mainly due to human activities (e.g., land reclamation, the construction of harbor structures and defenses against high tides in lagoonal or estuarine systems) and, being located within the range of tidal fluctuations, they are greatly threatened under even the mildest scenarios of climate and 1 International Center for Hydrology ‘‘D. Tonini’’ and Dipartimento di Ingegneria Idraulica, Marittima, Ambientale e Geotecnica, University of Padova, Padua, Italy. 2 Servizio Informativo del Consorzio Venezia Nuova, Magistrato alle Acque di Venezia, Venice, Italy. 3 Dipartimento di Ingegneria Idraulica, Marittima, Ambientale e Geotecnica, University of Padova, Padua, Italy. 4 Dipartimento di Metodi e Modelli Matematici per le Scienze Applicate, University of Padova, Padua, Italy.
Copyright 2006 by the American Geophysical Union. 0043-1397/06/2005WR004582$09.00
rate of sea level rise changes. The extremely high biodiversity hosted by wetlands, the presence of a very high proportion of rare or endangered vegetation and animal species (e.g., see www.ramsar.org), and their importance as buffer zones for flood and sea action mitigation have stimulated an increasing interest in the study of the processes responsible for the observed wetland geomorphic structures and their dynamics [e.g., Pestrong, 1965; Pethick, 1984; Perillo, 1995; Fagherazzi et al., 1999, 2004; Rinaldo et al., 1999a, 1999b; Allen, 2000; Marani et al., 2002, 2003b, 2004, 2006; D’Alpaos et al., 2005]. However, a deep understanding in this field, necessary in order to develop effective wetland conservation and restoration practices, is highly complicated by the fact that the dynamics of wetland geomorphology cannot be described simply in terms of hydrodynamic, sediment transport or soil processes. Rather, a quantitative and predictive explanation of their transformations requires the explicit description of the crucial wetland ecological structures, not just as fixed boundary conditions or parameterizations, but as fully interacting components [Marani et al., 2004, 2006]. Particularly relevant in this ecogeomorphological context are wetland plants, which crucially affect the overall geomorphological and ecological evolution of a humid area. [3] This paper reviews some recent results and presents some original extensions in the field of wetland ecology and hydrology to provide a description of our current understanding of the main ecohydrological processes in oxygenlimited wetland ecosystems. In particular, we introduce
W06D06
1 of 12
W06D06
MARANI ET AL.: OXYGEN-LIMITED VEGETATION
some basic notions on the physiology and ecology of wetland plants, emphasizing the coupling of hydrogeomorphic and ecological dynamics. Field and remote sensing observations of wetland plants, with specific reference to coastal marshes, and of related environmental conditions are then described in an attempt to capture the signatures of ecological-hydrological couplings. A model of vegetationsubsurface saturated/unsaturated flow interaction is then described, providing insight into the processes controlling wetland ecohydrological dynamics.
2. Wetland Plants [4] Wetland vegetation has adapted to frequently inundated soils (hydrophytes) and, in coastal wetlands, to a high soil salinity (halophytes) (see Silvestri and Marani [2004] for a brief, nonspecialist, introduction to the basic physiology and ecology of wetland plants and Adam [1990], Ungar [1991], Mitsch and Gosselink [2000], and Cronk and Fennessy [2001] for detailed accounts). Adaptation to hypersaline soils (with ion concentrations higher than seawater, due to the effects of evapotranspiration) occurs through osmotic adjustments that maintain a lower total water potential in plant tissues than in the soil interstitial water, thus allowing water uptake and transport to the leaves [Ungar, 1991]. Adaptation to poorly aerated soils happens through different strategies, including the development of an intercellular pore network (aerenchima [see, e.g., Ungar, 1991]), through which air can diffuse even under waterlogged conditions, and an increased pore volume in the plant tissue (up to 60% in hydrophytes, compared to 2 – 7% in terrestrial species [Armstrong, 1982]), where oxygen may be stored. Soil hypoxia (or anoxia) not only directly affects root aerobic respiration, but also changes soil chemistry, inducing the formation and accumulation of various compounds that, depending on their concentration, may be toxic for plants [Pezeshki, 2001]. Wetland plants are capable, by oxygen diffusion through their tissues [Armstrong, 1982] and sediment ventilation due to root water uptake [Dacey and Howes, 1984], of improving the aeration of the soil in the proximity of their roots, thus attenuating soil reducing conditions. A further mechanism of sediment aeration was shown by Ursino et al. [2004], whose numerical experiments showed that plant transpiration can induce the establishment of an aerated layer even when the soil surface is flooded. [5] The traditional view summarizes the effects of these complex soil-water-vegetation interactions by assuming that the presence of species characterized by different degrees of adaptation to hypoxic conditions is dictated by the hydroperiod, i.e., the ratio between the duration of soil emersion and submersion intervals, computed over a sufficiently long time period (e.g., during the growing season or for a whole year [Kadlec and Knight, 1996; Mitsch and Gosselink, 2000; Cronk and Fennessy, 2001]). This view is contradicted by recent field observations [Bockelmann et al., 2002; Silvestri and Marani, 2004] and an alternative framework, involving extensive vegetation feedback on soil aeration, will be described below on a quantitative modeling basis. [6] The interactions between wetland vegetation and the physical processes shaping their environment are manifold. The presence of plants importantly impacts the hydrody-
W06D06
namic circulation and the associated sediment transport patterns, promoting inorganic sediment deposition [Friedrichs and Perry, 2001]. Plants also increase deposition rates by means of the organic sediment flux associated to biomass production, which, in many coastal wetlands, is the main source of sediments fueling geomorphic processes [Cahoon and Reed, 1995]. In addition, vegetation roots increase sediment stability, while its standing biomass reduces erosion by attenuating wave action [Leonard and Luther, 1995]. The overall effect of wetland plants, particularly in salt marshes, is thus the promotion of soil accretion, crucially contributing to the attainment of a dynamical balance between subsidence, soil accretion, and local rate of sea level rise [Allen, 2000]. The increased deposition caused by vegetation and the associated elevation changes, in turn, impact the duration and frequency of soil flooding. As a consequence, habitat characteristics change, favoring the establishment of species that are less efficient in coping with low oxygen availability but are more competitive in a relatively less stressful environment. The resulting coexistence of adjacent areas characterized by varying aeration rates promotes the phenomenon called zonation, which consists of a patchy spatial distribution of vegetation species with well defined borders [Adam, 1990]. [7] Plant transpiration influences wetland hydrological processes by altering groundwater table levels. In particular, Dacey and Howes [1984] suggest that wetland plants, because of the increased evapotranspiration rates, promote air flux into the soil, thereby incrementing oxygen availability and thus biomass production. Water dynamics in the unsaturated layer, neglected by Dacey and Howes [1984], is described through numerical simulations by Ursino et al. [2004], who show that transpiring plants can induce the presence of a persistent aerated layer even below the flooded surface soil and provide a physical explanation for previous field observations [Chapman, 1938, 1940; Stevenson and Emery, 1958; Clarke and Hannon, 1969].
3. Observations and Models of Salt-Marsh Vegetation [8] Spatial heterogeneities in the distribution of wetland vegetation occur over a range of scales between a few tens of centimeters (size of the smallest plants) and tens of kilometers (size of the entire wetland area). This range of scales is in practice not accessible through field surveys, which require very long times in order to cover large wetland areas (typically characterized by difficult accessibility) and may seriously interfere with environmental integrity. Past characterizations of wetland vegetation thus tended to be of a qualitative nature and could not provide an ‘‘instantaneous’’ spatially distributed description. Recently, airborne and satellite remote sensing data have attained spatial resolutions that are suitable for the task of wetland vegetation mapping and a spectral detail that allows the discrimination of different vegetation species [Thomson et al., 1998; Silvestri et al., 2003; Marani et al., 2006]. [9] The vegetation observations presented here regard halophytic plants in salt marshes within the Venice lagoon, Italy (Figure 1). Though the general tendency of this lagoon is erosive [Marani et al., 2003a; Silvestri et al., 2005], the studied marshes (San Felice, Riga´, Salina Nord, and Palude Maggiore shown in Figure 1) are characterized by relative
2 of 12
W06D06
MARANI ET AL.: OXYGEN-LIMITED VEGETATION
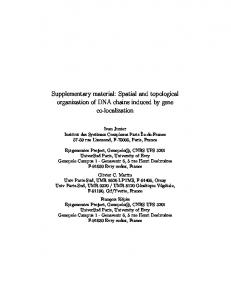
Figure 1. Location of the study marshes considered in the Venice Lagoon. The lagoon is characterized by a mean water depth � 1.1 m and a semidiurnal tidal regime with a spring tide amplitude of about 1.4 m. stability and healthy vegetation conditions [Marani et al., 2004]. The marshes have different soil elevation ranges (San Felice: 0.01 –0.68 m above mean sea level (amsl); Riga`: 0.19– 0.53 m amsl; Salina Nord: 0.13– 0.49 m amsl; Palude Maggiore: 0.15– 0.49 m amsl), are flooded (on the average) twice a day, and host a varying mix of the following dominant halophytic species: Spartina maritima (simply Spartina in the following), Limonium narbonense (Limonium in the following), Sarcocornia fruticosa (Sarcocornia), Juncus maritimus (Juncus), and Salicornia veneta (Salicornia) (see http://www.tideproject.org for a detailed description). These species are all emergent (i.e., rooted in the soil but with aerial photosynthetic parts), with height roughly between a few centimeters and about 70 cm. [10] In this study we consider CASI airborne hyperspectral data (15 spectral bands in the visible (VIS) and near infrared (NIR) part of the spectrum) with a 1.3 m ground resolution, collected over the San Felice marsh (Figure 1) on 29 September 2002. The analyses performed represent an extension to a considerably larger area of existing saltmarsh vegetation maps from previous works [Marani et al., 2003b, 2006; E. Belluco et al., Mapping salt-marsh vegetation by multispectral and hyperspectral remote sensing, submitted manuscript, 2005, hereinafter referred to as Belluco et al., submitted manuscript, 2005]. We performed extensive ground truth field observations, involving the identification of ‘‘pure’’ vegetation reference areas for each species throughout the scene, their delineation by accurate differential GPS (minimum accuracy of ±1 cm in x, y and z), and the quantitative description of vegetation cover through digital camera images (Belluco et al., submitted manuscript, 2005). A subset of the ground truth observations was randomly selected to train a Spectral Angle Mapper (SAM) classifier to produce a vegetation map including four vegetation classes, representing the four dominant species in the marsh, one class for water (comprising channels and creeks), and one class for bare soil. The resulting map is shown in Figure 2 and was successfully validated using both direct qualitative knowledge on
W06D06
the site and the set of validation ground truth observations (independent of the training set (Belluco et al., submitted manuscript, 2005)). Figure 2 well exemplifies the vegetation patterns characteristic of zonation, with its typical patchy distribution and well-defined boundaries between areas occupied by different species. [11] The properties of the remote-sensing derived vegetation distributions are discussed in some detail by Marani et al. [2003b, 2004, 2006], Silvestri et al. [2003], and Silvestri and Marani [2004]. It is relevant here to discuss the spatial correlation of species distribution, which contains the signature of the processes underlying vegetation dynamics [Levin, 1992]. One important question regards the possible presence of characteristic scales, which may reveal the typical range of operation of plant reproductive strategies. One way to look at the scale properties of the species spatial diversity is to study the probability distribution of the area of vegetation patches (or clusters), defined as sets of con-specific connected pixels. Figure 3 shows the probability of exceedance of cluster size for each vegetation class in Figure 2 and for all classes together (i.e., only distinguishing vegetated clusters from nonvegetated areas, irrespective of the species). The observational probabilities of exceedance are very well approximated by power laws within the entire range of scales explored (which extends those considered in previous studies [Marani et al., 2006]). The power law form of the probability distributions indicates that vegetation patches do not exhibit a characteristic size and are scale invariant (at least for Spartina, Sarcocornia, and Limonium, whose patch size probability distributions exhibit exponents which are smaller than one, implying that no statistical moment is defined). This circumstance has interesting parallels in savanna vegetation [Caylor and Shugart, 2005] and bears some consequences as to the competitive and reproductive strategies of halophytic vegetation. The clustering of individuals and power law distributions of vegetation patches are not a general property of all ecosystem [e.g., see Caylor et al., 2003]. The dynamic
Figure 2. Vegetation map of the San Felice salt marsh obtained from CASI data collected on 29 September 2002 on the San Felice salt marsh. The classification was produced by use of the spectral angle classifier.
3 of 12
W06D06
MARANI ET AL.: OXYGEN-LIMITED VEGETATION
W06D06
Figure 3. Probability of exceedance of patch area for vegetation clusters in the San Felice salt marsh. origins and the relevance of the observed properties of the patch size distribution in intertidal vegetation are investigated by Marani et al. [2006] through a simple stochastic vegetation model describing the dynamics of a single species reproducing by clonal growth (the dominant mechanism in perennial halophytic species [e.g., Cronk and Fennessy, 2001]). The model [Durrett and Levine, 1994] is defined by the following rules: (1) the 2-D domain is initialized with a random (spatially uncorrelated) distribution of plants; (2) at every time step, plants die with probability g; (3) empty sites neighboring surviving plants are colonized by new propagules with probability l. Marani et al. [2006] show that power law patch size distributions, symptoms of long-range correlation, arise even when plant reproduction operates at a local scale (e.g., through propagules) only for very selected ratios of growth to death rates (Figure 4). This observation is particulary suggestive with
reference to the ‘‘all-species’’ cluster area probability distribution in Figure 2, as halophytic species may be collectively described by a single-species model adopting average, representative, values of the rates of birth and death. The observed scaling form of the cluster area probability distributions for each distinct species is not necessarily implied by a power law all-species distribution, as the former also involves the effects of interspecific competition, and awaits further modeling interpretations. The above analyses of remotely sensed species distributions nevertheless strongly suggest that a scale-invariant spatial distribution of species is far from inevitable and carries the signature of the governing ecohydrological processes. [12] The spatial heterogeneity of ecosystem properties also most likely contribute to the overall spatial arrangement of marsh plants. In particular, soil topography and characteristics importantly influence soil aeration, and thus have a
Figure 4. Modeled steady state vegetation distributions and the corresponding probability of exceedance of cluster area. The parameter sets used to produce these results are (a) l = 0.3000, g = 0.4000 and (b) l = 0.3995, g = 0.4000. 4 of 12
W06D06
MARANI ET AL.: OXYGEN-LIMITED VEGETATION
Figure 5. Typical soil elevations for each vegetation and study marsh (A, San Felice; B, Riga´; C, Salina Nord; D, Palude Maggiore). Mean and standard deviation intervals are indicated [after Silvestri et al., 2005]. role in determining the spatial distribution of salt-marsh plants. As discussed in the Introduction, the traditional view holds that the presence of a given species is dictated by the local hydroperiod. However, recent field observations contradict this tenet [Bockelmann et al., 2002; Silvestri et al., 2005]. As an example, Figure 5 summarizes soil elevation and vegetational observations by Silvestri et al. [2005] at a large number of sampling points within the marshes of Figure 1. The observational distributions of soil elevation conditioned to the presence of different vegetation species indeed show that all the observed species, with the exception of Juncus, present a strong dependence on soil elevation (and thus the associated hydroperiod). However, the same sequence of vegetation species with increasing soil elevation is characterized by a varying vertical shift at different marshes, suggesting that the same species experience different hydroperiods in different marshes. Silvestri et al. [2005] also consider the possibility that because of tidal propagation and dissipation effects, different soil elevations be associated to similar values of the hydroperiod. They use a finite element hydrodynamic model of the Venice lagoon to compute the tidal regimes at the study marshes and show that even when tidal propagation is accounted for, the same species experiences very different hydroperiods at different sites. It must therefore be concluded that the hydroperiod cannot justify the differences in characteristic elevations observed in Figure 5. A more detailed comprehension of water-soil-vegetation interactions is therefore necessary in order to clarify the mechanisms controlling geomorphological and ecological coevolution in wetland environments. In particular, the detailed study of subsurface saturated/unsaturated water flow, forced by tidal fluctuations and surface evapotranspiration, can provide a better understanding of the interplay between salt-marsh flooding, soil elevation, and soil oxygen availability.
4. Interaction Between Subsurface Flow and Plant Transpiration [13] When the marsh surface is not flooded, groundwater flow into or from the soil is forced by the changing water levels in the channel network incising the marsh and follows quasi-horizontal saturated paths. When flooding occurs,
W06D06
vertical infiltration from the surface and through the uppermost unsaturated soil tends to completely saturate the upper soil layers. Under these conditions, an aerated soil zone can exist between the water table and the saturated surface for prolonged periods of time only if plant water uptake is capable of balancing infiltration from the surface. Chapman [1938] was likely the first to observe, through the use of buried gas traps, that an aerated soil layer may indeed be able to persist even under flooded conditions. He also noted a correlation between the depth of such a layer and the typical depth of halophytic plant roots, but left the question open as to whether the presence of the roots is the cause or the effect of the presence of the aerated layer. Subsequent work confirmed and extended field observations of a buried aerated layer at different sites, though the processes giving rise to its were not clarified [Chapman, 1940; Stevenson and Emery, 1958; Clarke and Hannon, 1969]. More recently and in an unrelated manner, Dacey and Howes [1984] suggested, through laboratory and field observations, that root water uptake may control the water table movement in Spartina alterniflora marshes. [14] Theoretical and numerical characterizations of saltmarsh water table dynamics were initially focused on saturated flow [e.g., Harvey et al., 1987; Li et al., 1997, 2000] and neglected the all-important (in an ecohydrological perspective) dynamics in the unsaturated layer. The first quantitative modeling description of ecohydrological interactions in the unsaturated soil layer was provided by Ursino et al. [2004]. Numerical simulations of the saturated-unsaturated subsurface flow dynamics in an ideal salt marsh driven by tidal fluctuations and evapotranspiration enabled the identification of the conditions leading to the establishment of preferentially aerated subsurface zones. The same system configuration was subsequently adopted by Wilson and Gardner [2005], who explored different boundary conditions for the subsurface flow, and by Li et al. [2005], who included a description of the air phase dynamics. However, a quantitative and realistic description of such dynamics (including the important effects of soil-atmosphere air exchanges) has yet to be achieved and further studies are required in this direction. [15] Previous analyses are here improved by (1) incorporating more realistic soil characteristic representations, (2) incorporating different possible boundary conditions (also compared to the work of Wilson and Gardner [2005] and Marani et al. [2005]), (3) accounting for a simple, yet physically representative, vertical distribution of root water uptake within the soil, and (4) more realistically describing the different hydrologic regimes in nonvegetated tidal flats (areas which, in many intertidal environments including the Venice Lagoon, lie below mean sea level and only emerge during low tides) versus vegetated salt marshes. 4.1. Model Setup [16] All the simulations refer to a two-dimensional cross section of an idealized marsh. Under these conditions the water flow in the soil is governed by the 2-D Richards’ equation, written here in pressure head form in the (x, z) plane:
5 of 12
sðSw Þ
@y ¼ r � ½Ks Kr ðSw Þðry þ hz Þ þ qs @t
ð1Þ
W06D06
MARANI ET AL.: OXYGEN-LIMITED VEGETATION
Figure 6. Schematic representation of the model domain. No-flux boundary conditions are imposed on boundaries AF and FE. A hydrostatic vertical pressure distribution is imposed on boundary DE. A pressure value corresponding to the instantaneous tidal level is specified on CD. Boundary conditions on BC implement the possible existence of a seepage face during ebb. Boundary conditions on AB impose flux or pressure head depending on the instantaneous marsh submersion/emersion condition. An outgoing water flux corresponding to root water uptake is specified in the soil layer within 30 cm from the marsh surface. where s(Sw) = SwSs + f@Sw/@y, Sw(y) is water saturation, Ss is the aquifer specific storage coefficient, f is porosity, y is pressure head, r = (@/@x, @/@z) is the gradient operator, Ks is the saturated hydraulic conductivity tensor, represented in our case by a diagonal matrix with elements Kx and Kz, the saturated hydraulic conductivity coefficients in the coordinate directions (assumed to coincide with the principal directions of anisotropy). Kr(Sw) is the relative hydraulic conductivity function, hz = (0, 1)T, z is the vertical coordinate directed upward, and qs represents distributed source or sink terms (volumetric flow rate per unit volume, e.g., due to root water uptake). Numerically, the equation is solved by means of a triangle-based finite element simulator originally developed by Paniconi and Putti [1994]. The model employs linear basis functions for the spatial discretization and a weighted finite difference approach for time stepping. The code handles temporally and spatially variable boundary conditions, including seepage faces and atmospheric inputs, and heterogeneous material properties and hydraulic characteristics. Equation (1) is highly nonlinear due to the pressure head dependencies in the storage and conductivity terms, and is linearized in the code using either Picard or Newton iteration [Paniconi and Putti, 1994]. Efficient heuristic time stepping control is used to increase the robustness of the simulator and ensure practical convergence of the iterative schemes in all conditions. [17] The geometrical setting adopted is similar to that of Ursino et al. [2004] and considers an idealized marsh represented by a 10 m wide and 5 m deep rectangular
W06D06
vertical cross section surrounded by two 1.3 m deep channels. A sketch of the computational domain is shown in Figure 6. Note that due to symmetry, only half of the marsh domain is represented. The boundary conditions are as follows. Zero flux boundary conditions are imposed on segment FA (the axis of symmetry). We assume a sinusoidal behavior of the tidal excursion with an amplitude of 2 m and a period of T = 12 hours, values that are typical of a microtidal to mesotidal system. When the tidal level is higher than the soil elevation, so that the surface is completely flooded, pressure head values corresponding to the current water level are assigned to the surface AB. When the water level falls below the soil surface, an assigned flux is imposed to model surface evaporation or root water uptake (see detailed discussion below). For a more accurate representation of the draining periods, we impose on segment BC a dynamic seepage face boundary condition. This nonlinear condition is implemented in the code as a variant of the procedure proposed by Cooley [1983], whereby the position of the seepage face exit point is automatically adjusted during the simulation at every nonlinear iteration. The potential exit point list is dynamically updated to consider the varying tide levels in the channel. The boundary CD is subject to variable in time Dirichlet conditions, corresponding to the current tidal height. Segment DE is subjected to a hydrostatic vertical pressure distribution that follows the tide dynamics. This is an exact condition only if this boundary is not too close to the marsh, where flow lines may have an appreciable curvature (thus leading to a nonhydrostatic vertical distribution of pressure). Deviations from the hydrostatic assumption are however deemed to be small, particularly for low hydraulic conductivities, and should not affect the overall aeration patterns computed by the model. Finally, the bottom boundary EF is considered impermeable and its assumed depth was tested to be large enough so as to negligibly influence the solution in the unsaturated zone. [18] Soil characteristics are specified using the van Genuchten model providing the relative hydraulic conductivity as a function of soil saturation [van Genuchten, 1980]: Sw ðyÞ ¼ ð1 Swr Þð1 þ bÞ m þSwr Sw ðyÞ ¼ 1 Kr ðyÞ ¼ ð1 þ bÞ m=2 ½ð1 þ bÞm bm Kr ðyÞ ¼ 1
y