J. Geogr. Sci. 2010, 20(4): 483-494 DOI: 10.1007/s11442-010-0483-4 © 2010
Science China Press
Springer-Verlag
Spatial patterns and driving forces of land use change in China during the early 21st century LIU Jiyuan1, ZHANG Zengxiang2, XU Xinliang1, KUANG Wenhui1, ZHOU Wancun3, ZHANG Shuwen4, LI Rendong5, YAN Changzhen6, YU Dongsheng7, WU Shixin8, JIANG Nan9 1. Institute of Geographic Sciences and Natural Resources Research, CAS, Beijing 100101, China; 2. Institute of Remote Sensing Applications, CAS, Beijing 100101, China; 3. Chengdu Institute of Mountain Hazards and Environment, CAS, Chengdu 610041, China; 4. Northeast Institute of Geography and Agroecology, CAS, Changchun 130012, China; 5. Wuhan Institute of Geodesy and Geophysics, CAS, Wuhan 430077, China; 6. Cold and Arid Regions Environmental and Engineering Research Institute, CAS, Lanzhou 730000, China; 7. Nanjing Institute of Soil Science, CAS, Nanjing 210008, China; 8. Xinjiang Institute of Ecology and Geography, CAS, Urumqi 830011, China; 9. Nanjing Institute of Geography and Limnology, CAS, Nanjing 210008, China
Abstract: Land use and land cover change as the core of coupled human-environment systems has become a potential field of land change science (LCS) in the study of global environmental change. Based on remotely sensed data of land use change with a spatial resolution of 1 km × 1 km on national scale among every 5 years, this paper designed a new dynamic regionalization according to the comprehensive characteristics of land use change including regional differentiation, physical, economic, and macro-policy factors as well. Spatial pattern of land use change and its driving forces were investigated in China in the early 21st century. To sum up, land use change pattern of this period was characterized by rapid changes in the whole country. Over the agricultural zones, e.g., Huang-Huai-Hai Plain, the southeast coastal areas and Sichuan Basin, a great proportion of fine arable land were engrossed owing to considerable expansion of the built-up and residential areas, resulting in decrease of paddy land area in southern China. The development of oasis agriculture in Northwest China and the reclamation in Northeast China led to a slight increase in arable land area in northern China. Due to the “Grain for Green” policy, forest area was significantly increased in the middle and western developing regions, where the vegetation coverage was substantially enlarged, likewise. This paper argued the main driving forces as the implementation of the strategy on land use and regional development, such as policies of “Western Development”, “Revitalization of Northeast”, coupled with rapidly economic development during this period. Keywords: land use change; spatial pattern; driving forces; the early 21st century; China
Received: 2009-10-26 Accepted: 2009-12-29 Foundation: National Basic Research Program of China, No.2009CB421105; National Key Technology R&D Program, No.2006BAC08B00, Knowledge Innovation Program of the CAS, No.KSCX1-YW-09-01 Author: Liu Jiyuan (1947–), Professor, specialized in remote sensing of natural resources and environment, land use and cover change (LUCC) and ecological effect at macro-scale. E-mail:
[email protected]
www.scichina.com
www.springerlink.com
484
1
Journal of Geographical Sciences
Introduction
The research of Land Use and Land Cover Change (LUCC) is increasingly considered as an important component of global environmental change and sustainable development studies (Liu et al., 2003; IGBP Secretariat, 2005; Turner et al., 2007). In 1993, the two major international organizations of the International Geosphere-Biosphere Programme (IGBP) and the International Human Dimensions Programme on Global Environmental Change (IHDP) put forward the scientific research program of LUCC as the core content of global change study (Lambin et al., 1995; Turner et al., 1995; Ojima et al., 2005). And then a new scientific plan of Global Land Project (GLP) as the succession of LUCC began in 2005, which emphasized the integration and simulation of the coupled human-environment system, based on which land use and land cover change has gradually become the major concern (IGBP Secretariat, 2005; Turner et al., 2007) and a “hot spot” in the new field of land change science (LCS) (Gutman et al., 2004; McMahon et al., 2005; Turner et al., 2008; Turner and Robbins, 2008). LUCC exerts important impacts on the regional ecosystem and environment, and consequently influences global environment (Foley et al., 2005, Grimm et al., 2008). Since economic restructuring in China, land use changes have rapidly taken place and land use patterns are fairly various on spatial scale. Comparisons of processes, patterns and driving forces of land use change among different regions are considered as an effective method to investigate the temporal and spatial patterns of LUCC over the region and globe (Turner et al., 1993; Lambin et al., 1999; Liu et al., 2003). In the early 21st century, China has undergone a speedy socio-economic development, modification of industrial structure and acceleration of industrialization and urbanization. Meanwhile, a series of development strategies, including “Western Development”, “Revitalization of Northeast”, “Rising of Central China” and so on have been implemented across the nation. It resulted in remarkable changes and modifications in the spatial distribution of China’s land use. In order to quickly and accurately capture the pattern of land use change in the first five years (2000–2005) of the 21st century, we established land use datasets in 2005 with a resolution of 1:100, 000 based on Remote Sensing Information Platform of National Resources and Environment (Liu et al., 1996, 2000, 2003). High resolution remote sensing imageries were used as raw data. Based on a new dynamic regionalization, this paper aimed to figure out the spatial pattern and main drivers of land use changes on a national scale over the early 21st century. And we try to provide valuable scientific information for related researches on regional and global environmental changes.
2 2.1
Data and methods Data sources and processing methods
We used the same method as that in 2000 (Liu et al., 2003; Liu et al., 2003) to acquire the dynamics of land use in 2005. That is, land use change information was extracted by means of comparison and interpretation of 2-phase remotely sensed images in 2000 and 2005, in computer-aided interactive way. Data sets used for land use updating in 2005 included 411 Landsat TM images primarily
LIU Jiyuan et al.: Spatial patterns and driving forces of land use change in China during the early 21st century
485
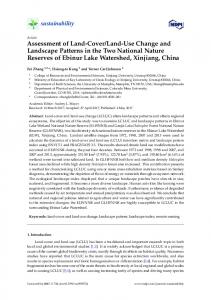
from 2004/2005, with CCD images from CBERS-2 as a supplement in the uncovered area. Meanwhile 508 Landsat TM images of 1999/2000 were adopted as reference for comparison. Before the interpretation, two periods of remote sensing images were geo-referenced using 1:50,000 topographic maps. And the Root Mean Squared Error (RMS error) of geometric rectification was less than 1.5 pixels (or 45 m). In total, the vector data of land use change include 221752 polygons containing land conversion information from 2000 to 2005. In contrast to the field work, the overall identification accuracy was over 95%, among which the accuracy of cropland can reach 99%, while 98% for grassland, forest and built-up land (Figure 1).
Figure 1
Land use interpretation map of China in 2005
We developed a new technique for data fusion that converts vector data into a series of grid data with 1 km×1 km resolution without destroying the acreage information (Geist et al., 2001; Liu et al., 2001). The method includes three steps: firstly, we build up a standard grid frame with vector format and each grid cell with 1 km×1 km is identified with a unique ID; secondly, we use the frame to intersect with the input vector data to group the input information into each cell; finally, we provide a summary of area, length, etc. for each cell group by class or level. In this study, we used the same method to process the land use change data. Each cell contains the land transformation information, then the grid raster data was up-scaled to 10 km×10 km without lowering precision (Figure 2).
486
Journal of Geographical Sciences
* The Legend represents the net change area (hm2) in each 10 km×10 km grid cell, i.e. the difference between increased area and decreased area of this land use type
Figure 2
2.2
Land use changes of main types in the early 21st century
Model and method
Regional differences can be weighed by means of Land Use Dynamic Degree (Liu et al., 2003), the formula is as follows, ⎧⎪ n S = ⎨∑ ΔSi − j / Si ⎪⎩ ij
(
⎫
)⎪⎬ × (1/ t ) × 100% ⎪⎭
(1)
where Si is the area of land type i in the beginning of the period, ΔSi–j is the total area of land type i converted into other types. t is the study period; and S is the land use dynamic degree in the period of t. The model is mainly used for land use change measurement of a single type of land. The paper focused on 9 types of main land use conversions among cropland, woodland, grassland, water body and built-up land. The dominated conversion in the grid of 10 km × 10 km was identified as the conversion type of the grid. Therefore, land use dynamic classification map was generated. In order to reveal the characteristics of land use changes from 2000 to 2005 at the beginning of the 21st century, comparison of the land use changes between the recent 5 years and
LIU Jiyuan et al.: Spatial patterns and driving forces of land use change in China during the early 21st century
487
the 1990s has been carried out, and it turns out that great changes have taken place in this period. So we employed a new geographical regionalization system to depict land use changes with spatial grid of 10 km×10 km. Meanwhile, the regionalization method in the year of 2000 was also adopted as reference (Liu et al., 2003), which follows the primary principles: (a) land use conversions are consistent in the same regionalization; (b) the succession of land use change for neighboring regions was considered, involving topographical and macroeconomic differences; (c) land use change and natural/socioeconomic conditions should be consistent in a certain region. Fifteen zones of land use changes were generated to characterize the land use patterns in the first 5 years of the 21st century (Figure 1), without considering the administrative boundaries (Figure 3).
Figure 3
China’s land use change and its dynamic regionalization map in the early 21st century
3 General characteristics and spatial pattern of land use change in the first 5 years of the 21st century The main characteristics and spatial distribution of land use change in 2000–2005 were as follows: (1) The area of cultivated land decreased by 68.65×10⁴ hm2, with a decrease of 94.99×10⁴ hm2 in paddy field and an increase of 26.34×10⁴ hm2 in dry land. In general, traditional farming regions such as southeastern coastal area and Huang-Huai-Hai Plain had been undergoing a shrinkage in cultivated land, and decrease in paddy land area was more significant. There was a slight increase of cropland area in farming-grazing transitional zone, farming-forest transitional zone, and oasis across Northeast China, Northwest China and North China. The decrease of cultivated land was mainly derived from the occupancy for construction, while the increase was due to the reclamation of unused land, bottomland of rivers and lakes. Therefore, the overall quality of cultivated land in China was declining. (2) There was an increase of 170.53×10⁴ hm2 in built-up land, which was the most dominant conversion during the first 5 years of the 21st century. The increase of built-up land was
488
Journal of Geographical Sciences
mainly derived from the occupancy of cultivated land (about 127.60 × 10⁴ hm2), about 75% of the newly developed built-up land. The expansion of built-up land concentrated in eastern China. Among them, the southeast coastal areas and plain region in mainland, such as the Huang-Huai-Hai Plain, Yangtze River Delta, Pearl River Delta, the central area of Gansu Province, Sichuan Basin and Urumqi-Shihezi Region as well, are the hot spots for urban sprawl. (3) Woodland increased by 23.48×10⁴ hm2, including forest with canopy cover greater than 30 %, shrub, woods with canopy cover between 10%–30% and others. Unrecognizable young plantation on remote sensing images was excluded from this study. The increase of woodland was distributed in Guizhou, Chongqing, Shaanxi, Ningxia and southwestern mountains of Inner Mongolia. Woodland decreased in the east of the country, such as provinces of Zhejiang, Fujian, Jiangxi, Guangdong and Jilin. Some 35% of decreased woodland was used for cultivated land, while 36% of that was converted into grassland. (4) There was a decrease of 118.61 × 10⁴ hm2 in grassland that occurred in central steppe of Inner Mongolia, oasis in desert of Xinjiang, farming-grazing transitional zone of the Loess Plateau as well as Guizhou and Chongqing in western China. The proportion of grassland reclaimed to farmland accounted for more than 48% of all the reclamation practices. The grassland expansion was mainly due to the implementation of the “Grain for Green” policy in southern Gansu, northern Shaanxi and northern part of Sichuan Basin. (5) The area of water body increased by 16.22×10⁴ hm2. A significant decline in water body area took place in northern China, such as the Northeast China Plain, Beijing-Tianjin-Hebei Region, Inner Mongolia Plateau and Northwest China. However, there was an obvious expansion of water body in Huang-Huai Plain and middle and lower Yangtze River Plain, especially in Dongting Lake Basin. (6) The unused land decreased by 19.18×10⁴ hm2, concentrated in northern China, e.g. northwest of Qinghai province, northern Xinjiang and Gansu, Northeast China Plain. Over 42% of unused land was reclaimed for farmland. Unused land area considerably increased in northern part of Yinshan Mountain because of the grassland degradation. The degraded grassland over the whole country accounted for 67% of the newly increased unused land area.
4
Regional characteristics and spatial pattern of land use change
Land use change during the first 5 years of the 21st century showed apparently regional variations. The results indicated that the built-up areas were significantly expanded in the Huang-Huai-Hai Plain, southeastern coastal areas (especially Beijing-Tianjin-Hebei Region, Yangtze River Delta and Pearl River Delta) and Sichuan Basin, where most built-ups were converted from high-quality arable land. However, arable land was returned to woodland and grassland in mountainous areas of North China, Loess Plateau, Qinling Mountains and farming-grazing transitional zone in Inner Mongolia. Grassland was reclaimed into arable land in eastern Inner Mongolia, northwestern arid area and the oasis edge of traditional oasis agricultural region. In the Qinghai-Tibet Plateau, little changes of land use had occurred, except regional expansion in watershed. The spatial pattern and transition of different land use types are shown in Tables 1 and 2.
LIU Jiyuan et al.: Spatial patterns and driving forces of land use change in China during the early 21st century Table 1 Code
489
Main characteristics and socio-economic indices of various land-use zones in China Name
Land use features
1
Northeast Da and Xiao Hinggan Mts–woodland/grassland to arable land conversion zone
Woodland (69%) and grassland (15%) are the main land use types; dry land (12%) dominates the arable land.
2
The eastern part of Northeast China– woodland/grassland to arable land conversion zone
Woodland (69%) and arable land(20%) are the main land use categories, dry land dominates the arable land.
3
Northeast China Plain–dry land and paddy field bi-directional conversion zone
Densely-distributed arable land includes 47% of dry land, 14% of paddy land, and 21% of woodland.
4
Important agricultural zone, accounting for 32% of naHuang-Huai-Hai Plain, tional arable land, includes Yangtze River Delta– 42% of dry land and 13% of arable land to built-up paddy land. The built-up area conversion zone occupies 53% of national construction
5
Arable land densely distribSichuan Basin–arable uted, among which 30% is land to built-up area covered by paddy field and conversion zone 46% by dry land. Farming-grazing transitional zone in Northeast China. The main types are arable land (38%) and grassland (36%), and the main type of arable land is dry land, which occupied 36% of the whole area. Oasis agriculture, grassland and desert region, grassland (36%) and unused land (54%) account for 28% and 65% of the total grassland and unused land in China, respectively.
6
Central part of Northeast China–grassland to arable land conversion zone
7
Northwest China –reclamation and abandonment of arable lands coexisting zone
8
Central China Plain –water body fluctua- Water body (12%) and paddy tion and built-up areas field (37%) are densely disexpansion coexisting tributed. zone
9
Woodland (71%) and arable Southeast hilly arland (20%) densely distribeas–woodland to uted, among which paddy arable land conversion field and arable land coexist zone with an area ratio of 3:2.
Average Features of land use change in the first Population GDP in the 5 years of the 21st century density same zone The main conversion type is woodland to grassland, followed by grassland to arable land. Grassland was decreased by 47.9 khm2 in 5 years, resulting from 0.20 7.61 grassland to woodland (82.8 khm2), woodland to grassland (67.1 khm2), grassland to arable land (33.7 khm2) and arable land to grassland (26.8 khm2). Conversion of woodland to arable land or grassland dominates. Woodland is decreased by 35.2 khm2, including 36.3 1.12 112.82 khm2 of woodland to arable land, 35.9 khm2 of woodland to grassland and 2 21.8 khm of arable land returned into woodland or grassland. Conversion of paddy land to dry land took place over the whole Sanjiang Plain, totaling up to 176.6 khm2;arable 2.53 231.07 land increased by 48.8 khm2, including 2 52.1 khm of grassland converted to arable land. The expansion of built-up areas is conspicuous, through occupying high-quality arable land. The arable land is decreased by 798 khm2, contributing 86.58% of land area to urban 5.30 503.38 sprawl, while the increase of built-up areas totals to 867.1 khm2, equivalent to 57.74% of occupied arable land by expansion of built-up areas over the whole nation. Arable land decreased by 92.7 khm2 and 66 khm2 of built-up areas are formed. 68.31% of diminished arable 6.15 335.61 land is occupied by built-up areas, while 30.19% of decreased arable land is turned into woodland and grassland. Arable land is increased by 236.3 khm2. Grassland is reclaimed mainly along the farming-grazing transitional 0.81 56.99 zone. 226 khm2 of grassland are reclaimed to arable and 123.5 khm2 of arable land are returned to woodland and grassland. Oasis agriculture is the major type. Large area of grassland is reclaimed to arable land. Arable land is increased by 0.11 7.62 815.5 khm2 which occupies 46.11% of the whole country’s area, and 601.2 khm2 of grassland are reclaimed. Arable land returned to lake and expanding of built-up areas are obvious. Water areas are increased by 91.3 4.49 317.57 khm2, which contains 74.8 khm2 of conversion from arable land to water areas. The expansion of built-up areas is increased by 36.4 khm2. Arable land returned to woodland (21.6 khm2) and grassland and woodland converted to arable land (20.1 khm2) both exist.
2.01
82.61
To be continued
490
Journal of Geographical Sciences
Continued Code
Name
Land use features
10
Southeast coastal China–grassland to planted forest bi-directional conversion zone
Paddy field and woodland distributed in this region occupy12% and 67% of those across China, respectively. Planted and young woodland account for 44% of those in China.
11
Southwest China–grassland to woodland, arable land to woodland/grassland conversion zone
Woodland was densely distributed (56%) mainly in shrub and sparse woodland, while arable land (22%) and grassland (20%) also occupied large proportion.
12
13
14
15
Average Features of land use change in the first Population GDP in the 5 years of the 21st century density same zone The conversions between forest area and other woodland are obvious, especially for the increase of the economic forests and newly planted forests. The 2.10 114.64 area of woodland converted from grassland, the built-up sprawl and cropland decrease totals up to 27 khm2, 75.9 and 67.4 khm2, respectively. Woodland is mainly converted from grassland and arable land. The increase of woodland totals to 157.4 khm2 while the decrease of grassland is up to 165 khm2, and the arable land returned to woodland and grassland totals to 78.1 khm2.
This region is less disturbed Qinghai-Tibet Plaby human activities, covered Water areas are slightly raised; few teau–no change or by grassland (59%) and un- woodlands are converted to grassland. little change zone used land (26%). Ecological restoration is successful, especially in farming-grazing transiIt is typically ecological tional zone of Loess Plateau and North land is decreased by Western China–arable fragile region, where grass- China. Arable 2 is inland returned to land (38%), arable land 455.8 khm , while woodland 2 woodland and grass- (29%) and woodland (28%) creased by 282.4 khm . Arable land and grassland land zone interlaced. Dry land (85%) is returned to woodland 2 the main type of arable land. totals to 516.4 khm , which is 51.21% of this conversion over whole China. A part of grassland is still being reclaimed. Central rising led to arable land occuPaddy field (23%) and wood- pied by the expanding built-up area. Central China–arable areas are increased by 55.4 land (61%) are densely dis- Built-up 2 land to built-up area areas are detributed. The area ratio of khm , while arable land 2 zone paddy field to dry land is 3:1. creased by 39.6 khm . The conversion areas of arable land to built-up land are 39.0 khm2. Southeastern coastal areas–arable land to built-up conversion zone
Arable land (27%) and woodland (49%) are distributed in the southeast coastal areas. The main type of arable land is paddy field and the ratio of paddy field to dry land is 2:1.
The built-up area was largely expanded by occupying arable land in Pearl River Delta and along Xiamen City–Fuzhou City. Built-up area was increased by 337.9 khm2, while arable land area was decreased by 242.3 khm2.
1.44
59.83
0.02
0.69
1.08
39.29
3.70
270.84
6.09
1147.04
The analysis on main characteristics of land use is based on the land use data of 2000 which is from the remotely-sensed information. The data of population density and average GDP of the same zone are from statistical data of county in 2000 according to the distribution of urban residents, zonal statistics of population and GDP spatial data.
5
Driving forces of land use change in China
5.1 Expanding of built-up areas due to national macro-landuse strategy, rapid socio-economic development and urbanization With rapid socio-economic development and intensified urbanization in the 21st century, the ratio of migration from urban to rural population has been increasing in China, where the proportion of urban population increased from 36.22% in 2000 to 42.99% in 2005. GDP was raised from 9.9×10³ billion yuan in 2000 to 18.3×10³ billion yuan in 2005, increasing by
LIU Jiyuan et al.: Spatial patterns and driving forces of land use change in China during the early 21st century Table 2 Zone
Conversion matrix for land use dynamic zones (unit: 104 hm2) 1
Dry land Conversion to paddy types field 1 2 3 4 5 6 7 8 9 10 11 12 13 14 15 Total
491
0.97 1.55 54.13 8.50 0.00 4.02 0.14 0.06 0.15 0.16 0.09 0.00 0.09 0.23 0.01 69.13
3
4
Arable land to woodland/ grassland
2
Others to water area
Others to built-up area
2.68 2.18 1.76 5.73 2.82 12.35 7.06 0.40 2.16 2.31 7.81 1.52 51.64 0.23 0.19 98.16
0.24 0.76 1.56 20.57 0.19 1.93 8.24 11.80 1.56 2.41 0.18 6.86 3.75 0.43 3.29 63.53
0.73 0.62 3.21 85.10 6.60 1.90 8.08 3.68 1.93 7.59 1.76 1.17 7.67 5.57 33.77 168.65
5
6
7
8
9
Woodland Woodland Grassland Grassland Water area to arable to grass- to arable to woodland to others land land land 1.45 3.63 1.43 1.18 0.00 4.22 6.40 0.13 2.01 1.01 2.41 0.02 1.03 0.12 0.27 23.86
6.71 3.59 0.50 0.70 0.05 3.71 1.40 0.26 0.14 0.65 2.40 3.38 2.12 0.06 0.89 19.85
3.37 0.52 5.21 5.25 0.06 22.60 60.12 0.08 0.44 0.12 5.70 0.42 13.36 0.01 0.04 113.93
8.28 2.08 0.62 0.89 0.82 2.55 3.30 0.09 1.34 2.70 14.76 0.24 13.11 0.54 0.28 43.33
0.48 0.24 0.83 8.54 0.02 7.05 14.19 2.30 0.33 0.21 0.09 1.06 4.05 0.60 0.13 39.65
nearly 100%. Due to the rapid economic development and agglomeration of urban population, new spatial patterns on land use and regional development appeared during the first 5 years of the 21st century. Since 2000 and 2004, policies of “Western Development” and “Revitalization of Northeast” were carried out, respectively. Promoted by the national macro-policy, increased investment in the fixed assets and large-scale exploitation of development zones resulted in the expansion of built-up areas. Ever since the implementation of “Western Development” strategy, a great number of relevant policies have been performed in order to regulate urban construction, land management, population and labor flow, major infrastructure construction and allocation of key industries as well. The conduction of these policies apparently enlarged the built-up areas. The sustained and rapid economic development in China has promoted urban growth. A new-round fast urbanization and industrialization has occurred since 2000 during which the speed of land urbanization is higher than that of population urbanization. Per capita construction land of most cities, especially of the mid-sized or small cities in China, is more than 100 m2, which is considered as “rash advance” by experts. Advanced by “large space” planning of global and international tide, luxurious housing, large and huge construction projects lead to fast urbanization in the eastern and southeastern China, e.g. Beijing-Tianjin-Hebei Region, Yangtze River Delta and Pearl River Delta. The occupied lands are mainly high-quality farmland, especially paddy field over these regions. The undue pursuit of GDP increase and expansion of industrial parks causes a large number of high-quality arable lands being occupied. This kind of occupation mostly took place in the developed areas, especially in the main grain production zone in the Huang-Huai-Hai Plain and the southeast coastal areas (Liu et al., 2008). 5.2 The implementation of ecological restoration policy and natural forest protection project in western China caused the increase of woodland area and the improvement of regional land cover condition Ever since the implementation of “Western Development” policy, woodland area has been
492
Journal of Geographical Sciences
increased substantially in China, and newly-planted woodland is mainly converted from arable land, especially in the central part of western China, including Guizhou, Chongqing, Shaanxi, Ningxia and southwestern mountainous area of Inner Mongolia. The “Grain for Green” policy, which was enacted in the year of 2003, has entered a fully-performed stage. The main types of the arable land shrunk by ecological restoration are slope farmland and dry land distributed mainly in hilly areas with a slope greater than 25°, especially in North China and farming-grazing transitional zone of Loess Plateau. After the catastrophic flood in 1998, the Chinese government started up natural forest protection project. The management of natural forest was turned from timber production to forest protection, sustainable management and ecological rehabilitation. Natural forest protection project, as one of the six important projects approved by the State Council in the year of 2000, has been conducted in the upstream area of the Yangtze River bound by the Three Gorges Reservoir, the middle reaches of the Yellow River bounded by Xiaolangdi Reservoir and the key state-owned forest areas in Northeast China, Inner Mongolia, Xinjiang and Hainan, covering 17 provinces in total (http://www.tianbao.net.). In the mid-western region, woodland area was increased significantly due to the implementation of ecological restoration policy in western China, and the implementation of the “Grain for Green” Project also improved the regional land cover conditions. 5.3 Suitable farmland region moved northward due to climate warming, and large area of grassland was reclaimed in northern part driven by agricultural policy and agronomic technology Climate warming and the consequently accumulated temperature increase caused the conversion of traditional grassland to arable land. Especially in northern China, area of arable land kept increasing driven by the pursuit to short-term interests of local people and exterior investors, besides the climate changes. In Northeast and Northwest China, as the sensitive regions of global environmental change, increases in temperature resulted in more suitable light and heat resources for crop growth in recent years. With the encouragement of local government and the pursuit of economic benefits, large area of grassland was reclaimed to arable land. The significantly expanded arable land in Northwest China, especially in Xinjiang, can be attributed to the successful test and promotion of modern agronomic technology, the innovation and improvement in the cooperation between leading enterprises and farmers, and in tillage systems as well (Yin, 2008). Land use change can indicate the mutual effects of human and land in the same period. It is the main manifestation of the interaction between human activities and natural environment. On the one hand, land use change is limited to physical geographical environment, including climate, terrain, landform, soil, etc. On the other hand, land cover is converted from natural to anthropogenic type dominated, caused by human activities, such as deforestation, reclamation, urban sprawl and so on. However, land use change on the local scale is prone to develop well regulated by national macro-policies. Due to the enhanced realization of ecological conservation over the whole nation, land cover condition and environmental quality on local scale are significantly improved. Therefore, land use change in this period is the result of both human activities and environmental changes, among which the main driving forces are national macro- and local development policies, as well as socio-economic
LIU Jiyuan et al.: Spatial patterns and driving forces of land use change in China during the early 21st century
493
growth.
6
Discussion and conclusions
LUCC is the most direct manifestation of the interplay between human activities and natural environment. The spatial distribution of land use change represents the intensity and pattern of the relationship between human and earth on various scales during this period. Based on Remote Sensing Information Platform of National Resources and Environment, national-scale land use change pattern was updated to reveal the temporal and spatial characteristics of China's land use change and its driving forces in the first 5 years of the 21st century. This study is fairly critical not only to better understand the mechanisms contributing to the land use change, but also to further integrate the researches on “processes” and “patterns” in geographical sciences. (1) In the first 5 years of the 21st century, land use changes was characterized by highly intensified and accelerated alterations, and significant spatial variations as well, induced by regional exploitation strategy and rapid socio-economic development. Land use changes are transformed from human-dominated exploitation, such as reclamation, built-ups sprawl etc., to equally-emphasized development and ecological conservation. The ecological environment was recovered in the mid-western region, where natural land coverage on regional scale was significantly improved due to the implementation of “Western Development” policy. (2) The general trend of land use change at national scale during 2000–2005 was the reduction of arable land area, especially of paddy land area in southern China; built-up area indicated a rapid increase and occupied large area of high-quality cultivated land, especially in the southeast coastal areas, inland plain and traditional farming zones; to some extent, woodland area was increased as a result of the “Grain for Green” Project; grassland was decreased as the conversion from grassland to cropland. (3) The implementation of a series of socio-economic and regional development policies resulted in accelerated growth of the socio-economy and hence caused the considerable changes in land use. The forest area presented a rapid increase since the implementation of the “Grain for Green” policy and “Western Development”. At the same time, large area of grassland was reclaimed to cropland because of the climate change and pursuit of comparative advantage in Northwest and Northeast China. Therefore, land use change in this period is the combined result from human activities and climate changes. Among them, the national macro-policy and regional development policies, socio-economic development were the main driving forces contributing to land use change. (4) National-scale land use/land cover change information in the early 21st century was updated and integrated based on the high-resolution remotely sensed images, which can reveal the temporal-spatial characteristics and driving forces of land use change. This study helps to promptly find out the distinguished problems and main contradiction of land use, and it can also provide the scientific basis for land resources optimization and ecological environmental renovation across China.
References Foley J A, DeFries R, Asner G P et al., 2005. Global consequences of land use. Science, 309: 570–574.
494
Journal of Geographical Sciences
Geist H J, Lambin E F, 2001. What drives tropical deforestation? A meta-analysis of proximate and underlying causes of deforestation based on subnational case study evidence (=LUCC Report Series; 4). LUIC International Project Office, Louvain-la-Neuve, 116. Grimm N B, Faeth S H, Golubiewski N E et al., 2008. Global change and the ecology of cities. Science, 319: 756–760. Gutman G, Janetos A C, Justice, C O et al., 2004. Land Change Science: Observing, Monitoring and Understanding Trajectories of Change on the Earth's Surface. Dordrecht: Kluwer Academic Publishers. IGBP Secretariat. GLP, 2005. Science Plan and Implementation Strategy. IGBP Report No. 53/IHDP Report No. 19, 2005, Stockholm, 64. Lambin E F, Baulies X, Bockstael N et al., 1995. Land-use and land-cover change (LUCC): Implementation strategy. A core project of the International Geosphere–Biosphere Programme and the International Human Dimensions Programme on Global Environmental Change. IGBP Report 48. IHDP Report 10. IGBP, Stockholm, 125. Lambin E F, Baulies X, Bockstael N et al., 1999. Land-Use and Land-Cover Change (LUCC) Implementation Strategy (=IGBP Report48/IHDP Report10). Liu Jiyuan, 1996. Macro-scale Survey and Dynamic Study of Natural Resources and Environment of China by Remote Sensing. Beijing: China Science and Technology Press. (in Chinese) Liu Jiyuan, Buheaosier, 2000. Study on spatial-temporal feature of modern land-use change in China: Using remote sensing techniques. Quaternary Sciences, 20(3): 229–239. (in Chinese) Liu J Y, Liu M L, Zhuang D F et al., 2003. Study on spatial pattern of land-use change in China during 1995–2000. Science in China: Series D, 46(4): 373–384. Liu Jiyuan, Zhang Zengxiang, Zhuang Dafang, 2003. A study on the spatial-temporal dynamic changes of land-use and driving forces analyses of China in the 1990s. Geographical Research, 22(1): 1–12. (in Chinese) Liu Mingliang, Tang Xianming, Liu Jiyuan et al., 2001. Research on scaling effect based on 1km grid cell data. Journal of Remote Sensing, 5(3): 183–189. (in Chinese) Liu Yansui, Wang Lijuan, Long Hualou, 2008. Spatio-temporal analysis of land-use conversion in the eastern coastal China during 1996–2005. Journal of Geographical Science, 18: 274–282. Lu Dadao, Yao Shimou, Li Guoping et al., 2007. Comprehensive analysis of the urbanization process based on China’s conditions. Economic Geography, 27(6): 883–887. (in Chinese) McMahon G, Benjamin S P, Clarke K et al., 2005. Geography for a Changing World: A Science Strategy for the Geographic Research of the U.S. Geological Survey, 2005–2015, Sioux Falls. SD: U.S. Geological Survey Circular, 1281: 1–76. Ojima D, Lavorel S, Graumlich L et al., 2005. Terrestrial human-environment systems: The future of land research in IGBP II. IGBP Global Change Newsletter, No.50: 31–34. Rindfuss R, Walsh S, Turner B L et al., 2004. Developing a science of land change: Challenges and methodological issues. PNAS, 101: 13976–13981. Turner B L, Lambin E F, Reenberg A, 2007. The emergence of land change science for global environmental change and sustainability. P Natl Acad Sci USA, 104: 20666–20671. Turner B L, Lambin E F, Reenberg A, 2008. Land change science special feature: The emergence of land change science for global environmental change and sustainability (vol 104, pg 20666, 2007). P. Natl. Acad. Sci. USA, 105: 2751–2751. Turner B L, Moss R H, Skole D L et al., 1993. Relating land use and global land-cover change: A proposal for an IGBP-HDP core project. Report from the IGBP-HDP Working Group on Land-Use/Land-Cover Change. (=IGBP Report 24/HDP Report 5). Stockholm: Royal Swedish Academy of Sciences. Turner B L, Robbins P, 2008. Land-change science and political ecology: Similarities, differences, and implications for sustainability science. Annu. Rev. Env. Resour., 33: 295–316. Turner B L, Skole D, Sanderson S et al., 1995. Land Cover Change Science/Research Plan, IGBP Report No.35, HDP Report 7. IGBP of the ICSU and HDP of the ISSC, Stockholm and Geneva. Yin Xiaojun, 2008. Analysis on the change of land use by remote sensing technology in Manas county. Journal of Shihezi University (Natural Science), 26(4): 402–406. (in Chinese)