MARINE ECOLOGY PROGRESS SERIES Mar Ecol Prog Ser
Vol. 294: 213–226, 2005
Published June 9
Spatial patterns in the ovigerous Callinectes sapidus spawning migration: results from a coupled behavioral-physical model Sarah D. Carr1,*, James L. Hench1, Richard A. Luettich Jr1, Richard B. Forward Jr2, Richard A. Tankersley3 1
Institute of Marine Sciences, University of North Carolina at Chapel Hill, 3431 Arendell Street, Morehead City, North Carolina 28557, USA
2
Nicholas School of the Environment and Earth Sciences, Duke University, 135 Duke Marine Lab Road, Beaufort, North Carolina 28516, USA
3
Department of Biological Sciences, Florida Institute of Technology, 150 West University Boulevard, Melbourne, Florida 32901, USA
ABSTRACT: Ovigerous blue crabs Callinectes sapidus use ebb-tide transport (ETT), a vertical migratory behavior in which crabs ascend into the water column during ebb tides, to migrate from estuarine adult habitats to coastal larval release locations. We have developed a detailed behavioral model of ovigerous blue crab ETT from previous laboratory and field studies and coupled this model to a hydrodynamic model of the Beaufort Inlet region of North Carolina. We have simulated the trajectories of migratory ovigerous crabs in the region and determined spatial patterns in migratory success, migratory speeds, the residence times of crabs in different regions of the estuary, and potential larval-release locations. Highly active crabs can start their migration from almost anywhere in the estuary and reach suitable larval-release locations within a typical 4 d migratory period, whereas crabs with lower activity levels can only reach suitable larval-release locations if they start their migration in the lower-to-mid estuary. Migratory speeds in the estuary range from 8 km d–1. Crabs with lower activity levels are resident in the mid-to-upper estuary for relatively long periods of time, whereas highly active crabs are resident in the lower estuary and coastal ocean for most of the migratory period. Larval release is predicted to occur throughout the estuary and in the coastal ocean within ~5 km of Beaufort Inlet. Fisheries managers can use these spatial patterns to determine management strategies (e.g. spatial closures to fishing) that will protect migratory blue crab spawning stock in tidal regions effectively. KEY WORDS: Blue crab · Callinectes sapidus · Spawning migration · Selective tidal-stream transport · Ebb-tide transport · Larval release · Coupled biological-physical model · Beaufort Inlet Resale or republication not permitted without written consent of the publisher
Many estuarine and marine species, such as the blue crab Callinectes sapidus, make long-distance migrations between habitats and regions. For many of these species, even species as heavily exploited and well studied as the blue crab, spatial and temporal migratory patterns are not well understood (Giske et al. 2001, Pelletier 2001, Miller 2003). Historically, the pri-
mary sources of information on migratory patterns have been mark-and-recapture studies and observations of spatial and temporal changes in abundance by fishermen and scientists (Millikin & Williams 1984, Pelletier 2001). These studies have been unable to address many questions about modes of migration, migratory speeds, residence times in different regions and the influence of hydrographic processes on migratory success. With the recent development of miniatur-
*Email:
[email protected]
© Inter-Research 2005 · www.int-res.com
INTRODUCTION
214
Mar Ecol Prog Ser 294: 213–226, 2005
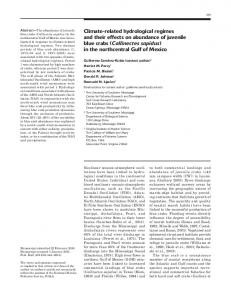
ized ultrasonic transmitters (Wolcott 1995, Freire & González-Gurriarán 1998), gathering high-resolution data on migratory trajectories is possible. It is still prohibitively costly and time-intensive to track large numbers of individuals for long periods of time, however. One way to expand the knowledge gained from limited field sampling is to couple the observed migratory patterns of organisms that utilize water currents to migrate with hydrodynamic models. With these coupled behavioral-physical models, the transport of organisms can be simulated from a wide variety of locations under a variety of hydrographic conditions (e.g. Rothlisberg et al. 1983, Werner et al. 1993, Hare et al. 1999, reviewed in Giske et al. 2001 and Werner et al. 2001). The spatial and temporal migratory patterns derived from these modeling studies can be used to determine effective means of managing exploited migratory stocks. In this study, we used a coupled behavioral-physical model to examine spatial patterns in the ovigerous blue crab spawning migration in the shallow, tidally driven estuarine system behind Beaufort Inlet, North Carolina (Fig. 1a). This system is typical of many estuary-inlet systems along the Atlantic and Gulf coasts of the United States and consists of 4 sub-estuaries, Bogue Sound, the Newport River Estuary, the North River Estuary and Back Sound, connected to the coastal ocean by Beaufort Inlet (Fig. 1b). In these systems, adult blue crabs mate in the upper regions of the estuaries, and inseminated females migrate to the lower regions of the estuaries and coastal ocean to oviposit and release larvae (reviewed in Van Engel 1958 and Millikin & Williams 1984). In the final phase of this migration, ovigerous crabs with mature embryos use ebb-tide transport (ETT), a vertical migratory behavior in which organisms ascend into the water column during ebb tides and remain at or near the bottom during flood tides, to migrate seaward (Tankersley et al. 1998, Forward et al. 2003, Carr et al. 2004, Hench et al.
2004). This behavior may decrease the energetic costs of migration in areas with strong tidal currents (Weihs 1978, Metcalfe et al. 1990) and provide a means of orienting toward coastal areas suitable for larval release (Forward & Tankersley 2001). Females release larvae during morning ebb tides, and larvae are transported offshore in near-surface waters (Provenzano et al. 1983, Epifanio et al. 1984). Offshore larval development is advantageous because it reduces exposure to predators (Morgan 1990) and harmful low-salinity conditions (Sandoz & Rogers 1944, Costlow & Bookout 1959). Female blue crabs are capable of producing multiple egg clutches from stored sperm, and they may continue to use ETT to migrate seaward (Hench et al. 2004) or return to estuarine areas after releasing a clutch of larvae (Tagatz 1968, Tankersley et al. 1998). Our model improves on previous hydrodynamic modeling studies of circatidal vertical migratory behaviors (e.g. Arnold & Cook 1984, Rothlisberg et al. 1996, Condie et al. 1999, DiBacco et al. 2001) by basing migratory behavior on high-resolution empirical data rather than relatively idealized behaviors.
MATERIALS AND METHODS Behavioral model. Ovigerous blue crabs migrate seaward by episodically ascending into the water column during ebb tides for passive transport down-estuary (Tankersley et al. 1998, Forward et al. 2003, Carr et al. 2004, Hench et al. 2004) and episodically walking or swimming against local currents (down-estuary) at ~0.25 m s–1 during flood tides (Carr et al. 2004). Ebbtide vertical ascents and flood-tide walking/swimming episodes are on the order of minutes (Forward et al. 2003, Carr et al. 2004), and periods between migratory episodes range from minutes to hours (Forward et al. 2003, Carr et al. 2004, Hench et al. 2004). Since crab movements are episodic, crabs travel less than half the
Fig. 1. Study location. (a) South Atlantic Bight; (b) Beaufort Inlet region of North Carolina
Carr et al.: Ovigerous blue crab spawning migration
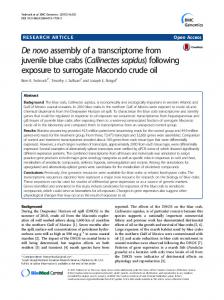
distances that passive particles would travel during ebb tides (Carr et al. 2004). Ovigerous blue crab ETT is based on an endogenous circatidal activity rhythm (Forward et al. 2003). Migratory episodes are most frequent during mid-ebb when current speeds are highest (Carr et al. 2004, Hench et al. 2004) and more frequent during the night than during the day (Tankersley et al. 1998, Carr et al. 2004, Hench et al. 2004). Migratory behavior and the duration of migratory activity vary widely among individual crabs (Forward et al. 2003, Carr et al. 2004, Hench et al. 2004) but are highest during the ~4 d prior to larval release (Forward et al. 2003, Hench et al. 2004). Larval release occurs near the beginning of morning ebb tides (Provenzano et al. 1983, Epifanio et al. 1984, Ziegler 2002), and there are fortnightly peaks in the number of crabs migrating that correspond to times when slack before ebb (SBE) occurs around sunrise (R. A. Tankersley pers. obs.). Hydrodynamic model. The depth-integrated version of the numerical hydrodynamic model ADCIRC (Luettich et al. 1992) was used to compute tidal-velocity fields for the region near Beaufort Inlet, North Carolina. ADCIRC uses a finite element method to solve the fully nonlinear equations of motion on domains discretized into linear triangular elements of varying sizes. This method of discretization permits increased resolution in regions with complex bathymetry, such as Beaufort Inlet. Circulation in the estuarine system is dominated by the M2 semi-diurnal tide (Klavans 1983) and can be described with a depth-integrated model because strong tidal currents effectively mix the water column and depths within the system are typically less than Ekman depths for the region (Klavans 1983, Luettich et al. 1999). Wind forcing is episodically important, and wind-driven currents from routine wind events are in the order of 0.1 m s–1 in the sub-estuaries (Logan 1995). These flows are generally of secondary importance to tidal circulation in most of the estuary and were not included in the present model. A complete description of the model setup is provided in Hench & Luettich (2003). The model domain encompassed the estuarine system behind Beaufort Inlet, eastern Onslow Bay and the offshore region east of Cape Lookout Bight (Fig. 1). Element dimensions ranged from < 25 m in the estuary and coastal ocean near Beaufort Inlet to > 2 km offshore (Fig. 2a). Model bathymetry was derived from high-resolution surveys by the National Oceanic and Atmospheric Administration and the University of North Carolina at Chapel Hill (Hench & Luettich 2003). The estuary is generally shallow (< 3 m), except for a few narrow navigable channels of ~5 to 15 m depth (Fig. 2b). For runs with mean tidal conditions, the model was forced at its open boundaries with elevations of the M2, M4 and M6 tidal
215
constituents and a steady residual component derived from the larger domain described in Luettich et al. (1999). When spring- and neap-tide conditions were simulated, the S2 tidal constituent, whose velocity amplitude is ~17% of the M2 velocity amplitude (Klavans 1983), was added. Maximum current speeds are ~1 m s–1 in the lower estuary and decrease with distance up the estuary due to damping by bottom friction and widening of the sub-estuaries (Fig. 2c). Both model velocity amplitude and phase corresponded well to previous observational data gathered for the region (Klavans 1983, Luettich et al. 1999). Coupling of behavioral and hydrodynamic models. The behavioral model was coupled to the hydrodynamic model by incorporating algorithms of the migratory behavior of ovigerous blue crabs into a particletracking algorithm (DROG2D; Baptista et al. 1984, Foreman et al. 1992) driven by velocity fields from the hydrodynamic model. If simulated crabs encountered a land boundary, they were tracked along the boundary
Fig. 2. Hydrodynamic model for Beaufort Inlet region. (a) Grid; (b) bathymetry; (c) maximum ebb-current speeds
216
Mar Ecol Prog Ser 294: 213–226, 2005
using the velocity component parallel to the boundary until ambient velocities transported them away from the boundary. Simulated crabs were tracked using a 2 min time step. The behavioral algorithms consisted of migratory episodes of fixed duration whose characteristics and frequency were functions of tidal (time relative to SBE) and diel (night:day) phase. When actively migrating during ebb tides, simulated crabs were transported by model currents as passive Lagrangian particles (Tankersley et al. 1998, Carr et al. 2004). When actively migrating during flood tides, simulated crabs were tracked directly against local currents (down-estuary) at a constant speed of 0.25 m s–1 (Carr et al. 2004). Simulated crabs were stationary when they were not actively migrating (Carr et al. 2004). Individual migratory episodes lasted 6 min, the median duration of observed Fig. 3. Callinectes sapidus. Number of migratory episodes per 30 min relative to migratory episodes (Forward et al. slack before ebb (SBE) for the 2 behavioral algorithms. Values from Hench et al. 2003, Carr et al. 2004). To capture the (2004) were rounded to nearest whole number for use in behavioral algorithms. variability in the frequency of migraMean + 2 SD of migratory episodes from 2 to 3 h after SBE from Hench et al. tory episodes over the course of the (2004) was 5, but the use of 6 min migratory episodes with 2 min inactive periods between limited the maximum number of ascents per 30 min in the model to 4 tidal and diel cycles, the tidal cycle was broken up into 30 min bins relative to SBE (e.g. 0.5 to 1.0 h after SBE), and the on the last day of migration and with mean tidal condidiel cycle was broken up into night (10 h) and day tions (no S2 tidal constituent). Larval-release locations (14 h) periods. The mean number and standard deviwere defined as crab locations at the end of the 4 d ation (SD) of migratory episodes for each 30 min bin for migratory period. night and day periods were derived from a field study Comparison of observed and simulated crab trajecof the frequency of vertical ascents by ovigerous blue tories: To evaluate model performance, we compared crabs tethered in Bogue Sound (Hench et al. 2004). To simulated crab trajectories and mean migratory speeds capture some of the variability in crab activity levels (± 95% CI) to the results of a tracking study of ovigerduring the ovigerous spawning migration, 2 behavioral algorithms representative of lower- and higher-activity crabs were created from the mean and the mean + 2 SD of migratory episodes for each 30 min bin (Fig. 3). These algorithms were not intended to represent the extremes of crab behavior but rather to show differences in spatial patterns arising from typical variability in crab behavior. Simulated crabs remained stationary for 2 min between consecutive migratory episodes and after they had completed the designated number of migratory episodes in each 30 min bin. Model simulations. For general model simulations, crabs started from a grid (uniform 500 m spacing) of 579 locations in the estuary (Fig. 4) at sunrise and were tracked for 4 d, the approximate duration of ovigerous blue crab ETT (Forward et al. 2003, Hench et al. 2004). Unless otherwise noted, simulations were run for Fig. 4. Callinectes sapidus. Starting locations of simulated ovigerous blue crabs and blue crab larvae migratory periods when SBE occurred around sunrise
217
Carr et al.: Ovigerous blue crab spawning migration
ous blue crabs conducted in the Beaufort Inlet region during the 2001 and 2002 spawning seasons (Carr et al. 2004). In that study, 8 ovigerous blue crabs were tracked by ultrasonic telemetry for durations and distances ranging from 4 to 37 h and 2 to 11 km. For the comparisons, simulated crabs were tracked from the same 8 starting points, started at the same phase in the tidal and diel cycles, and tracked for the same duration as observed crabs. Paired t-tests (α = 0.05) were conducted on overall crab speeds (the total distance each crab traveled divided by the total tracking duration for that crab) and crab speeds during the 4 tidal-diel phases (the distance each crab traveled during a tidal-diel phase divided by the tracking time in that tidal-diel phase for that crab) using the MATLAB Statistics Toolbox (The MathWorks, Version 3). Error estimations: To get a first-order estimate of how much of the difference between the observed and simulated crab trajectories could be attributed to errors in the hydrodynamic model, we compared currentvelocity measurements made at locations along the observed crab trajectories near Beaufort Inlet (Carr et al. 2004) to hydrodynamic model output at the same times and locations. The 8 migratory ovigerous crabs from Carr et al. (2004) were tracked for a total of 171 h, and 948 current-velocity measurements were made at 1 to 20 min intervals during this time (Carr et al. 2004). Measurements were made with a boom-mounted acoustic Doppler current profiler (RD Instruments Workhorse Monitor ADCP, 1200 kHz, 0.5 m bins, 1.34 s sample interval; Carr et al. 2004). ADCP current velocities were depth averaged for comparison with the depth-averaged hydrodynamic model output. Initial larval transport: To determine where migratory ovigerous blue crabs need to release larvae to promote rapid offshore transport, we simulated the trajectories of passive Lagrangian particles from starting locations throughout the estuary (Fig. 4) 1 h after SBE, the approximate time of larval release (Provenzano et al. 1983, Epifanio et al. 1984, Ziegler 2002, Hench et al. 2004). If simulated larvae reached the coastal ocean during the first ebb tide following release, the release location was considered a suitable larval-release location. Sensitivity of migratory success to tidal-diel and spring-neap cycles: A particular tidal phase (e.g. SBE) occurs around sunrise every ~15 d (assuming a semidiurnal tide), and we refer to this cycle as the tidal-diel cycle. To test the sensitivity of migratory success to phase in the tidal-diel cycle, simulations were started at 4 different times, when SBE, mid-ebb, slack before flood (SBF), and mid-flood at the center of Beaufort Inlet occurred around sunrise on the last day of migration. Phase of the tidal-diel cycle affected the relative proportions of migratory periods that occurred during night ebb, night flood, day ebb, and day flood. When
SBE, mid-ebb, SBF, and mid-flood occurred around sunrise on the last day of migration, the percentages of time that were night ebb in the 4 d migratory periods were 16, 18, 26 and 23%, respectively. To determine the sensitivity of migratory success to the spring-neap cycle, the S2 semi-diurnal tidal constituent was added to the model. Model simulations were conducted for 4 d periods when the M2 and S2 current velocities were approximately in phase (spring tides) and out of phase (neap tides).
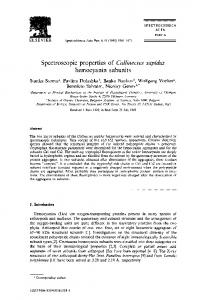
RESULTS Comparison of observed and simulated crab trajectories The trajectories of the simulated crabs matched the trajectories of the ovigerous crabs observed during the 2001 to 2002 ultrasonic telemetry tracking study closely in terms of migratory routes and total distances traveled (Fig. 5). The trajectories of simulated crabs with the low-activity behavior matched the observed trajectories of Crabs 2, 5, 7 and 8 best and were –50, + 34, –13 and –8% of the distances traveled by the corresponding observed crabs (Fig. 5). The trajectories of simulated crabs with the high-activity behavior matched the observed trajectories of Crabs 1, 3, 4, and 6 best, and were +11, –36, –29, and –34% of the distances traveled by the corresponding observed crabs (Fig. 5). The mean overall migratory speed of the simulated crabs with the low-activity behavior was significantly lower than the mean overall migratory speed of observed crabs (paired t-test, p = 0.04), but there was no significant difference between the mean overall migratory speed of the simulated crabs with the highactivity behavior and the mean overall migratory speed of observed crabs (paired t-test, p > 0.05; Fig. 6). For comparison, the mean overall migratory speed of organisms with a continuous ETT behavior was also determined and was significantly higher than the mean overall migratory speed of observed crabs (paired t-test, p < 0.01) and ~2 times as high (Fig. 6). When observed and simulated crab trajectories were broken down into night ebb, night flood, day ebb, and day flood periods, there were no significant differences between the mean migratory speeds of observed crabs and the mean migratory speeds of simulated crabs with either the low- or high-activity behaviors during these periods (paired t-tests, p > 0.05; Fig. 6). The mean migratory speeds of organisms with a continuous ETT behavior were significantly higher than the mean migratory speeds of observed crabs during night and day ebb periods (paired t-tests, p < 0.01) and were ~3 times as high (Fig. 6).
218
Mar Ecol Prog Ser 294: 213–226, 2005
Fig. 5. Callinectes sapidus. Comparison of trajectories of observed migratory ovigerous blue crabs (from Carr et al. 2004) and simulated crabs with low- and high-activity behaviors
Error estimations The modeled current speeds were within 0.1 m s–1 of the observed current speeds ~41% of the time and within 0.2 m s–1 of the observed current speeds ~69% of the time (Fig. 7). Errors in the hydrodynamic model were relatively evenly divided between overestimations and underestimations of observed currents speeds (Fig. 7). There were relatively few instances of the model predicting the wrong tidal phase (i.e. results falling in the upper left and lower right quadrants of
Fig. 7). The mean difference between the absolute values of the observed and modeled current velocities was 0.16 m s–1, and the mean difference between the raw values (allowing positive and negative values for underestimations and overestimations respectively) of the observed and modeled current velocities was + 0.01 m s–1. The simulated crabs with low- and high-activity behaviors were passively transported by hydrodynamic model currents for ~8 and 23% of the total simulation time respectively. Since the hydrodynamic
219
Carr et al.: Ovigerous blue crab spawning migration
Fig. 6. Callinectes sapidus. Comparison of mean (± 95% CI) overall and night ebb, night flood, day ebb and day flood speeds of observed migratory ovigerous blue crabs (from Carr et al. 2004) and simulated crabs with low-activity behavior, high-activity behavior, and continuous ebb-tide transport behavior
Fig. 7. Callinectes sapidus. Comparison of observed and modeled current velocities along observed trajectories of migratory ovigerous blue crabs (from Carr et al. 2004). Ebb and flood current speeds are negative and positive respectively
Fig. 8. Callinectes sapidus. Starting locations of simulated blue crab larvae that reached the coastal ocean during the first ebb tide following release (= suitable larval-release locations)
model errors had an approximately zero mean, it is unlikely that they were a source of systematic error in the simulated crab trajectories. Nevertheless, we estimated a reasonable upper limit of possible hydrodynamic model error in the simulated crab trajectories by assuming an error of 0.05 m s–1 at all times that the crabs were passively transported. With this value, we calculated that hydrodynamic error could account for 6 to 30% (mean of 14%) of the distances that the simulated crabs traveled and 4 to 81% (mean of 33%) of the differences between the distances that observed and simulated crabs traveled (Fig. 5).
Suitable larval-release locations Simulated larvae that were released within ~8 km of Beaufort Inlet in Bogue and Back Sounds and ~5 km of Beaufort Inlet in the Newport River Estuary reached the coastal ocean during the first ebb tide following release (Fig. 8).
Migratory success With the low-activity behavior, only simulated crabs within ~12 km of Beaufort Inlet reached suitable
220
Mar Ecol Prog Ser 294: 213–226, 2005
Fig. 9. Callinectes sapidus. Starting locations of simulated crabs with low- and high-activity behaviors that reached suitable larval-release locations during the 4 d migratory period. Model days are the 24 h periods from sunrise to sunrise
larval-release locations (locations from which larvae will reach the coastal ocean during the first ebb tide following release; Fig. 8) during the 4 d migratory period (Fig. 9a). With the high-activity behavior, crabs from starting locations throughout the estuary, with the exception of the uppermost Newport and North River
estuaries, reached suitable larval-release locations within the 4 d migratory period (Fig. 9b). For both behaviors, crabs that started their migration close to Beaufort Inlet generally reached suitable larvalrelease locations sooner than those that started farther up the estuary (Fig. 9). Approximately twice as many high-activity crabs as low-activity crabs reached suitable larval-release locations within the 4 d migratory period (Fig. 9).
Sensitivity of migratory success to the tidal-diel and spring-neap cycles
Fig. 10. Callinectes sapidus. Cumulative percentage of simulated crabs that reached suitable larval-release locations during the 4 d migratory period for lowand high-activity behaviors. (a) When slack before ebb (SBE), mid-ebb, slack before flood (SBF), and mid-flood occurred around sunrise on last day of migration under mean tidal conditions, and (b) during spring tides, mean tidal conditions and neap tides when SBE occurred around sunrise on last day of migration. A number of crabs (~19%) started the migration in suitable larval-release locations
There was ≤ 6% difference in the cumulative percentage of simulated crabs that reached suitable larvalrelease locations during the 4 d migratory period between the 4 times of migration (i.e. when SBE, mid-ebb, SBF and mid-flood occurred around sunrise on the last day of migration; Fig. 10a). With the low-activity behavior, slightly more crabs that migrated when SBF or mid-flood occurred around sunrise on the last day of migration reached suitable larval-release locations within the 4 d migratory period (Fig. 10a). The daily increase in the percentage of lowactivity crabs that reached suitable larval-release locations was approxi-
Carr et al.: Ovigerous blue crab spawning migration
mately linear during the 4 d migratory period, with increases of 5 to 9% d–1 (Fig. 10a). The daily increase in the percentage of high-activity crabs that reached suitable larval-release locations was more asymptotic, with increases of 18 to 24% from Days 1 to 2 and increases of only 4 to 10% from Days 3 to 4 because most crabs (> 70%) had reached suitable larval-release locations by the end of Day 3 (Fig. 10a). For both lowand high-activity behaviors, there was ≤ 6% difference in the cumulative percentage of simulated crabs that reached suitable larval-release locations during the 4 d migratory period between spring and neap tides (Fig. 10b).
Migratory speed The migratory speed of each simulated crab was calculated by dividing the total distance that the crab traveled in the estuary during the 4 d migratory period by the total time that the crab was in the estuary. The migratory speed in the estuary over the 4 d migratory period for simulated crabs with the lowactivity behavior was < 0.5 km d–1 for crabs starting their migration in the mid-to-upper Newport and North River estuaries and increased to ~2 km d–1 for crabs starting their migration in the lower estuary (Fig. 11a). The migratory speed in the estuary over the 4 d migratory period for crabs with the highactivity behavior was < 2 km d–1 for crabs starting their migration in the uppermost Newport and North River estuaries and increased to > 8 km d–1 for crabs starting their migration in the lower-to-mid Bogue and Back Sounds (Fig. 11b).
221
Migratory residence times We defined a migratory residence time as the amount of time a simulated crab spent in a given grid cell (both while moving and while stationary) during the ovigerous spawning migration. Cumulative migratory residence times (the migratory residence times of all the crabs combined) were calculated by matching the location of every simulated crab at every timestep during the 4 d migratory period to the closest node in the grid of starting locations and summing the time that was spent at each grid node (Fig. 4). The values for cumulative migratory residence times are dependent on the number of crab trajectories simulated, therefore we emphasize that the spatial patterns in cumulative migratory residence times, rather than the numeric values, are the important result. The cumulative migratory residence time of crabs with the low-activity behavior was moderate to high (40 to 120 h) throughout most of the estuary and very high (>120 h) within ~4 km of Beaufort Inlet in the lower estuary and coastal ocean (Fig. 12a). The cumulative migratory residence time of crabs with the high-activity behavior was moderate (40 to 80 h) in the lower-to-mid Bogue and Back Sounds and throughout the Newport and North River estuaries and very high (>120 h) in the lower estuary and coastal ocean within ~5 km of Beaufort Inlet (Fig. 12b).
Larval-release locations As with the values for cumulative migratory residence times, the densities of larval-release locations
Fig. 11. Callinectes sapidus. Mean migratory speeds in the estuary for simulated crabs with low- and high-activity behaviors. Speed at a given location is speed of a crab starting from that location
222
Mar Ecol Prog Ser 294: 213–226, 2005
Fig. 12. Callinectes sapidus. Cumulative migratory residence times during 4 d migratory period for simulated crabs with low- and high-activity behavior
are dependent on the number of crab trajectories simulated, and we emphasize that the spatial patterns in larval-release locations, rather than the numeric values, are the important result. For simulated crabs with the low-activity behavior, there were low-to-moderate densities (0 to 2 releases 0.25 km–2) throughout most of the estuary and high to very high densities (2 to > 4 releases 0.25 km–2) within ~4 km of Beaufort Inlet in the lower estuary and coastal ocean (Fig. 13a). Highactivity crabs released larvae predominantly in the lower estuary and coastal ocean within ~5 km of Beaufort Inlet (Fig. 13b).
DISCUSSION Ovigerous blue crabs use ebb-tide transport (ETT) to migrate from adult estuarine habitats to coastal larvalrelease areas. We developed detailed algorithms of this behavior from empirical data (Tankersley et al. 1998, Forward et al. 2003, Carr et al. 2004, Hench et al. 2004) and coupled these algorithms to a particle-tracking algorithm driven by velocity fields from a hydrodynamic model of the region to simulate the trajectories of migratory crabs and determine spatial migratory patterns. Modeling crab behavior with an idealized behavioral al-
Fig. 13. Callinectes sapidus. Larval-release locations for simulated crabs with low- and high-activity behaviors
Carr et al.: Ovigerous blue crab spawning migration
gorithm, such as continuous ETT, would not have been appropriate because it would have overestimated the mean migratory speed of the crabs and portrayed temporal patterns in migratory activity inaccurately (Fig. 6). We used 2 behavioral algorithms, low and high activity, to capture some of the variability in ovigerous blue crab ETT. It is unlikely that activity levels in the crab population are strictly bimodal, however, and these results should be considered representative low and high values for a continuum of ovigerous blue crab behaviors. The trajectories and mean speeds of simulated crabs matched the trajectories and mean speeds of observed crabs reasonably well (Figs. 5 & 6). It was not expected that the trajectories of simulated crabs (Fig. 5) would match the trajectories of observed crabs exactly, since mean values of the behavioral algorithm parameters were used to create the low- and high-activity behaviors. Nonetheless, improvements could be made to both the physical and behavioral components of the coupled model. We estimated that hydrodynamic model error could account for an average of 33% of the differences between the distances that observed and simulated crabs traveled and lead to an average of 14% error in simulated trajectory length. The 2 most likely sources of the differences between modeled and observed currents are inaccurate bathymetry and a lack of wind forcing in the model. We hope to add wind forcing to subsequent versions of the model to determine possible effects of strong winds and storm events on the spawning migration of ovigerous blue crabs. The addition of wind-forcing will require the use of a 3-dimensional hydrodynamic model and the addition of migratory vertical level(s) to the suite of behavioral algorithm parameters. Ovigerous females have been observed migrating at the surface of the water column (Tankersley et al. 1998, Hench et al. 2004), but additional study is required to determine if females are also migrating below the surface. To improve the design of the behavioral model and the parameterization of the behavioral algorithm, further study of the timing and frequency of migratory episodes, the duration of migratory episodes, and the characteristic range of flood-tide walking/swimming speeds is needed. In the present behavioral algorithms, the low-activity behavior, derived from the mean number of migratory episodes per 30 min bin from Hench et al. (2004), appears to underestimate mean crab activity (Figs. 5 & 6). It is likely that tagging and/or tethering effects in the Hench et al. (2004) study resulted in a decrease in the mean number of migratory episodes relative to natural levels. Despite this uncertainty, these data are the best estimates of the timing of migratory episodes available, and allowed us to capture migratory trajectories and temporal patterns in migratory episodes in a realistic manner.
223
The location of larval release is important because it is one of the primary determinants of whether larvae will be successfully transported to offshore developmental areas. Larvae released in the lower estuary and coastal ocean are the most likely to be transported far enough offshore to escape the tidal influence of the inlet and estuary (Kapolnai et al. 1996). We used larval transport to the coastal ocean during the first ebb tide following release (Fig. 8) as a metric for a suitable larval-release location because larvae that reach the coastal ocean quickly will spend less time exposed to estuarine predators (Morgan 1990) and harmful low-salinity conditions (Sandoz & Rogers 1944). The issue of the larval transport from the estuary merits a more complete description than is given here, but was outside the scope of this study. Larval transport outside the estuary is strongly influenced by wind-driven currents (Luettich et al. 1999), and our depth-averaged hydrodynamic model is inappropriate for further examination of this topic. Migratory success, the ability of migratory ovigerous crabs to reach suitable larval-release locations, is highly sensitive to crab behavior and starting location in the estuary and relatively insensitive to normal variability in estuarine velocities (i.e. the tidal-diel and spring-neap cycles; Figs. 9 & 10). High-activity crabs can start their migration from almost anywhere in the estuary and reach suitable larval-release locations within the 4 d migratory period, whereas crabs with lower activity levels can only reach suitable larval-release locations if they start their migration in the lower-to-mid estuary. The insensitivity of migratory success to fortnightly cycles in circulation suggests that the observed fortnightly peaks in migratory activity (R. A. Tankersley pers. obs.) exist because these periods are optimal for larval transport rather than adult migration. Many simulated crabs starting their migration in the upper Newport and North River estuaries did not reach suitable larval-release locations with either activity level (Fig. 9) because they were migrating in regions where ebb-current speeds are relatively weak (< 0.2 m s–1; Fig. 2c). Many estuaries along the Atlantic and Gulf coasts have similar regions with minimal tidal influence, and much of blue crab mating activity occurs in these areas (Churchill 1921, Van Engel 1958). The inability of crabs from these regions to reach suitable larval-release locations during the ovigerous spawning migration demonstrates the importance of a down-estuary migratory phase prior to oviposition (Tankersley et al. 1998) and the likelihood that crabs may use other behaviors (e.g. walking along the bottom or directed swimming) to migrate (Turner et al. 2003, Carr et al. 2004). A pre-oviposition, down-estuary migration by mature female blue crabs has been observed in the Chesapeake Bay (Churchill 1921, Van Engel 1958, Turner et al. 2003) and the Pamlico Sound
224
Mar Ecol Prog Ser 294: 213–226, 2005
(Medici 2004), but is not well documented for the Beaufort Inlet region (Judy & Dudley 1970). The migratory speed of high-activity crabs is much higher than that of low-activity crabs (Fig. 11) because high-activity crabs are more active (Fig. 3) and migrate more ‘efficiently’ than low-activity crabs. High-activity crabs are more efficient (i.e. travel farther per time spent actively migrating) because they travel farther down the estuary to areas with higher current speeds. Down-estuary walking/swimming at 0.25 m s–1 during flood tides also affects the migratory efficiency of the high-activity behavior, although the effect varies with location. Down-estuary walking/swimming at 0.25 m s–1 increases migratory efficiency in the upper estuary and offshore where maximum ebb-current speeds are < 0.25 m s–1, and it enables crabs from the microtidal Newport and North River estuaries to reach areas with stronger currents during the 4 d migratory period. This behavior decreases potential migratory efficiency in regions close to Beaufort Inlet, where ebb-current speeds are generally > 0.25 m s–1 (Fig. 2c) because it would be more efficient to increase passive transport during ebb tides in these regions than walk or swim down-estuary during flood tides. Since crabs with lower activity levels migrate slowly through the estuary, they will reside in the mid-toupper sub-estuaries for relatively long periods of time (Fig. 12a) and are predicted to release larvae throughout the estuary (Fig. 13a). Highly active crabs, on the other hand, migrate to the lower estuary and coastal ocean quickly and therefore reside in these regions for a greater proportion of the migratory period (Fig. 12b). They are predicted to release larvae primarily in the coastal ocean within ~5 km of Beaufort Inlet (Fig. 13b). While these are the best estimates of migratory residence times and larval-release locations to date, actual migratory residence times and the distribution of larval-release locations will depend on local blue crab population dynamics, including initial starting locations and distribution of behaviors. Very little is known about either of these parameters for the Beaufort Inlet region or for most Atlantic and Gulf coast estuaries, and further study of these factors is necessary to improve model predictions. In addition, this analysis shows spatial patterns for a limited migratory period. Crabs can migrate throughout the summer spawning season and may return to the estuary (Tagatz 1968, Tankersley et al. 1998) or migrate farther offshore after larval release (Hench et al. 2004). Therefore spatial patterns in migratory residence times and larval-release locations may shift during the spawning season. The concentration of larval-release locations in the coastal ocean near Beaufort Inlet is probably realistic, however. Maximum ebbcurrent speeds decrease rapidly to < 0.20 m s–1 within ~3 km of the inlet in the coastal ocean (Fig. 2c), and
crabs would need to actively walk or swim offshore or use wind-driven currents to make additional rapid progress away from the estuary. Recent studies have found a significant positive relationship between spawning stock abundance and recruitment in estuarine blue crab populations and suggest that maintaining a critical level of spawning stock (mature females) may be essential to maintaining viable blue crab populations (Lipcius & Stockhausen 2002, Eggleston et al. 2004). To protect spawning stock from fishing losses during their migration to and/or residence in spawning areas, spawning sanctuaries, where crabbing is prohibited or restricted, have been created in North Carolina (Henry & McKenna 1998) and Virginia (Lipcius et al. 2001, 2003, Seitz et al. 2001). In North Carolina, 5 relatively small sanctuaries, 18 to 35 km2 each, have been established around inlets in Pamlico and Core Sounds (Henry & McKenna 1998), while in the Chesapeake Bay, a large migration corridor/spawning sanctuary complex (~2400 km2) has been created (Virginia Marine Resources Commission Regulation 4 VAC 20-752-10 et seq. as adopted July 23, 2003). While the results of this study are specific to the Beaufort Inlet region, they suggest that the 5 small spawning sanctuaries around other North Carolina inlets (~4 to 6 km in the ebb-tide alongstream direction) may not provide long-term protection for migratory ovigerous crabs because crabs may be able to migrate through the sanctuaries quickly and may spend considerable amounts of time landward and seaward of the sanctuaries (Figs. 11 & 12; see also Medici 2004). Consequently, larger sanctuaries and protected migration corridors may be needed to meet management goals. Fisheries managers can use spatially explicit results such as those determined in this study to estimate what level of protection (percentage of cumulative crab residence time) a sanctuary will provide to migratory ovigerous crabs. Areas that are suitable for larval release and where larval release occurs frequently (Figs. 8 & 13) should also be considered for protection because they may be important source regions for blue crab populations. The present model provides the first spatially comprehensive estimates of ovigerous blue crab migratory success, migratory speeds, migratory residence times, and larval-release locations in the Beaufort Inlet region. The hydrodynamics of this region are typical of many estuary-inlet systems of the Atlantic and Gulf coasts of the United States, and the migratory patterns determined in this study are likely to be similar for comparable systems. This information is vital to understanding blue crab transition from estuarine adult habitats to offshore larval developmental areas and for designing spawning sanctuaries that protect migratory blue crabs effectively.
Carr et al.: Ovigerous blue crab spawning migration
Acknowledgements. Funding was provided by NSF (OCE0094938, OCE-0094930, and OCE-0095092) and a DOD NDSEG Fellowship to S.D.C. We thank J. A. Hare, C. H. Peterson, and 2 reviewers for their helpful comments on the manuscript and S. McKenna for valuable discussion of the management implications of this research.
LITERATURE CITED Arnold GP, Cook PH (1984) Fish migration by selective tidal stream transport: first results with a computer simulation model for the European continental shelf. In: McCleave JD, Arnold GP, Dodson JJ, Neill WH (eds) Mechanisms of migration in fishes. Plenum Press, New York, p 227–261 Baptista AM, Adams EE, Stolzenbach KD (1984) EulerianLagrangian analysis of pollutant transport in shallow water. MIT RM Parsons Lab Tech Rep 296, Massachusetts Institute of Technology, Cambridge, MA Carr SD, Tankersley RA, Hench JL, Forward RB, Luettich RA (2004) Movement patterns and trajectories of ovigerous blue crabs Callinectes sapidus during the spawning migration. Estuar Coast Shelf Sci 60:567–579 Churchill EP (1921) Life history of the blue crab. Bull Bur Fish 1917–1918 36:95–128 Condie SA, Loneragan NR, Die DJ (1999) Modelling the recruitment of tiger prawns Penaeus esculentus and P. semisulcatus to nursery grounds in the Gulf of Carpenteria, northern Australia: implications for assessing stock-recruitment relationships. Mar Ecol Prog Ser 178: 55–68 Costlow JD, Bookhout CG (1959) The larval development of Callinectes sapidus Rathbun reared in the laboratory. Biol Bull (Woods Hole) 116:373–396 DiBacco C, Sutton D, McConnico L (2001) Vertical migration behavior and horizontal distribution of brachyuran larvae in a low-inflow estuary: implications for bay-ocean exchange. Mar Ecol Prog Ser 217:191–206 Eggleston DB, Johnson EJ, Hightower JE (2004) Population dynamics and stock assessment of the blue crab in North Carolina. Final report, North Carolina Sea Grant, Raleigh, NC, p 1–230 Epifanio CE, Valenti CC, Pembroke AE (1984) Dispersal and recruitment of blue crab larvae in Delaware Bay, USA. Estuar Coast Shelf Sci 18:1–12 Foreman MGG, Baptista AM, Walters RA (1992) Tidal model studies of particle trajectories around a shallow coastal bank. Atmos Ocean 30:43–69 Forward RB, Tankersley RA (2001) Selective tidal-stream transport of marine animals. Oceanogr Mar Biol Annu Rev 39:305–353 Forward RB, Tankersley RA, Pochelon PA (2003) Circatidal activity rhythms in ovigerous blue crabs, Callinectes sapidus: implications for ebb-tide transport during the spawning migration. Mar Biol 142:67–76 Freire J, González-Gurriarán E (1998) New approaches to the behavioural ecology of decapod crustaceans using telemetry and electronic tags. Hydrobiology 371/372:123–132 Giske J, Huse G, Berntsen J (2001) Spatial modelling for marine resource management, with a focus on fish. Sarsia 86:405–410 Hare JA, Quinlan JA, Werner FE, Blanton BO, Govoni JJ, Forward RB, Settle LR, Hoss DE (1999) Larval transport during winter in the SABRE study area: results of a coupled vertical behaviour-three-dimensional circulation model. Fish Oceanogr 8(S2):57–76 Hench JL, Luettich RA (2003) Transient tidal circulation and
225
momentum balances at a shallow inlet. J Phys Oceanogr 33:913–932 Hench JL, Forward RB, Carr SD, Rittschof D, Luettich RA (2004) Testing a selective tidal-stream transport model: observations of female blue crab (Callinectes sapidus) vertical migration during the spawning season. Limnol Oceanogr 49:1857–1870 Henry LT, McKenna S (1998) Status and management of the blue crab fishery in North Carolina. J Shellfish Res 17: 465–468 Judy MH, Dudley DL (1970) Movements of tagged blue crabs in North Carolina waters. Commer Fish Rev 32:29–35 Kapolnai A, Werner FE, Blanton JO (1996) Circulation, mixing, and exchange processes in the vicinity of tidal inlets: a numerical study. J Geophys Res 101:14253–14268 Klavans AS (1983) Tidal hydrodynamics and sediment transport in Beaufort Inlet, North Carolina. NOAA Techn Rep NOS 100 Lipcius RN, Stockhausen WT (2002) Concurrent decline of the spawning stock, recruitment, larval abundance, and size of the blue crab Callinectes sapidus in Chesapeake Bay. Mar Ecol Prog Ser 226:45–61 Lipcius RN, Seitz RD, Goldsborough WG, Montane MM, Stockhausen WT (2001) A deep-water dispersal corridor for adult female blue crabs in Chesapeake Bay. In: Kruse GH, Bez N, Booth A, Dorn MW and 6 others (eds) Spatial processes and management of marine populations. University of Alaska Sea Grant, Fairbanks, AK, p 643–666 Lipcius RN, Stockhausen WT, Seitz RD, Geer PJ (2003) Spatial dynamics and value of a marine protected area and corridor for the blue crab spawning stock in Chesapeake Bay. Bull Mar Sci 72:453–469 Logan DG (1995) Oceanographic processes affecting larval transport in Beaufort Inlet, North Carolina. MSc thesis, North Carolina State University, Raleigh, NC Luettich RA, Westerink JJ, Scheffner NW (1992) ADCIRC: an advanced three-dimensional circulation model for shelves, coasts and estuaries. Report 1: Theory and methodology of ADCIRC-2DDI and ADCIRC-3DL. Technical Report DRP92–6, Coastal Engineering Research Center, US Army Engineer Waterways Experiment Station, Vicksburg, MS Luettich RA, Hench JL, Fulcher CW, Werner FE, Blanton BO, Churchill JH (1999) Barotropic tidal and wind-driven larval transport in the vicinity of a barrier island inlet. Fish Oceanogr 8(S2):190–209 Medici DA (2004) Scale dependent movements and protection of the female blue crab, Callinectes sapidus. MSc thesis, North Carolina State University, Raleigh, NC Metcalfe JD, Arnold GP, Webb PW (1990) The energetics of migration by selective tidal stream transport: an analysis for plaice tracked in the southern North Sea. J Mar Biol Assoc UK 70:149–162 Miller TJ (2003) Incorporating space into models of the Chesapeake Bay blue crab population. Bull Mar Sci 72: 567–588 Millikin MR, Williams AB (1984) Synopsis of biological data on the blue crab Callinectes sapidus Rathbun. FAO Fish Synop 138:1–43 Morgan SG (1990) Impact of planktivorous fishes on dispersal, hatching, and morphology of estuarine crab larvae. Ecology 71:1639–1652 Pelletier D (2001) Reflections on the Symposium ‘Spatial processes and management of marine populations’. In: Kruse GH, Bez N, Booth A, Dorn MW and 6 others (eds) Spatial processes and management of marine populations. University of Alaska Sea Grant, Fairbanks, p 685–694 Provenzano AJ, McConaugha JR, Philips KB, Johnson DF,
226
Mar Ecol Prog Ser 294: 213–226, 2005
Clark J (1983) Vertical distribution of first stage larvae of the blue crab, Callinectes sapidus, at the mouth of the Chesapeake Bay. Estuar Coast Shelf Sci 16:489–499 Rothlisberg PC, Church JA, Forbes AMG (1983) Modelling the advection of vertically migrating shrimp larvae. J Mar Res 41:511–538 Rothlisberg PC, Craig PD, Andrewartha JR (1996) Modelling penaeid prawn larval advection in Albatross Bay, Australia: defining the effective spawning population. Mar Freshw Res 47:157–168 Sandoz M, Rogers R (1944) The effect of environmental factors on hatching, moulting, and survival of zoea larvae of the blue crab Callinectes sapidus Rathbun. Ecology 25: 216–228 Seitz RD, Lipcius RN, Stockhausen WT, Montane MM (2001) Efficacy of blue crab spawning sanctuaries in the Chesapeake Bay. In: Kruse GH, Bez N, Booth A, Dorn MW and 6 others (eds) Spatial processes and management of marine populations. University of Alaska Sea Grant, Fairbanks, AK, p 607–626 Tagatz ME (1968) Biology of the blue crab, Callinectes sapidus Rathbun, in the St. Johns River, Florida. Fish Bull Fish Wildl Serv US 67:17–33 Tankersley RA, Wieber MG, Sigala MA, Kachurak KA (1998) Migratory behavior of ovigerous blue crabs Callinectes sapidus: evidence for selective tidal-stream transport. Biol
Bull (Woods Hole) 195:168–173 Turner HV, Wolcott DL, Wolcott TG, Hines AH (2003) Postmating behavior, intramolt growth, and onset of migration to Chesapeake Bay spawning grounds by adult female blue crabs, Callinectes sapidus Rathbun. J Exp Mar Biol Ecol 295:107–130 Van Engel WA (1958) The blue crab and its fishery in Chesapeake Bay. Commer Fish Rev 20:6–17 Weihs D (1978) Tidal stream transport as an efficient method for migration. J Cons Int Explor Mer 38:92–99 Werner FE, Page FH, Lynch DR, Loder JW, Lough RG, Perry RI, Greenberg DA, Sinclair MM (1993) Influences of mean advection and simple behavior on the distribution of cod and haddock early life stages on Georges Bank. Fish Oceanogr 2:43–64 Werner FE, Quinlan JA, Lough GR, Lynch DR (2001) Spatially-explicit individual based modelling of marine populations: a review of the advances in the 1990s. Sarsia 86: 411–421 Wolcott TG (1995) New options in physiological and behavioural ecology through multichannel telemetry. J Exp Mar Biol Ecol 193:257–275 Ziegler TA (2002) Larval release behavior of the blue crab, Callinectes sapidus: entrainment cues and timing in different tidal regimes. MSc thesis, Florida Institute of Technology, Melbourne, FL
Editorial responsibility: Kenneth Heck (Contributing Editor), Dauphin Island, Alabama, USA
Submitted: May 10, 2004; Accepted: December 14, 2004 Proofs received from author(s): May 25, 2005