Spatial patterns of alpine phytomass, primary productivity, and related calorific resources R. Pape and J. Löffler† Department of Geography, University of Bonn, Meckenheimer Allee 166, D-53115 Bonn Germany Citation: Pape, R., and J. Löffler. 2016. Spatial patterns of alpine phytomass, primary productivity, and related calorific resources. Ecosphere 7(6):e01347. 10.1002/ecs2.1347
Abstract. There is an obvious need for a better understanding of the drivers of local spatial heterogeneity
in alpine phytomass. Facing challenges in scaling relations with data available either at biome-scale or at plot-scale we wanted to disentangle the driving forces behind spatial patterns of phytomass, productivity, and energy content in alpine reindeer pastures. Our hypothesis was that we would find a set of environmental variables that explain the patterns of fodder resources, thereafter facilitating a spatial upscaling of plot-based data to the broad-scale range of the reindeer pastures. Based on a nested stratified random design, we used univariate and multivariate statistical analyses to relate fodder resources to environmental data along fine-scaled micro-topographical gradients which were embedded in broad-scaled gradients of grazing intensities and climatic conditions throughout Norway. We found that the spatial heterogeneity of resources was not sufficiently explained by our comprehensive set of commonly available environmental variables. This reveals that micro-spatial patterns of energetic fodder resources for reindeer in alpine landscapes are miscalculated by common approaches and that the functionalities behind these micro-spatial patterns are not yet fully understood. Hence, our results suggest that broad-scale models cannot account for the functionality in alpine environments, highlighting that resolution, scale, and the functional context are crucial aspects in understanding broad-scale resource patterns of reindeer pastures.
Key words: arctic and alpine research; cold regions; landscape ecology; linear mixed effects models; mountains; normalized difference vegetation index; Norway; redundancy analysis; spatial heterogeneity; tundra ecosystems. Received 14 December 2015; accepted 17 December 2015. Corresponding Editor: D. P. C. Peters. Copyright: © 2016 Pape and Löffler. This is an open access article under the terms of the Creative Commons Attribution License, which permits use, distribution and reproduction in any medium, provided the original work is properly cited. † E-mail:
[email protected]
Introduction
overall processes behind net primary productivity of arctic and alpine environments. A vast amount of studies are mainly based on broad-scale analyses of comparably coarse resolution (Epstein et al. 2012, Frost et al. 2014). Such biome-scale studies arise from an obvious urgent need for improved scientific knowledge on ecosystem functioning under the current climate warming paradigm and have in combination with advanced remote sensing techniques led to important insights into vegetation and phytomass patterns and their related variables (Walker et al. 2003, Zhang et al. 2008, Raynolds et al.
Arctic and alpine warming was shown to cause increased primary productivity (Miller and Smith 2012), improved fodder availability for reindeer, and thus their increased body mass growth and reproduction success (Tveraa et al. 2013). Within the current debate on shrub expansion in arctic and alpine regions, more and more studies focus on the underlying mechanisms of such changing spatial patterns (Venn et al. 2014, Blok et al. 2015). But it remains unclear to what extent micro-spatial variability contributes to the v www.esajournals.org
1
June 2016 v Volume 7(6) v Article e01347
PAPE AND LÖFFLER
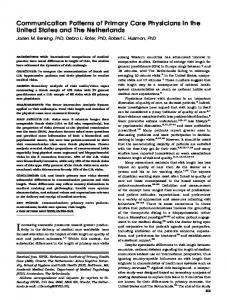
2012). In this context, the normalized difference vegetation index (NDVI) is often used to display information about photosynthesis-driven productivity and resulting patterns of aboveground phytomass (Johansen and Tømmervik 2014). The results of such studies are useful in manifold applied contexts, especially when it comes to societal challenges in the course of environmental stress (Furberg et al. 2011). Biome-scale studies are usually based on the spatial resolution of NDVI products of 500 m (MODIS) or 1000 m (AVHRR), however, are contrasted by a pronounced local heterogeneity and fine-scaled differentiation in environmental conditions of alpine landscapes (Fletcher et al. 2010). Obviously, these spatially fine-scaled patterns cannot effectively aggregate up to MODIS pixel scales, as MODIS’ coarse spatial resolution often represents composite spectral responses from multiple land cover types leading to mixed pixels resulting in either overestimation or underestimation of specific properties (Giri et al. 2013). The call for the delineation of meaningful functional entities, if they are to be a useful tool for researchers studying and modeling ecological processes (Virtanen and Ek 2014), has in combination with advances in remote sensing technologies led to global applications at a finer spatial resolution of 30 m (Giri et al. 2013) that were previously restricted to regional scale studies. Proven that alpine vegetation biomass is driven by fine-scale abiotic heterogeneity (Suvanto et al. 2014), it has been argued, however, that for alpine environments even finer spatial resolutions of 2.4 m or less are more suitable in resolving the local heterogeneity (Fig. 1; Virtanen and Ek
(a)
2014). Over and above that, Pradervand et al. (2014) also point to the fact that even an ever- increasing spatial resolution alone does not help if not accompanied by a finer resolution of the functional characteristics as well. Aboveground phytomass is usually measured as the dry weight of a clip-harvested sample, while production is generally estimated by measuring the relative growth rate, i.e., the phytomass produced in a given time interval by a given amount of standing phytomass (Shaver and Chapin 1991, Campioli et al. 2013). It has been suggested to also use calorific values for ecological comparisons (Bliss 1962). As such, calorific energy content was proposed to increase with elevation and latitude, due to higher lipid concentrations, which support rapid growth at the beginning of the growing season (Golley 1961, Bliss 1962, Darling 1976). Considering that secondary production of herbivores like reindeer is not solely determined by phytomass, we assumed that the calorific energy content of the aboveground vegetation might be a key variable to translate phytomass into total available energy content of an area. We are facing the need for a better understanding of the drivers of local spatial variation in phytomass (Suvanto et al. 2014), related challenges in scaling relations (cf., Giri et al. 2013) and the resulting gap between spatial estimates of phytomass at biome-scale on the one hand and at plot-scale on the other hand. As a consequence, information is missing on the spatial scale of entities relevant for ecological and societal processes within a specific region. Therefore, we aimed at (1), to characterize the spatial patterns
(b)
(c)
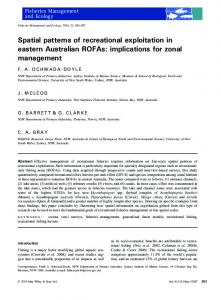
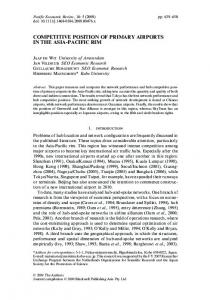
Fig. 1. Fine-scaled arctic–alpine heterogeneity as resolved by (a) near-surface aerial photography (0.3 m resolution), (b) Landsat 8 (28.5 m resolution), and (c) MODIS (250 m resolution). v www.esajournals.org
2
June 2016 v Volume 7(6) v Article e01347
PAPE AND LÖFFLER
of available aboveground phytomass, net primary productivity, and the calorific energy content of both in alpine ecosystems along topographical gradients nested within different broad-scaled climatic conditions and reindeer stocking densities, and (2), to test whether these spatial patterns can be explained by spatially available environmental data with a spatial resolution ranging from 10 to 250 m, which would facilitate an upscaling of plot-based data into a larger region. We argue that such knowledge is essential to reflect former general and broad-scale findings from a functional fine-scale perspective.
heavily grazed) and the continental grazed–ungrazed couple of C Filefjell—D Vågå in Southern Norway (Table 1, Fig. 2). All study areas featured silicate-acidic ground, gently rolling topography with characteristic oligothrophic vegetation patterns above the treeline, determined by snow (Löffler 2000). Within each of these six study regions (each >100 km² in size), we randomly chose three (Vågå: 5) study areas (1 km²) with the constraint to be accessible within not more than a half-day’s walk. The different study areas account for potential heterogeneity within the study region and prevent assessing singularities. Within each study area, we also accounted for the fine-scaled heterogeneity induced by micro-topography: Along the micro-topographic gradient, five functional entities (ranging from 5 to 100 m² in size) were differentiated based on aerial photos in accordance with earlier studies (Löffler and Pape 2008) and general vegetation patterns (Fremstad 1997), covering snow-free ridges, lee-slope early snow beds, late snow beds, nonflooded depressions, and wet, temporarily flooded depressions (Fig. 2, for the corresponding vegetation see Table 2). For each entity, five replicates were located over the study area based on stratified random coordinates, with the constraint of being more than 50 m aside from each other to prevent potential spatial autocorrelation. This nested stratified random design resulted in at total 500 sampling sites.
Materials and Methods Study area and design
We studied the energetic phytomass and productivity patterns of alpine environments in the context of Nordic pastoralism. To cover a wide variety of the general environmental setup, we accounted for broad-scaled gradients in climatic conditions as well as grazing pressure throughout Norway. While Northern Norway served as the basis for the analysis of generally heavily (Bråthen et al. 2007), but with different intensity grazed areas along the oceanic-continental climatic gradient, Southern Norway offered the opportunity to account for pastures with both intermediate and zero stocking densities (Reindriftsforvaltningen 2014) under continental conditions. We chose two couples of oceanic summer and continental winter pastures in Finnmark (Northern Norway), namely, A1 Fálá—B1 Iešjávri (heavily grazed) and A2 Kokelv—B2 Láppoluobbal (less
Aboveground phytomass and productivity
At each sampling site, aboveground phytomass was clip-harvested at the time of
Table 1. Characterization of the study regions with regard to elevation, mean air temperatures, parent bedrock, and grazing intensity. Characteristic
A1 Fálá
Elevational range (m a.s.l.) Parent bedrock
90 to 360
Range of mean JJA air temperatures (°C) Range of mean DJF air temperatures (°C) Grazing intensity
7.8 to 10.6
Acidic (quartzite, arkose)
A2 Gearrentjárga 85 to 360 Acidic (biotite schists, meta- sandstones) 8.1 to 10.5
B1 Iešjávri 410 to 490 Acidic (quartzite, biotite schists) 8.7 to 10.7
B2 Láppoluobbal 420 to 500 Acidic (granitic gneiss)
C Filefjell
D Vågå
1050 to 1270
1040 to 1560
Acidic (quartzite, sandstones)
Acidic (mica-arkose)
9.6 to 10.5
8.1 to 9.7
6.2 to 9.3
−5.1 to −3.3
−6.5 to −4.0
−12.8 to −10.8
−12.9 to −12.5
−8.7 to −8.3
−10.3 to −7.6
+++
++
+++
++
+
−
v www.esajournals.org
3
June 2016 v Volume 7(6) v Article e01347
PAPE AND LÖFFLER
Fig. 2. Study design. Table 2. Sampled micro-topographic entities and their vegetation. Sampling entities
Dominant species
Dominant species groups
Snow-free ridges Lee-slope early snow bed
Alectoria ochroleuca, Cetraria nivalis, Cladina spec. Vaccinium myrtillus, Empetrum hermaphroditum
Lee-slope late snow bed Nonflooded depression Wet, temporarily flooded depression
Salix herbacea, Juncus trifidus, Nardus stricta Rubus chamaemorus, Sphagnum spec. Eriophorum angustifolium, Carex spec. Sphagnum spec.
v www.esajournals.org
4
Lichens (Li) Deciduous shrubs (De), evergreen shrubs (Ev) Deciduous shrubs, graminoids (Gr) Deciduous shrubs, mosses (Mo) Graminoids (Gr), mosses (Mo)
June 2016 v Volume 7(6) v Article e01347
PAPE AND LÖFFLER
peak-phytomass in July/August within a frame of 0.2 × 0.2 m2. In the depressions, the sampling frame was inserted into the moss layer, defining a volume of 0.2 × 0.2 × 0.1 m3 to be sampled. By doing so, we circumvented the problem of any differentiation among the intact growing canopy and the decomposing layer in peatlands being vague at best, and followed the suggestion of Vitt (2007) to use standardized density- biomass instead. After harvest, the phytomass was sorted into species groups (cf., Table 2), and air dried. For Vaccinium myrtillus and Empetrum hermaphroditum as the most frequent deciduous and evergreen shrub species, annual length increments (for V. myrtillus also leafs) were separated as a measure of annual productivity (Shaver 1986, Shevtsova et al. 1997). Under ungrazed conditions, this productivity equaled the common net primary productivity (Leith and Whittaker 1975), whereas under grazed conditions it represented the productivity despite grazing. After sorting and separation, all sub-samples were oven-dried for 48 h at 70°C and weighed to obtain phytomass dry weight per species group (hereafter referred to as W [g·m−2] with a subscript referring to the species group) and annual aboveground productivity of V. myrtillus and E. hermaphroditum (hereafter referred to as PDe and PEv, both given as [g·m−2·a−1]). Furthermore, dry weight of the species groups’ sub-samples was summed up to the total aboveground phytomass (hereafter referred to as Wtot [g·m−2]).
available. These variables reflect factors considered to be important for the explanation of phytomass and productivity (e.g., Zhao and Running 2010, Berdanier and Klein 2011, Raynolds et al. 2012, Suvanto et al. 2014), i.e., measures related to topography, snow, solar radiation, temperature conditions, and grazing pressure. Furthermore, the NDVI served as additional indicator for the state of the vegetation. For the NDVI, we used multiyear averaging in combination with maximum composites as conservative technique for minimizing cloud and sun/sensor angular geometry effects (e.g., Schimel et al. 1997). For 5 yr prior to sampling (i.e., 2005–2010), we recomposited 16-d maximum NDVI values (MOD13Q1; Carroll et al. 2010) into a raster of maximum NDVI values for each time period considered (e.g., June–August: JJA), and then aggregated the different annual raster of season-specific maximum NDVI value by averaging.
Statistical analyses
Prior to any further analyses, the set of environmental variables was reduced applying feature selection: Zero-variance as well as redundant variables, i.e., variables being highly correlated (Pearson’s r > 0.7), were removed. The remaining data set of 16 environmental variables (Table 3) were centered and standardized before serving as input for the subsequent univariate and multivariate analyses of relations between pasture resources (W, P, C) and the environmental conditions. To account for the nested study design in univariate analysis, we applied linear mixed effects models (LME, Pinheiro and Bates 2000) using the environmental variables as fixed effects, while vegetation type nested within study region constituted the random effect. We followed the approach of Zuur et al. (2008) and started with a beyond-optimal model that, while accounting for the optimal variance structure, includes all environmental variables. Using likelihood ratio tests, we then dropped all insignificant variables subsequently to obtain the final model. The final model’s validity was assessed graphically by plotting the residuals to check for homogeneity and normality, and by calculating the marginal and conditional R2 (Nakagawa and Schielzeth 2013, Johnson 2014). While the marginal R2 represents
Calorific energy content
To measure the calorific energy content of the phytomass (hereafter referred to as C [MJ/kg]), the entire sub-samples were ground, homogenized, compressed into pellets, and ignited in an oxygen bomb calorimeter (Parr Model 6100; Parr Instrument Company, Moline, Illinois, USA). Duplicate samples gave standard errors of