International Journal of
Environmental Research and Public Health Article
Spatial-Temporal Variations of Water Quality and Its Relationship to Land Use and Land Cover in Beijing, China Xiang Chen 1,2 , Weiqi Zhou 1,2, *, Steward T. A. Pickett 3 , Weifeng Li 1 and Lijian Han 1 1
2 3
*
State Key laboratory for Urban and Regional Ecology, Research Center for Eco-Environmental Sciences, Chinese Academy of Sciences, No.18 Shuangqing Rd., Haidian District, Beijing 100085, China;
[email protected] (X.C.);
[email protected] (W.L.);
[email protected] (L.H.) University of Chinese Academy of Sciences, No.19A Yuquan Rd., Beijing 100049, China Cary Institute of Ecosystem Studies, Box AB, 2801 Sharon Turnpike, Millbrook, NY 12545, USA;
[email protected] Correspondence:
[email protected]; Tel.: +86-10-6284-9268; Fax: +86-10-6291-5732
Academic Editor: Yu-Pin Lin Received: 5 April 2016; Accepted: 25 April 2016; Published: 27 April 2016
Abstract: Rapid urbanization with intense land use and land cover (LULC) change and explosive population growth has a great impact on water quality. The relationship between LULC characteristics and water quality provides important information for non-point sources (NPS) pollution management. In this study, we first quantified the spatial-temporal patterns of five water quality variables in four watersheds with different levels of urbanization in Beijing, China. We then examined the effects of LULC on water quality across different scales, using Pearson correlation analysis, redundancy analysis, and multiple regressions. The results showed that water quality was improved over the sampled years but with no significant difference (p > 0.05). However, water quality was significantly different among nonurban and both exurban and urban sites (p < 0.05). Forest land was positively correlated with water quality and affected water quality significantly (p < 0.05) within a 200 m buffer zone. Impervious surfaces, water, and crop land were negatively correlated with water quality. Crop land and impervious surfaces, however, affected water quality significantly (p < 0.05) for buffer sizes greater than 800 m. Grass land had different effects on water quality with the scales. The results provide important insights into the relationship between LULC and water quality, and thus for controlling NPS pollution in urban areas. Keywords: water quality; land use and land cover; non-point source pollution; scale; Beijing
1. Introduction Urbanization constitutes high concentrations of urban populations and is an important component of dramatic land transformation [1–3]. The changes have great impacts on stream ecosystems, such as the degradation of water quality, simplification of the channel, and decline of biodiversity [4–6]. In general, water quality degradation is commonly caused by both non-point sources (NPS) of runoff pollution and point sources (PS) of wastewater discharge. However, with the development of a city and the improvement of wastewater treatment, PS pollution is significantly reduced, and NPS pollution from surface runoff is now becoming a problem for urban water quality [7]. Meanwhile, because human activities differ in intensity in different areas, water quality degradation might be spatially heterogeneous [8,9]. This is particularly perceptible in catchments with environmental land use conflicts [10,11]. Therefore, it is important to analyze the characteristics of river riparian land use/land cover (LULC) and their influence on water quality for NPS pollution management.
Int. J. Environ. Res. Public Health 2016, 13, 449; doi:10.3390/ijerph13050449
www.mdpi.com/journal/ijerph
Int. J. Environ. Res. Public Health 2016, 13, 449
2 of 17
There are many studies about the impact of land use/cover on the water quality [7,12–16]. However, the previous studies mainly concentrated on the impacts of the main LULC types of exurban and urban on water quality. In exurban or rural areas, crop and forest land are the primary LULC types; they can increase Nitrogen, Phosphorous, and pesticide concentrations in nearby river water through agricultural activities [17–22]. In urban areas, the main LULC type is impervious surfaces. They impact on water quality through higher pollutant concentrations and by increasing the composition of particles, nutrients and metals in runoff waters [23–26]. Other LULC types, such as water and turf grass, however, have received relatively little attention in research on water quality, although they can also have important effects on water quality. For example, previous studies have shown that percentage cover of water within a catchment had a positive effect on the water quality in a river due to dilution and degradation of pollutants [7]. Grass cover, however, may have a more complex relationship with water quality [19]. The increase of grass coverage was found to increase the concentrations of water pollutants in some case studies [7], but to reduce water pollutants in others [27]. In order to understand the water quality over spatial heterogeneity in large areas, the LULC types which can impact water quality should be analyzed. The problem of how LULC types influence water quality is very important for water research and management. However, there is controversy regarding to what extent LULC impacts on water quality. Controversy may emerge from the combination of cover class with spatial configuration of the cover. The width of buffer zone beside streams is one case of LULC complexity. For example, 6 m buffer zones composed of trees, shrubs, and grass could reduce total suspended solids by 94%, total nitrogen by 78% and total phosphorus by 81% in runoff from agriculture [28]. Sweeney and Newbold [29] reviewed the literature and found that streamside forest buffer no less than 30 m wide were needed to protect the water quality, aquatic organisms and their habitat in small streams. Houlahan and Findlay [30], however, found that the buffer zone often needs to be nearly 4000 m at the watershed scale to protect the river water quality and the integrity of the aquatic ecological system. Due to the geographical position and its rapid urbanization, Beijing suffers from a severe lack of water resources and high levels of water pollution. Many cities and regions in the world face the same risks [31]. Therefore, in order to promote sustainable development of the city and enhance human wellbeing, the protection of the aquatic environment is very important. The main objectives of this work are to (1) assess the spatial and temporal pattern of water quality in Beijing; and (2) to investigate the relationships between different types of land and the water quality variables; and (3) to explore the effects of different sizes of buffer zones on the relationship between LULC types and water quality to provide a reliable scientific basis for river management. 2. Materials and Methods 2.1. Study Area This research covers metropolitan Beijing, which is located in the northwest of the North China Plain, adjoining the Inner Mongolian plateau to the north and Taihang Mountains to the west, and covers a total area of 16,410 km2 . It is located in North Temperate Zone, with hot and rainy summers and cold and dry winters. The annual average temperature is about 12 ˝ C and the annual mean precipitation is 588.1 mm, with about 72% of the precipitation occurring in July and August with 0.05). In exurban areas, the concentration of NH3-N, CODCr, and CODCOD decreased in urban areas, but the concentration of DO increased from 4.87 mg/L in 2005 Cr also Mn decreased from 2005 to 2010, and the concentration of DO increased from 2005 to 2010, to 5.16 mg/L inthe 2010 (p > 0.05). In areas, the concentration of NH -N, CODCrareas, , and COD however, concentration of exurban BOD increased from 2000 to 2010. In 3nonurban the Mn decreased from 2005 to 2010, and the concentration of DO increased from 2005 to 2010, however, concentration of NH3-N, BOD, and CODMn showed a fluctuating trend in 2000, 2005 and 2010. For the concentration of BOD increased to 2010. In 2.25 nonurban areas, concentration of but NH3 -N, example, the concentration offrom BOD 2000 decreased from mg/L in 2000 the to 1.9 mg/L in 2005, 2.35 mg/L in 2010, whichtrend was higher than 2000. Mn, For however, the concentration BOD,increased and CODtoMn showed a fluctuating in 2000, 2005 andCOD 2010. example, the concentration increased from from 1.95 mg/L 2000 to mg/L in 2005, but to 2.93 mg/L into2010. of BOD decreased 2.25in mg/L in3.15 2000 to 1.9 mg/L indeclined 2005, but increased 2.35 mg/L in 2010,
which was higher than 2000. CODMn , however, the concentration increased from 1.95 mg/L in 2000 to Table 1. Mean value of water quality variables at nonurban areas, and urban areas and exurban areas 3.15 mg/L in 2005, but declined to 2.93 mg/L in 2010. in 2000, 2005, and 2010.
Nonurban Urban Area Exurban Table 1. Mean value of water qualityArea variables at nonurban areas, and urban areasArea and exurban areas Variables 2000 2005 2010 2000 2005 2010 2000 2005 2010 in 2000, 2005, and 2010. DO 9.89 8.69 NH3-N 0.13 0.24 0.24 Nonurban Area BOD 1.9 2.35 Variables2.25 2000 17.35 2005 12.6 2010 CODCr 1.95 3.15 2.93 CODMn DO 9.89 8.69 NH3 -N 0.13 0.24 0.24 BOD 2.25 1.9 2.35 CODCr 17.35 12.6 CODMn 1.95 3.15 2.93
4.87 5.16 2.09 2.62 19.38 16.66 12.25 9.7 29.3 16.6 Urban Area Exurban Area 58.82 34.01 22.39 29.7 81.8 99.7 2000 2005 70.11 2010 63.552000 2005 2292010 174 22.89 4.87 18 5.16 11.72 20 2.09 25.12.62 23.4 19.38 16.66 12.25 9.7 29.3 16.6 58.82 34.01 22.39 29.7 81.8 99.7 70.11 63.55 229 174 22.89 18 11.72 20 25.1 23.4
Int. J. Environ. Res. Public Health 2016, 13, 449 Int. J. Environ. Res. Public Health 2016, 13, 449
3.2. Spatial Patterns of LULC in Buffers
7 of 17 7 of 17
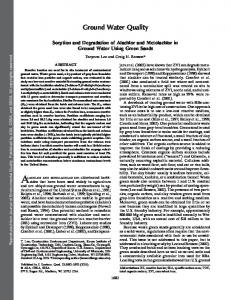
3.2.The Spatial Patterns of in Buffers proportion ofLULC the LULC types changed with an increase in the buffer zones from 100 m to 2000 mThe (Figure 5). Within the nonurban as with the buffer zones in increased, percentage proportion of the LULC types areas, changed an increase the bufferthe zones from 100ofmforest to land increased from 44% tothe 82% in S1 and from to 87% in S2, and thethe percentage ofof crop land 2000 m (Figure 5). Within nonurban areas, as 76% the buffer zones increased, percentage forest and impervious decreased accordingly. sites of S4, S11 wereofincrop the central land increasedsurface from 44% to 82% in S1 and fromThe 76% to 87% inS5, S2,S6, andS7, theand percentage land and area, impervious surface accordingly. The sites of S4, S5,about S6, S7,70%. and S11 were in in theS5 central urban and the meandecreased percentage of impervious surface was Especially and S6, area, and mean percentage impervious wasm about 70%.m, Especially S5 and S6, of theurban percentage of the impervious surface of was over 90%surface from 100 to 2000 and theinpercentage the percentage of was impervious surface over from to sites 2000 of m,S3, andS9, the percentage of impervious surface over 80% in S11was from 10090% m to 2000100 m.mThe S10 and S12 were impervious in S11 from of 100 m to 2000 m. The sites S3, S9, S10the and S12 were near the centralsurface urbanwas area,over and80% the percentage impervious surface was of lower than central urban near theHowever, central urban area, and the impervious surface was thanofthe central area sites. the percentage of percentage imperviousofsurface increased with thelower increase buffer zone. urban area sites. However, the percentage of impervious surface increased with the increase of in For example, the percentage of impervious surface increased from 7% in 100 m to 19.5% in 2000 m buffer zone. For example, the percentage of impervious surface increased from 7% in 100 m to 19.5% S12. Crop land was the main LULC type in the exurban area and the mean percentage of crop land was in 2000 m in S12. Crop land was the main LULC type in the exurban area and the mean percentage of 70.2% from 100 m to 2000 m in S13. However, the percentage of crop land decreased from 72% in 100 m crop land was 70.2% from 100 m to 2000 m in S13. However, the percentage of crop land decreased to 61% in 2000 m, but the percentage of forest land and impervious surface increased accordingly. from 72% in 100 m to 61% in 2000 m, but the percentage of forest land and impervious surface Percentage of grass land in the sampling sites was lower than other LULC types. For example, the increased accordingly. Percentage of grass land in the sampling sites was lower than other LULC percentage of grass land was 0.5% in 100 m and 2.4% in 2000 m in S8. types. For example, the percentage of grass land was 0.5% in 100 m and 2.4% in 2000 m in S8.
Figure 5. LULC characteristics of the river section within the buffers of 100 m, 200 m, 300 m, 600 m, Figure 5. LULC characteristics of the river section within the buffers of 100 m, 200 m, 300 m, 600 m, 800 m, and 2000 m. “imp” means impervious surface. 800 m, and 2000 m. “imp” means impervious surface.
Int. J. Environ. Res. Public Health 2016, 13, 449 Int. J. Environ. Res. Public Health 2016, 13, 449
8 of 17 8 of 17
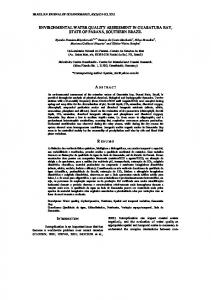
3.3. Relationship between Water Quality and LULC in Buffers 3.3.1. Results Results of of Pearson Pearson Relationship Relationship Analysis Analysis 3.3.1. Calculation of correlation coefficient showed that the LULC very different Calculation ofthe thePearson Pearson correlation coefficient showed that the types LULChave types have very impacts on water quality (Figure 6). Forest land was positively correlated with water quality. Pearson different impacts on water quality (Figure 6). Forest land was positively correlated with water results showed the forest landthat wasthe positively correlated with DO, correlated but negatively quality. Pearsonthat results showed forest land was positively withcorrelated DO, but with NH3 -N, BOD, COD and3-N, COD m toCOD 2000Mnm. However, LULC of water, Cr NH Mn from negatively correlated with BOD, COD100 Cr and from 100 m the to 2000 m.types However, the crop, and impervious surface were negatively correlated with water quality. The LULC types were LULC types of water, crop, and impervious surface were negatively correlated with water quality. negatively with DO, but positively NH3 -N, BOD, CODCr with and COD The LULC correlated types were negatively correlatedcorrelated with DO, with but positively correlated NH3Mn -N,except BOD, for impervious surface, which was negatively correlated CODCr from 100 m towith 2000COD m. Pearson COD Cr and COD Mn except for impervious surface, which with was negatively correlated Cr from results demonstrated thatresults grass land has a different correlation with water quality whenwith the width 100 m to 2000 m. Pearson demonstrated that grass land has a different correlation water of the buffer changed. Grass landzone was positively correlated and COD 3 -N, BOD, Cr , quality whenzone the width of the buffer changed. Grass land with was NH positively correlated with but negatively correlated with DO from 100 m to 500 m; however, it was negatively correlated with NH3-N, BOD, and CODCr, but negatively correlated with DO from 100 m to 500 m; however, it was NH3 -N, BOD, and COD 600BOD, m to 2000 m. Cr from 600 m to 2000 m. Cr from negatively correlated with NH3-N, and COD
Figure 6. Pearson relationships between the LULC types of Forest, Grass, Water, Crop, and Imp Figure 6. Pearson relationships between the LULC types of Forest, Grass, Water, Crop, and Imp (impervious surface) and water quality variables within the buffer of 100–2000 m. (impervious surface) and water quality variables within the buffer of 100–2000 m.
Correlation coefficients between LULC types and water quality variables changed when the Correlation coefficients between LULC types and water quality variables changed when the buffer buffer zones increased. In the case of water, for example, the correlation coefficients with CODCr zones increased. In the case of water, for example, the correlation coefficients with CODCr were less were less than 0.1 in the first 300 m and increased to 0.456 at 500 m, then decreased to 0.148 at 1200 than 0.1 in the first 300 m and increased to 0.456 at 500 m, then decreased to 0.148 at 1200 m, and m, and increased to 0.286 at 2000 m. However, with DO, the correlation coefficients increased increased to 0.286 at 2000 m. However, with DO, the correlation coefficients increased continually from continually from 0.001 at 100 m to 0.219 at 800 m, but decreased from 800 m to 1200 m, then 0.001 at 100 m to 0.219 at 800 m, but decreased from 800 m to 1200 m, then increased back to 0.206 at increased back to 0.206 at 2000 m. The correlation coefficients between water and NH3-N, BOD, and 2000 m. The correlation coefficients between water and NH3 -N, BOD, and CODMn were similar to CODMn were similar to DO, but decreased earlier from 300 m to 1200 m. The correlation coefficients of DO, but decreased earlier from 300 m to 1200 m. The correlation coefficients of impervious surface impervious surface with NH3-N, BOD, and CODMn decreased from 100 m to 200 m, but increased continually to 1500 m, then decreased back to 2000 m. However, the correlation coefficient with DO
Int. J. Environ. Res. Public Health 2016, 13, 449
9 of 17
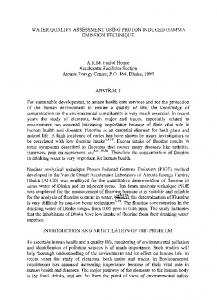
with NH3 -N, BOD, and CODMn decreased from 100 m to 200 m, but increased continually to 1500 m, then decreased back to 2000 m. However, the correlation coefficient with DO increased continually from 0.244 at 100 m to 0.365 at 2000 m. The correlation coefficients of crop land with the five water quality variables increased from 100 m to 2000 m, but the correlation coefficients of forest with the water quality variables changed less than other LULC types. The results also showed that the main water quality variable affected by LULC type was very different. For example, the correlation coefficient of forest with DO was higher than other water quality variables, but the correlation coefficient of forest with CODCr was minimal for the water quality variables. The correlation coefficient of water with BOD was higher than other water quality variables, but lower with DO than other water quality variables. The correlation coefficient of crop land with CODCr , however, was higher than other water quality variables, but impervious surface had a higher correlation coefficient with CODMn . 3.3.2. Results of Redundancy Analysis Redundancy analysis (RDA) showed the correlations of water quality variables and LULC types in the sites along with the different buffer zones (Figure 7). The water chemistry variables were mainly explained by the first two axes, and the first axis explained the variables more than twice as well as the second axis (Table 2). The first axis was positively correlated with forest land and negatively correlated with crop land and impervious surface, which increased in the urban and exurban area. The second axis was positively correlated with crop land and negatively with urbanization. Although the ordination results showed similar interactions to the results of Pearson analyses, the relationship between LULC and the water chemistry variables could be very clearly understood using ordination. From 100 m to 2000 m, DO was positively correlated with forest, which was the main LULC type in nonurban area sites, S1 and S2. Table 2. Summary of RDA of LULC with respect to the five environmental variables (ENVI) at buffers of 100–2000 m. Axis 1 Buffer (m) 100 200 300 400 500 600 800 1000 1200 1500 2000
Axis 2 % Variance of
Correlations of LULC-ENVI
LULC
0.815 0.878 0.895 0.892 0.891 0.897 0.889 0.882 0.875 0.894 0.917
22.7 26.1 28.8 31.6 33.7 35.5 37.7 38.3 38.8 40.9 41.9
LULC-ENVI 55.3 63.3 68.1 72.3 74.9 76.2 75.8 75 74.6 75.4 78.2
% Variance of
Correlations of LULC-ENVI
LULC
0.514 0.468 0.452 0.445 0.442 0.447 0.48 0.503 0.518 0.525 0.483
16.2 14 12.6 11.7 10.9 10.8 11.7 12.6 13 13.2 11.5
Total Variance (%)
LULC-ENVI 39.6 34 29.9 26.7 24.4 23.1 23.4 24.5 24.9 24.3 21.6
41.1 41.2 42.3 43.7 45 46.6 49.7 51.1 52 54.3 53.6
Int. J. Environ. Res. Public Health 2016, 13, 449 Int. J. Environ. Res. Public Health 2016, 13, 449
1.0
100m
10 of 17 10 of 17
1.0
S1
S1
200m
DO forest S3
S3 S13
S2
water
water S12 S4
S6
COD Cr
S7
NH3-N BOD
S6
S12
grass
imp S8
S5
S11
COD Cr NH3-N BOD COD Mn
grass
S7 imp
S8
-1.0
COD Mn
-1.0
1.0
300m
S1
S13
S4
S10
S5 S11
1.0
S2
S9 S9 S10
-1.0
DO forest
crop
S13 crop
-1.0
1.0
1.0
S13
600m
S1
S3
S3
crop
crop DO forest
S9 water S10
COD Cr NH3-N -0.6 BOD COD Mn
S4 S6 S11 S5 grass S7 imp S8
S12
-1.0
1.0
NH3-N BOD COD Mn
S2
-1.5 1.0
S13 crop
COD Cr
-1.5
S2
S3 S1
-0.6
DO
S13
crop
COD Cr NH3-N BOD COD Mn
forest
1.0
2000m
S3
S12 S9 others S10 water S5 S6 S11 S4 imp S7 S8 grass
S12 S10 water others S4 S11 S5 S6 imp S8 grass S7
-0.6 1.0
800m
S9
COD Cr
BOD NH3-N COD Mn
forest DO S2 1.0
S9 S12 S10 S5 S4 others S6 imp S7
-0.6
S1
water
S11 S8
forest DO
grass
-1.5
S2 1.0
Figure7.7.RDA RDAresults resultsofofLULC LULCand andwater waterquality qualityvariables variableswithin withinthe thebuffer bufferof of100 100m, m,200 200m, m,300 300m, m, Figure 600m, m,800 800m, m,and and2000 2000m. m.“imp” “imp”means meansimpervious impervioussurface. surface. 600 Table 2. Summary of RDA of LULC with respect to the five environmental variables (ENVI) at buffers of 100–2000 m.
3.3.3. Results of Multiple Regression Analysis
The results of multiple regression analysis indicated that buffer sizes were very important for Axis 1 Axis 2 Total studying the relationship between LULC types and water quality (Table 3). At buffers of 100 m and % Variance of % Variance of Buffer (m) Correlations of Correlations of Variance (%) 200 m, forest land was an important factor for water quality over the years. For example, the forest LULC-ENVI LULC-ENVI LULC LULC-ENVI LULC LULC-ENVI was the type correlated 100first LULC0.815 22.7 with the 55.3 water quality 0.514indicators, 16.2and it was 39.6 very significantly 41.1 2 200 correlated 0.878 26.1 63.3 negatively with COD R = 0.516, p0.468 < 0.01), NH314 -N (Adjust34R2 = 0.629, p41.2 < 0.01) Mn (Adjust 300and significantly 0.895 28.8 correlated 68.1 0.452 12.6p < 0.05)), 29.9CODCr (R2 42.3 in 2010, negatively with BOD (R2 = 0.191, = 0.362, 400 0.892 31.6 72.3 26.7 43.7 2 = 0.593, p p < 0.05) in 2010, but significantly positively correlated0.445 with DO (R11.7 < 0.01) at the 100 m 500 0.891 33.7 74.9 0.442 10.9 24.4 45 buffer. However, at the 300–600 m buffers, the mixed types of crop, impervious surface, water, and 600 0.897 35.5 76.2 0.447 10.8 23.1 46.6 forest800 all significantly affected water of 300 m, the (R2 = 0.634, p49.7 < 0.05), 0.889 37.7 quality. 75.8AT the buffer 0.48 11.7 CODMn23.4 2 2 BOD 1000 (R = 0.63, p 0.5, p < 0.05). In the exurban site, crop land was the main LULC type. The impact of agricultural non-point source pollution on water quality has received much attention, and many studies report that agricultural activities are strongly correlated with high nutrients in streams, such as nitrogen and phosphorus, along with pesticides [12,20,47]. In the course of agricultural activities, large amounts of organic pesticides and fertilizers are applied to crop land. Most organic pesticides are hard to degrade and residues run into nearby rivers with heavy rain and irrigation. Such contamination could lead to the high COD and concentration of other pollutants in the water [18,48]. In addition, there are many livestock farms in the Beijing exurban area. Due to a shortage of treatment plants, most of the waste directly enters local waterways. In order to protect the water quality in exurban areas, nutrient management, such as nutrient budget, is a mitigation measure to diffuse water pollution from agriculture [49]. Zheng et al. [50] also suggested that payment for ecosystem services (PES) would be an important measure to reduce output from agricultural activities. The LULC type of water negatively correlated with water quality. Though the waste treatment rate reached 85% in Beijing by 2014, the untreated waste waters are still a relatively large pollution source. By 2014, water quality of 53.1% of the rivers in Beijing was poor or very poor [51]. In urban river systems, such as the Beiyun river system, the poor and very poor water quality is more than 80%, while in exurban areas the proportion is nearly 70%. This means the water quality in most urban and exurban river sections is poor, and the reaches upstream of sample stations have no effect on the purification of downstream water. Beijing is characterized by a severe water shortage, and rainfall is the major water source for its rivers. However, rainfall is also a source of pollution in Beijing because of storm runoff. In urban areas, the storm runoff contains a mixture of pollutants from roofs and roads, which feed into the rivers, lakes and wetlands [27,52]. Indeed, lakes and wetlands are the main water source of rivers in dry seasons in the central city area of Beijing. Some researchers believe the LULC type of water should be negatively correlated with water quality parameters because of dilution and purification [27]. However, the water they referred to was reclaimed water from wastewater treatment plants (WWTPs), which has relatively low pollutant concentrations compared with storm runoff water [53]. We found forest land was the only land cover type that is negatively related to pollutants and positively correlated with DO, reflecting its positive role in controlling water quality by filtration, absorption and translation of pollutants before they run into waterways [54–57]. For example, Dosskey et al. [55] reviewed research on how riparian vegetation affected water quality, and found that the vegetation could take up 170 kg nitrogen and 49 kg phosphorous per ha every year. Multiple regression analysis demonstrated that forest land in Beijing was the primary factor affecting water quality at a 200 m buffer. This may be associated with how river management in Beijing is conducted. In order to improve the urban environment, the government constructed green ways on both sides of 10 major rivers and some parks in the center city. By 2017, a projected 1000 km of green way will be built in
Int. J. Environ. Res. Public Health 2016, 13, 449
13 of 17
Beijing, which is believed to benefit people, ecosystems and habitats, and assist in water provision [58]. Bernhardt and Palmer [59] believe that riparian forest is important for maintaining high water quality in stormwater management and stream restoration. Our results suggest that planting forests beside the banks of urban streams will greatly improve the water quality by controlling NPS pollution in Beijing. Some research has suggested that grass land can also promote water quality [14,60,61], whereas other studies showed that the increasing proportion of grass land was strongly associated with water quality degradation [19,62]. Our results, however, showed that the effect of grass land on water quality was sensitive to spatial scale. At buffers of 500 m, the grass land was positively correlated with pollutants of CODMn , BOD, and NH3 -N, but from 600 m to 2000 m, it was negatively correlated with these pollutants. Planting grass to protect the slope on river banks resulted in intensive management measures, such as watering, fertilizing, spraying insecticide and clipping grass, which would have a negative impact on water quality [27]. However, as the buffer size increases, the planted and highly managed grass land was replaced by minimally managed grass land, which was affected only little by humans. Such lightly managed grass land can intercept some pollutants in rain water that is on its way to rivers [61]. The scale effect was an important factor in the relationship between LULC and water quality but the range remains controversial. For example, Shen et al. [39] found landscape metrics could explain 73% of the water quality variation at 300 m, but the explanatory power decreased to 64% at 500 m. Zhou et al. [63] found the LULC pattern had a major impact on water quality in assessing the landscape pattern effects on water quality at scales from 500 m to 5000 m. Tu [16] explored the relationship between water quality and land use at a regional scale from 20 km to 80 km away from the metropolitan Boston area, and showed that land use explained water quality variation across the urbanization gradient in the watersheds. Our results indicated that the forest land was the most important LULC type to affect water quality at 200 m buffers, but the crop land and impervious surfaces were the primary LULC types effecting water quality at buffers greater than 800 m. The distribution of wastewater treatment plants (WWTPs) was another important factor in the spatial difference of water quality in Beijing. Our results showed that the pollutant concentrations were very high at the urban sampling stations, but the concentration of pollutants at the exurban station was higher than in the urban area (Table 1). The results demonstrated that the exurban river water quality was worse than that in the urban area, and the public and the government should pay more attention to the exurban river environment. For example, there should be more monitoring stations and more WWTPs in the exurban area. By 2010, there was a total of 60 WWTPs in Beijing, and nearly 80 percent of them are in urban areas. There are only 16 WWTPs capable of processing more than 50,000 tons per day and 13 of them are distributed in the urban area; the other three WWTPs are scattered in different areas. Pinggu district, for example, the most important producer of agricultural and subsidiary products in Beijing, has only three WWTPs and just one plant with a processing capacity of about 80,000 tons per day. The other two WWTPs in Pinggu have processing capacities of only 1500 tons per day. Most untreated wastewater is discharged into rivers and degrades the water quality. Lack of WWTPs and the shortage in processing capacity in the exurban and rural areas are a big problem faced by most cities in China [20,64]. Therefore, it is important to build WWTPs in exurban and rural areas to improve the water quality and people’s living environment. 5. Conclusions We analyzed the spatial and temporal patterns of water quality in Beijing. Our results showed that water quality was significantly different in areas exhibiting different degrees of urbanization, and that LULC was an important factor in determining water quality. In addition we documented that forest areas have a positive relationship with water quality. In contrast, other LULC types, such as impervious surfaces, crops, and water, were negatively related with water quality. The grass land, however, had differing effects on water quality because of different intensities of grass land management at wider buffers. The grass land near rivers was mainly used to protect the slope, and it may have negative
Int. J. Environ. Res. Public Health 2016, 13, 449
14 of 17
impacts on water quality as a result of intensive management. However, as the buffer size increases, the managed grass land near the river bank is replaced by the natural grass land, which may have a positive effect on water quality by retaining pollutants from storm water. Accordingly, we believe that less fertilizing and spraying of insecticide, decreasing artificial grass land, and keeping the grass land in a more natural state are better strategies than intensive management within buffer zone to ensure water quality. Our results also showed that buffer size was an important factor affecting water quality. Within the 200 m buffer zone, forest land was the most important LULC type affecting water quality, and it was positively correlated with water quality. However, forest, crop, and water were the most important types affecting water quality from 300 m to 800 m. As the buffer zone increased to 800 m, crop land and impervious surfaces gradually became the main LULC types affecting water quality, and they were negatively correlated with water quality. Finally, we suggest increasing the proportion of forest land in the buffer zones with minimally managed grass land near the river in urban areas, and maintaining the natural characteristics in nonurban areas as well as preventing the development of the river bank in exurban areas may all be important for controlling NPS pollution. Acknowledgments: We are grateful to Beijing Municipal Environmental Monitoring Center for hydrologic monitoring stations information and water quality data, as well as Wenjuan Yu and Chunmeng Han for help with the site mapping. We also thank to Daniel L. Childers for constructive suggestions on the manuscript. Funding for this study was supported by the One Hundred Talents Program of Chinese Academy of Science and the National Natural Science Foundation of China (Grant No. 41371197 and 41422104). Author Contributions: Xiang Chen and Weiqi Zhou conceived and designed the research; Xiang Chen and Weiqi Zhou performed the research; Xiang Chen analyzed the data; and Xiang Chen, Weiqi Zhou, Steward T. A. Pickett, Weifeng Li and Lijian Han wrote the paper. Conflicts of Interest: The authors declare no conflict of interest.
References 1. 2. 3.
4. 5. 6. 7. 8.
9.
10. 11.
Vitousek, P.M.; Mooney, H.A.; Lubchenco, J.; Melillo, J.M. Human Domination of earth’s ecosystems. Science 1997, 277, 494–499. [CrossRef] Grimm, N.B.; Grove, J.M.; Pickett, S.T.A.; Redman, C.L. Integrated approaches to long-term studies of urban ecological systems. Bioscience 2000, 50, 571–584. [CrossRef] Pickett, S.T.A.; Cadenasso, M.L.; Grove, J.M.; Boone, C.G.; Groffman, P.M.; Irwin, E.; Kaushal, S.S.; Marshall, V.; McGrath, B.P.; Nilon, C.H.; et al. Urban ecological systems: Scientific foundations and a decade of progress. J. Environ. Manag. 2011, 92, 331–362. [CrossRef] [PubMed] Paul, M.J.; Meyer, J.L. Streams in the urban landscape. Annu. Rev. Ecol. Syst. 2001, 32, 333–365. [CrossRef] Walsh, C.J.; Roy, A.H.; Feminella, J.W.; Cottingham, P.D.; Groffman, P.M.; Morgan, R.P., II. The urban stream syndrome: Current knowledge and the search for a cure. J. N. Am. Benthol. Soc. 2005, 24, 706–723. [CrossRef] Grimm, N.B.; Faeth, S.H.; Golubiewski, N.E.; Redman, C.L.; Wu, J.; Bai, X.; Briggs, J.M. Global change and the ecology of cities. Science 2008, 319, 756–760. [CrossRef] [PubMed] Shen, Z.; Hou, X.; Li, W.; Aini, G. Relating landscape characteristics to non-point source pollution in a typical urbanized watershed in the municipality of Beijing. Landsc. Urban Plan. 2014, 123, 96–107. [CrossRef] King, R.S.; Baker, M.E.; Whigham, D.F.; Weller, D.E.; Jordan, T.E.; Kazyak, P.F.; Hurd, M.K. Spatial considerations for linking watershed land cover to ecological indicators in streams. Ecol. Appl. 2005, 15, 137–153. [CrossRef] Kang, J.H.; Lee, S.W.; Cho, K.H.; Ki, S.J.; Cha, S.M.; Kim, J.H. Linking land-use type and stream water quality using spatial data of fecal indicator bacteria and heavy metals in the Yeongsan River Basin. Water Res. 2010, 44, 4143–4157. [CrossRef] [PubMed] Pacheco, F.A.L.; Sanches Fernandes, L.F. Environmental land use conflicts in catchments: A major cause of amplified nitrate in river water. Sci. Total Environ. 2016, 548–549, 173–188. [CrossRef] [PubMed] Valle Junior, R.F.; Varandas, S.G.P.; Sanches Fernandes, L.F.; Pacheco, F.A.L. Groundwater quality in rural watersheds with environmental land use conflicts. Sci. Total Environ. 2014, 493, 812–827. [CrossRef] [PubMed]
Int. J. Environ. Res. Public Health 2016, 13, 449
12. 13. 14. 15. 16. 17. 18.
19.
20. 21.
22.
23. 24. 25. 26. 27. 28. 29. 30. 31.
32.
33. 34.
15 of 17
Karr, J.R.; Schlosser, I.J. Water resources and the land-water interface. Science 1978, 201, 229–234. [CrossRef] [PubMed] Osborne, L.L.; Wiley, M.J. Empirical relationships between land-use cover and stream water-quality in an agricultural watershed. J. Environ. Manag. 1988, 26, 9–27. Sliva, L.; Williams, D.D. Buffer zone versus whole catchment approaches to studying land use impact on river water quality. Water Res. 2001, 35, 3462–3472. [CrossRef] Zampella, R.A.; Procopio, N.A.; Lathrop, R.G.; Dow, C.L. Relationship of land-use/land-cover patterns and surface-water quality in the Mullica River Basin. J. Am. Water. Resour. Assoc. 2007, 43, 594–604. [CrossRef] Tu, J. Spatially varying relationships between land use and water quality across an urbanization gradient explored by geographically weighted regression. Appl. Geogr. 2011, 31, 376–392. [CrossRef] Carpenter, S.R.; Caraco, N.F.; Correll, D.L.; Howarth, R.W.; Sharpley, A.N.; Smith, V.H. Nonpoint pollution of surface waters with phosphorus and nitrogen. Ecol. Appl. 1998, 8, 559–568. [CrossRef] Kolpin, D.W.; Furlong, E.T.; Meyer, M.T.; Thurman, E.M.; Zaugg, S.D.; Barber, L.B.; Buxton, H.T. Pharmaceuticals, hormones, and other organic wastewater contaminants in U.S. streams, 1999–2000: A national reconnaissance. Environ. Sci. Technol. 2002, 36, 1202–1211. [CrossRef] [PubMed] Ahearn, D.S.; Sheibley, R.W.; Dahlgren, R.A.; Anderson, M.; Johnson, J.; Tate, K.W. Land use and land cover influence on water quality in the last free-flowing river draining the western Sierra Nevada, California. J. Hydrol. 2005, 313, 234–247. [CrossRef] Ongley, E.D.; Zhang, X.; Tao, Y. Current status of agricultural and rural non-point source pollution assessment in China. Environ. Pollut. 2010, 158, 1159–1168. [CrossRef] [PubMed] Pacheco, F.A.L.; Santos, R.M.B.; Sanches Fernandes, L.F.; Pereira, M.G.; Cortes, R.M.V. Controls and forecasts of nitrate fluxes in forested watersheds: A view over mainland Portugal. Sci. Total Environ. 2015, 537, 421–440. [CrossRef] [PubMed] Santos, R.M.B.; Sanches Fernandes, L.F.; Pereira, M.G.; Cortes, R.M.V.; Pacheco, F.A.L. A framework model for investigating the export of phosphorus to surface waters in forested watersheds: Implications to management. Sci. Total Environ. 2015, 536, 295–305. [CrossRef] [PubMed] Arnold, C.L.; Gibbons, C.J. Impervious surface coverage: The emergence of a key environmental indicator. J. Am. Plan. Assoc. 1996, 62, 243–258. [CrossRef] Sonoda, K.S.; Yeakley, J.A.; Walker, C.J. Near-stream landuse effects on streamwater nutrient distribution in an urbanizing watershed. J. Am. Water Resour. Assoc. 2001, 37, 1517–1532. [CrossRef] Wang, J.; Da, L.; Song, K.; Li., B. Temporal variations of surface water quality in urban, exurban and rural areas during rapid urbanization in Shanghai, China. Environ. Pollut. 2008, 152, 387–393. [CrossRef] [PubMed] Li, W.; Shen, Z.; Tian, T.; Liu, R.; Qiu, J. Temporal variation of heavy metal pollution in urban stormwater runoff. Front. Environ. Sci. Eng. 2012, 6, 692–700. [CrossRef] Gilbert, J.K.; Clausen, J.C. Stormwater runoff quality and quantity from asphalt, paver, and crushed stone driveways in Connecticut. Water Res. 2006, 40, 826–832. [CrossRef] [PubMed] Borin, M.; Vianello, M.; Morari, F.; Zanin, G. Effectiveness of buffer strips in removing pollutants in runoff from a cultivated field in North-East Italy. Agric. Ecosyst. Environ. 2005, 105, 101–114. [CrossRef] Sweeney, B.W.; Newbold, J.D. Streamside forest buffer width needed to protect stream water quality, habitat, and organisms: A literature review. J. Am. Water. Resour. Assoc. 2014, 50, 560–584. [CrossRef] Houlahan, J.E.; Findlay, C.S. Estimating the ‘critical’ distance at which adjacent land-use degrades wetland water and sediment quality. Landsc. Ecol. 2004, 19, 677–690. [CrossRef] Vörösmarty, C.J.; McIntyre, P.B.; Gessner, M.O.; Dudgeon, D.; Prusevich, A.; Green, P.; Glidden, S.; Bunn, S.E.; Sullivan, C.A.; Liermann, C.R.; et al. Global threats to human water security and river biodiversity. Nature 2010, 467, 555–561. [CrossRef] [PubMed] Beijing Municipal Bureau of Statistics. Statistical Communique on the 2014 National Economic and Social Development of the City of Beijing. Available online: http://www.bjstats.gov.cn/ xwgb/tjgb/ndgb/ 201502/t20150211_288370.htm (accessed on 25 November 2015). Chinese State Environment Protection Bureau. Water and Wastewater Monitoring Analysis Methods, 4th ed.; Chinese Environment Science Press: Beijing, China, 2002. Chander, G.; Markham, B.L.; Helder, D.L. Summary of current radiometric calibration coefficients for Landsat MSS, TM, ETM+, and EO-1 ALI sensors. Remote Sens. Environ. 2009, 113, 893–903. [CrossRef]
Int. J. Environ. Res. Public Health 2016, 13, 449
35. 36.
37. 38. 39.
40. 41. 42.
43. 44. 45. 46.
47. 48. 49.
50.
51. 52. 53. 54. 55.
56. 57.
16 of 17
Zhou, W.; Troy, A. An object-oriented approach for analysing and characterizing urban landscape at the parcel level. Int. J. Remote Sens. 2008, 29, 3119–3135. [CrossRef] Zhou, W.; Troy, A.; Grove, M. Object-based land cover classification and change analysis in the Baltimore Metropolitan Area using multitemporal high resolution remote sensing data. Sensors 2008, 8, 1613–1636. [CrossRef] Yu, W.; Zhou, W.; Qian, Y.; Yan, J. A new approach for land cover classification and change analysis: Integrating backdating and an object-based method. Remote Sens. Environ. 2016, 177, 37–47. [CrossRef] Qian, Y.; Zhou, W.; Yu, W.; Pickett, S.T.A. Quantifying spatiotemporal pattern of urban greenspace: New insights from high resolution data. Landsc. Ecol. 2015, 30, 1165–1173. [CrossRef] Shen, Z.; Hou, X.; Li, W.; Aini, G.; Chen, L.; Gong, Y. Impact of landscape pattern at multiple spatial scales on water quality: A case study in a typical urbanized watershed in China. Ecol. Indic. 2015, 48, 417–427. [CrossRef] Ministry of Environmental Protection of China. Technical Guideline for Delineating Source Water Protection Areas; China Environmental Science Press: Beijing, China, 2007; p. 3. Ter Braak, C.J.F.; Smilauer, P. CANOCO Reference Manual and CanoDraw for Windows User’s Guide: Software for Canonical Community Ordination (Version 4.5); Microcomputer Power: Ithaca, NY, USA, 2002. Beijing Municipal Bureau of Statistics. Statistical Communique on the 2000 National Economic and Social Development of the City of Beijing. Available online: http://www.bjstats.gov.cn/xwgb/tjgb/ ndgb/200605/t20060526_42168.htm (accessed on 25 November 2015). Tsihrintzis, V.A.; Hamid, R. Modeling and management of urban stromwater runoff quality: A review. Water Resour. Manag. 1997, 11, 137–164. Tang, Z.; Engel, B.A.; Pijanowski, B.C.; Lim, K.J. Forecasting land use change and its environmental impact at a watershed scale. J. Environ. Manag. 2005, 76, 35–45. [CrossRef] [PubMed] Schueler, T.R.; Fraley-McNeal, L.; Cappiella, K. Is impervious cover still important? Review of recent research. J. Hydrol. Eng. 2009, 14, 309–315. [CrossRef] Hopkins, K.G.; Morse, N.B.; Bain, D.J.; Bettez, N.D.; Grimm, N.B.; Morse, J.L.; Palta, M.M.; Shuster, W.D.; Bratt, A.R.; Suchy, A.K. Assessment of regional variation in streamflow responses to urbanization and the persistence of physiography. Environ. Sci. Technol. 2015, 49, 2724–2732. [CrossRef] [PubMed] Freeman, M.C.; Pringle, C.M.; Jackson, C.R. Hydrologic connectivity and the contribution of stream headwaters to ecological integrity at regional scales. J. Am. Water Resour. Assoc. 2007, 43, 5–14. [CrossRef] Wauchope, R.D. The pesticide content of surface water draining from agricultural fields-a review. J. Environ. Qual. 1978, 7, 459–472. [CrossRef] Shober, A.L.; Hochmuth, G.; Wiese, C. An Overview of Nutrient Budgets for Use in Nutrient Management Planning; Institute of Food and Agricultural Sciences: Gainesville, FL, USA, 2011; Available online: http://edis.ifas.ufl.edu (accessed on 26 April 2016). Zheng, H.; Robinson, B.E.; Liang, Y.C.; Polasky, S.; Ma, D.C.; Wang, F.C.; Ruckelshaus, M.; Ouyang, Z.Y.; Daily, G.C. Benefits, costs, and livelihood implications of a regional payment for ecosystem service program. Proc. Natl. Acad. Sci. USA 2013, 110, 16681–16686. [CrossRef] [PubMed] Beijing Municipal Environmental Protection Bureau. Beijing Environmental Statement 2014; Beijing Municipal Environmental Protection Bureau: Beijing, China, 2014. Lee, J.H.; Bang, K.W. Characterization of urban stormwater runoff. Water Res. 2000, 34, 1773–1780. [CrossRef] Yi, L.; Jiao, W.; Chen, X.; Chen, W. An overview of reclaimed water reuse in China. J. Environ. Sci. 2011, 23, 1585–1593. [CrossRef] Burton, M.L.; Samuelson, L.J.; Pan, S. Riparian woody plant diversity and forest structure along an urban-rural gradient. Urban Ecosyst. 2005, 8, 93–106. [CrossRef] Dosskey, M.G.; Vidon, P.; Gurwick, N.P.; Allan, C.J.; Duval, T.P.; Lowrance, R. The role of riparian vegetation in protecting and improving chemical water quality in streams. J. Am. Water Resour. Assoc. 2010, 46, 261–277. [CrossRef] Roberts, W.M.; Stutter, M.I.; Haygarth, P.M. Phosphorus retention and remobilization in vegetated buffer strips: A review. J. Environ. Qual. 2012, 41, 389–399. [CrossRef] [PubMed] Li, Y.; Chen, Z.; Lou, H.; Wang, D.; Deng, H.; Wang, C. Denitrification controls in urban riparian soils: Implications for reducing urban nonpoint source nitrogen pollution. Environ. Sci. Pollut. Res. 2014, 21, 10174–10185. [CrossRef] [PubMed]
Int. J. Environ. Res. Public Health 2016, 13, 449
58. 59. 60. 61. 62. 63. 64.
17 of 17
Palmer, M.A.; Liu, J.; Matthews, J.H.; Mumba, M.; D’Odorico, P. Manage water in a green way. Science 2015, 349, 584–585. [CrossRef] [PubMed] Bernhardt, E.S.; Palmer, M.A. Restoring streams in an urbanizing world. Freshw. Biol. 2007, 52, 738–751. [CrossRef] Osborne, L.L.; Kovacic, D.A. Riparian vegetated buffer strips in water-quality restoration and stream management. Freshw. Boil. 1993, 29, 243–258. [CrossRef] Ouyang, W.; Skidmore, A.K.; Toxopeus, A.G.; Hao, F. Long-term vegetation landscape pattern with non-point source nutrient pollution in upper stream of Yellow River basin. J. Hydrol. 2010, 389, 373–380. [CrossRef] Xiao, H.; Ji, W. Relating landscape characteristics to non-point source pollution in mine waste-located watersheds using geospatial techniques. J. Environ. Manag. 2007, 82, 111–119. [CrossRef] [PubMed] Zhou, T.; Wu, J.; Peng, S. Assessing the effects of landscape pattern on river water quality at multiple scales: A case study of the Dongjiang River Watershed, China. Ecol. Indic. 2012, 23, 166–175. [CrossRef] Wang, M.; Webber, M.; Finlayson, B.; Barnett, J. Rural industries and water pollution in China. J. Environ. Manag. 2008, 86, 648–659. [CrossRef] [PubMed] © 2016 by the authors; licensee MDPI, Basel, Switzerland. This article is an open access article distributed under the terms and conditions of the Creative Commons Attribution (CC-BY) license (http://creativecommons.org/licenses/by/4.0/).