Abstract: Knowledge of spatial variability in soil fertility is important for site specific nutrient management. In this study, spatial variability in properties that ...
World Applied Sciences Journal 14 (7): 1020-1024, 2011 ISSN 1818-4952 © IDOSI Publications, 2011
Spatial Variability in Fertility Status of Surface Soils 1
Patil, S.S., 2V.C. Patil and 3K.A. Al-Gaadi
ITC Limited, Hyderabad, India Precision Agriculture Research Chair, College of Food and Agriculture Sciences, King Saud University, Riyadh, Saudi Arabia 3 Precision Agriculture Research Chair and Department of Agricultural Engineering, College of Food and Agriculture Sciences, King Saud University, Riyadh, Saudi Arabia 1
2
Abstract: Knowledge of spatial variability in soil fertility is important for site specific nutrient management. In this study, spatial variability in properties that influence soil fertility such as soil organic carbon (OC), available N, available P2O5 and available K2O in surface soils of 154 farmers' fields of Karlawad village in Navalgund taluk of Dharwad district of Karnataka (India) were quantified and the respective thematic maps were prepared on the basis of ratings of nutrients. Soils sampled (0-20 cm depth) at 154 locations in an area of 1032.15 ha were analyzed for their composition. Arc Map 9.0 with spatial analyst function of Arc GIS software was used to prepare soil fertility maps. Interpolation method employed was spline. Soils were moderately alkaline in reaction with normal Electrical Conductivity (EC). The coefficient of variation (CV) values for soil OC, available N and available P2O5 were 0.35, 0.32 and 0.30 respectively, in the study area and it was lower (0.16) in case of available K2O. Organic carbon content in the soils was low in majority of the area (683 ha) while it was medium in the remaining area (350 ha). Available nitrogen content was low in 488 ha and medium in 544 ha. Available phosphorus was medium in 622 ha and low in 256 ha and high in the remaining area of 154 ha. The soils in the study area were high in available potassium status. The observed spatial variability in various soil properties that influence soil fertility will help farmers in making crop management decisions. Key words: Spatial variability System
Soil fertility
Site specific nutrient management
INTRODUCTION The traditional approach to soil fertility management has been to treat fields as homogenous areas and to calculate fertilizer requirements on a whole field basis. However, it has been reported for at least 70 years that fields are not homogeneous and sampling techniques to describe field variability have been recommended [1,2]. Describing the spatial variability across a field has been difficult until new technologies such as Global Positioning Systems (GPS) and Geographic Information Systems (GIS) were introduced. GIS is a powerful set of tools for collecting, storing, retrieving, transforming and displaying spatial data [3]. GIS can be used in producing soil fertility map of an area that helps to understand the status of soil fertility spatially and temporally, which will help in formulating site-specific balanced fertilizer recommendation. These technologies allow fields to be mapped accurately and also allow complex spatial relationships between soil fertility factors to be computed.
Geographic Information
This in turn has increased interest in the use of soilsampling techniques that attempt to describe the variability in soil fertility factors within a field. In precision farming, the concept of ‘management zone’ was evolved in response to large variability with the main purpose of achieving efficient utilization of agricultural inputs with respect to spatial variation of soils and its properties. Site-specific management zones are defined as homogeneous sub-regions of a field that have similar yield limiting factors [4,5]. Conceptually, by using a management zone delineation technique, an agricultural field could be classified into management zones that reflect productivity potential. For example, a field may be classified into three zones- high, medium and low productivity potential management zones. Therefore, an appropriate understanding of spatial variability in soil properties is essential at landscape scale. The most important way to gather knowledge in this aspect is to prepare soil maps through spatial interpolation of pointbased measurements of soil properties [2].
Corresponding Author: Dr. V.C. Patil, Precision Agriculture Research Chair, King Saud University, Riyadh, Saudi Arabia. Tel: +96-614697119.
1020
World Appl. Sci. J., 14 (7): 1020-1024, 2011
MATERIALS AND METHODS The study area comprising of Karlawad Village of Navalgund taluk lies between 15° 29' 25" N to 15° 30' 36" N latitude and 75° 13' 48" E to 75° 19' 48" E longitude (Plate 1). The entire area of the village is 1032.15 ha. This village comes under the northern dry zone (Zone-3) of Karnataka and irrigated from Malaprabha Right Bank Canal. Surface soil samples (0-20 cm depth) at random were collected from 154 farmers' fields during October 2008 in the study area before sowing of post rainy season crops to assess the spatial variability in the soil fertility status.
The exact sample location was recorded using a handheld GPS receiver. Processed soil samples were analyzed for various parameters such as pH, Electrical Conductivity (EC), Soil Organic Carbon (OC), available N, available P2O5 and available K2O. Soil pH was determined in 1:2.5 soil-water suspension by potentiometric method [6]. Electrical conductivity was determined in 1:2.5 soil-water extract using Conductivity Bridge and expressed as dSm 1 [7]. The organic carbon content of a finely ground soil sample was determined by Walkely and Black’s wet oxidation method as described by Jackson [6]. Available nitrogen was estimated by alkaline KMnO4 method [8]. Available phosphorus was extracted with sodium bicarbonate (0.5 M) at pH 8.5 (Olsen’s reagent) and the amount of phosphorus was estimated by chloro-stannous reduced phospho-molybdate blue colour method using Spectrophotometer at wavelength of 660 nm [7]. Available potassium in soil was extracted by neutral normal ammonium acetate and subsequent estimation was by flame photometry [7]. Arc Map 9.0 with spatial analyst function of Arc GIS software was used to prepare soil fertility maps. Interpolation method employed was spline. The extent of area in low, medium and high category of nutrients was estimated on the basis of standard ratings. RESULTS AND DISCUSSION Mean, range, standard deviation (SD) and coefficient of variation (CV) of soil chemical properties and nutrient status collected from 154 locations in the study area are presented in Table 1. The soils were slightly to moderately alkaline (pH varied from 8.3 to 9.5) with low soluble salts (EC varied from 0.12 to 0.89 dSm 1). The coefficient of variation (CV) for pHin the study area was 0.025, while for EC it was 0.25. The obtained results were in line with those of Cowrin et al. [9] in saline-sodic soil of California’s San Joaquin Valley. They observed that EC consistently had highest coefficient of variation while pH in the saturation extract consistently had lowest CV at all the depths studied.
Plate 1: Location map of the study area Table 1:
Mean, range, standard deviation (SD) and coefficient of variation (CV) of soil chemical properties and nutrient status collected from 154 locations in the study area
S. No.
pH
E.C. (dSm 1)
O.C. (%)
Available N (kg ha 1)
Available P2O5 (kg ha 1)
Available K2O (kg ha 1)
Mean Range SD CV
8.98 8.3-9.5 0.22 0.025
0.38 0.12-0.89 0.095 0.25
0.40 0.12-0.72 0.14 0.35
321.36 110-549 101.62 0.32
30.66 15-50 8.96 0.30
989.92 672-1584 160.24 0.16
1021
World Appl. Sci. J., 14 (7): 1020-1024, 2011 Table 2: Correlation coefficient (r) between wheat yield and soil fertility status of soils. Variable
Correlation coefficient
Organic carbon
0.772**
Available nitrogen
0.649**
Available phosphorus
0.616*
Available potassium
0.254
* Significant at P=0.05, ** Significant at P=0.01
The CV values for organic carbon, available N and available P2O5 were 0.35, 0.32 and 0.30 respectively and it was lower (0.16) in case of available K2O. The range of spatial dependence was found to vary among soil parameters and within the same field. Soil nutrients were found to be affected by farmer management [10]. Anegundi [11] found that application of ground water alone significantly decreased the soil available nitrogen and phosphorus and increased the bulk density, electrical conductivity (EC), soil K, when compared to only canal water application. There was significant positive correlation between soil OC and available soil nitrogen and phosphorus contents and yield of wheat crop (Table 2).
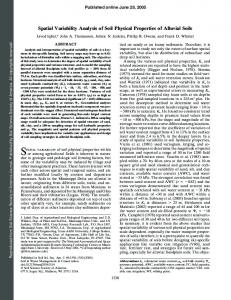
The organic carbon content of the soils in the study area (1032.151 ha) ranged from 0.12 to 0.72 per cent with standard deviation of 0.14. About 682.54 ha (66.13 per cent) area falls under low and 349.61 ha (33.87 per cent) medium category (Fig. 1). The organic carbon in Indian soils ranges from 0.5 to 1.5 per cent [12]. The lower organic carbon content in these soils may be attributed to the poor management practices such as lack of addition of crop residues and organic manures. Intensive cropping is also one of the reasons for low soil organic carbon content. Soils of semi-arid region have low organic carbon than sub-humid soils [13]. The organic matter build up in soils is related to natural vegetation, cropping history and temperature [12]. The observed results were in contrary to those of Kenchanagouda, [14], who observed higher organic carbon content in irrigated soils. Out of the study area of 1032 ha, 544 ha (53 per cent) area was medium in available nitrogen, while 488 ha (45 per cent) was low in available nitrogen (Fig. 2). Nitrogen is the most limiting nutrient in black soils [15], which is subjected to losses through leaching and volatilization. The total nitrogen content in the soils is dependent on temperature, rainfall and altitude [16].
Fig. 1: Organic carbon status of the study area
Fig. 2: Available nitrogen status of the study area
Fig. 3: Available P2O5 status of the study area 1022
World Appl. Sci. J., 14 (7): 1020-1024, 2011
Fig. 4: Available K2O status of the study area The nitrogen status of the soils studied was better than what was reported for the state by Shivaprasad et al. [17]. Other possible reasons would be non-application of recommended dose of fertilizer to the high yielding varieties which need large quantities of nutrients and double cropping system. About 256 ha (25 per cent) of the study area were low in available phosphorus content, 622 ha (60 per cent) area was medium in available phosphorus content and rest of the area (154 ha) was found to be high in available phosphorus content accounting for 15 per cent of the total area (Fig. 3). P2O5 fertilizer is added in high intensity productions systems as in the study area. In contrast to general low levels of phosphorus in majority of the Vertisols area, phosphorus levels in the study area were fairly better. At some locations, P2O5 was exceptionally high, may be due to heavy use of complex fertilizers. The present findings are in line with those of Motsara [18] and Ravikumar et al. [19] who reported that majority of soils in Karnataka and more so in Malaprabha command were medium in phosphorus content. The soils in the study area were found to be very high (ranging from 672 to 1584 Kg K 2O ha 1) in available potassium status (Fig. 4). It is observed that many Vertisols are able to maintain a sufficient or even high level of exchangeable K and to provide a good supply of K to plants for many years [20]. The higher content of available potassium in vertisols may be due to the predominance of potash rich mica containing minerals [21]. Soils of the study area are alkaline. In sodic soil environment, dissolution of large amounts of potash bearing minerals occurs. Patil and Sonar [22] recorded optimal availability of potash in Vertisols of Maharashtra. CONCLUSIONS There was considerable spatial variability in the study area in all the soil parameters studied except potassium content. The results of the study are of
potential practical use in determining site specific nutrient management practices, that would help in improving fertilizer use efficiency, reducing cost of cultivation and preventing environmental pollution. REFERENCES 1.
Flower, M., R. Weisz and G. White, 2005. Yield-based management zones and grid sampling strategies: Describing soil test and nutrient variability. Agron. J., 97: 968-982. 2. Santra, P., V.K. Chropra and D. Chakraborty, 2008. Spatial variability of soil properties and its application in predicting surface map of hydraulic parameters in an agricultural farm. Curr. Sci., 95(7): 937-945. 3. Burrough, P.A. and R.A. McDonnell, 1998. Principles of Geographical Information Systems. Oxford University Press, New York. 4. Doerge, T., 1999. Defining management zones for precision farming. Crop Insights, 8(21): 1-5. 5. Khosla, R. and T. Shaver, 2001. Zoning in on nitrogen needs. Colorado State Univ. Agron. Newsletter, 21(1): 24-26. 6. Jackson, M.L., 1967. Soil Chemical Analysis. Prentice Hall of India, New Delhi. 7. Jackson, M.L., 1973. Soil Chemical Analysis. Prentice Hall of India, New Delhi. 8. Subbaiah, B.V. and G.L. Asija, 1956. Rapid procedure for estimation of available nitrogen in soil. Curr. Sci., 25: 259-260. 9. Cowrin, D.L., S.R. Kaffka, J.W. Hopmans, Y. Mori, J.W. Van Groenigen, C. Van Kessel, S.M. Lesch and J.D. Oster, 2003. Assessment and field-scale mapping of soil quality properties of a saline-sodic soil. Geoderma, 144: 231-259. 10. Ayoubia, S., S.M. Zamani and F. Khormali, 2007. Spatial variability of some soil properties for site specific farming in northern Iran. International J. Plant Prod., 1(2): 225-236.
1023
World Appl. Sci. J., 14 (7): 1020-1024, 2011
11. Anegundi, K.M., 1997. Effect of conjunctive use of canal and ground water on soil, properties and yield of wheat in vertisols of Ghataprabha command area. Ph.D. Thesis, Univ. Agric. Sci. Dharwad. 12. Dudal, R., 1965. Dark clay soils of tropical and subtropical regions. Agriculture Development Paper 83 FAO, Rome, pp: 155-170. 13. Jagadish Prasad and Gajbhiye, K.S., 1998. Vertical distribution of micronutrients cations in some vertisol profiles occurring in different ecoregions. J. Indian Soc. Soil Sci., 47: 151-153. 14. Kenchanagouda, S.K., 1977. Effect of continuous irrigation on physical, chemical and mineralogical properties of the soils of Tungabhadra project command area. Ph.D., Thesis, Univ. Agric. Sci., Bangalore. 15. Stewart, 1988. Distribution, proportion and management of vertisols of India. Advan. Soil Sci., 8: 151-200. 16. Biju Joseph, 1994. Studies on phosphorus in soybean, wheat crop sequence in vertisols. M.Sc.(Agri.) Thesis, Univ. Agirc. Sci., Dharwad.
17. Shivaprasad, C.R., R.S. Reddy, Sehgal and M.M. Velayutham, 1998. Interpretation for soil and land resource management. NBSS and LUP, Nagpur, 47: 65-68. 18. Motsara, M.R., 2002. Available nitrogen, phosphorus and potassium status of Indian soils as depicted by soil fertility maps. Fert. News, 47: 15-21. 19. Ravikumar, M.A., P.L. Patil and G.S. Dasog, 2007. Mapping of nutrient status under 48A distributory in Malaprabha Right Bank Command of Karnataka by Giographic Information Technique-I: Major-nutrients. Karnataka J. Agric. Sci., 20(4): 735-737. 20. Finck, A. and J. Venkateshwarlu, 1982. Vertisols and rice soils of the tropics. Symposia papers II 12 th International Congress of Soil Science, New Delhi. 21. Kapoor, B.S., H.B. Singh and S.C. Goswami, 1981. Acalcime in a sodic profile. J. Ind. Soc. Soil Sci., 28: 513-515. 22. Patil, Y.M. and K.R. Sonar, 1993. Dynamics of potassium in swell-shrink soils of Maharashtra. J. Potassium R., 9: 315-324.
1024