SPATIAL VARIABILITY OF THE SNOWPACK: EXPERIENCES WITH MEASUREMENTS AT A WIDE RANGE OF LENGTH SCALES WITH SEVERAL DIFFERENT HIGH PRECISION INSTRUMENTS Hans Peter Marshall1,2, Gary Koh2, Matthew Sturm2, Jerome Johnson2, Mike Demuth3, Chris Landry4, Jeff Deems5, Andy Gleason6 1. 2. 3. 4. 5. 6.
Institute of Arctic and Alpine Research, University of Colorado at Boulder Cold Regions Research and Engineering Laboratory Glaciology Section, Geological Survey of Canada Center for Snow and Avalanche Studies Watershed Sciences, Colorado State University Department of Geology and Geophysics, University of Wyoming
Snow exhibits an extremely wide range of material properties over both short spatial as well as temporal scales compared with most other materials. Recent increases in resolution, precision, and speed of quantitative, state-of-the-art snow science instruments have made detailed measurements covering a wide range of length scales possible in a reasonable length of time. New automated unbiased measurements allow direct quantitative comparisons between measurements made by different observers, and allow 10-1000 times more data points to be collected when compared with manual measurements. This increase in data is necessary for understanding spatial variability at a wide range of length scales, due to the highly variable nature of snow. Data from three hi-tech snow science instruments (radar, penetrometer, and an automatic depth probe) collected in alpine, polar, and sea-ice snowpacks indicate that the degree of spatial variability varies widely depending on both environmental conditions and the resolution of the instrument used. KEYWORDS: spatial variability, radar, penetrometer, snow depth, snow instrumentation Hopefully tools such as these will eventually allow snow scientists and practitioners to more efficiently collect enough information to accurately characterize the distribution, and structure, of snowpack properties in the region of interest. This may someday lead to more accurate prediction of avalanche danger, flood forecasting, calibration of remote sensing tools, in addition to a better characterization of the changes in the seasonal snowpack due to global warming. Spatial variability in snow is still poorly understood, and few studies have quantified the degree of variability in many environments. Manual snowpack measurements are timeconsuming, and measurements at a 5-meter resolution or less have been shown to be required to capture much of the spatial structure in alpine environments (Fassnacht and Deems, 2006). Aircraft measurements using light detection and ranging (LiDAR) have shown great promise for improving our understanding of spatial variability of snow depth at a range of scales (Deems et al, 2006), however this type of survey is often prohibitively expensive.
1. INTRODUCTION The distribution of the physical and mechanical properties of the snowpack are important for avalanche prediction, hydrologic forecasting, ground truth of remote sensing measurements, and climate change studies. Unfortunately, the large degree of spatial variability of these properties makes estimates of the distribution and spatial structure from point measurements extremely difficult. Typically, measurements from a few snowpits and/or automatic weather stations are extrapolated to estimate properties over large regions, although variability is known to be large (e.g. Sturm et al, 2004;Kronholm et al, 2004). Recent advances in technology have resulted in new high-tech, snow science instruments that allow orders-of-magnitude more information to be collected in the same amount of time as traditional snowpit measurements. ______________________ * Corresponding author address: H.P. Marshall, Institute of Arctic and Alpine Research, University of Colorado at Boulder.
[email protected], 303-859-3106.
359
2.2 SnowMicroPenetrometer
Here we present data from three different state-of-the-art snow science instruments that allow 10-1000 times more data points to be collected when compared with traditional methods. Measurements were made in alpine, polar, and sea-ice snowpacks, and the degree of variability of snowpack properties in each of these environments is described.
In order to demonstrate the variability of mechanical properties of snow, of critical importance for avalanche prediction, we present measurements using a high resolution snow penetrometer (Schneebeli and Johnson, 1998;Johnson and Schneebeli,1999.) This instrument can profile a 1 meter snowpack in approximately 2 minutes, providing penetration resistance data at a resolution of 0.004mm. These measurements were made in all three environments.
2. DATA Each of the instruments below measures snowpack structure at a different resolution, and with a different support, or sampled area per measurement. There is a trade-off between the sampling resolution and the scale over which the measurements can be made, however these new high-tech instruments are allowing measurements at higher resolution. Due to the increase in sampling speed they provide, datasets covering larger scales can be obtained. Note, however, that there does not exist a probe which can directly measure stability; these instruments measure snow structure (such as depth, SWE, hardness, etc). Snow structure and stability are closely related, however, and hopefully measurements of snow structure will lead to a better understanding of the causes of spatial variability of the snowpack.
2.3 MagnaProbe An automatically recording snowdepth probe, with an integrated GPS, was used to rapidly measure snow depth along many of the FMCW radar profiles in the sea ice environment. This instrument allows the user to make at least an order of magnitude more snowdepth measurements than possible with a traditional avalanche probe and notebook. 3. METHODS 3.1 Quantifying Spatial Variability The traditional analytical tool for quantifying spatial variability in geostatistics is the semivariogram (e.g. Isaaks and Srivastava, 1989; Deutsch and Journal,1998). It has previously been used in the snow science literature (Bloschl, 1999; Birkeland and Kronholm, 2004; Deems et al, 2006) to describe variability of snow depth and penetration hardness. Here we use the generalized relative semi-variogram (Isaaks and Srivastava,1989), to facilitate comparison of the variability different snowpack properties:
2.1 FMCW radar We used a high frequency broadband Frequency Modulated Continuous Wave (FMCW) radar to profile the stratigraphy and snow depth in each environment. This technique has been used previously in snow and avalanche research with success (e.g. Gubler and Hiller, 1984; Koh and Jordan, 1995; Holmgren et al, 1998). The two-way travel time of the radio wave can be used to estimate snow depth and snow-water equivalent (SWE) to within less than 10% (Marshall et al, 2005; Marshall, 2005). Our previous measurements have also shown that the internal snowpack reflections show good agreement with layer boundaries identified with the SnowMicroPenetrometer (Marshall et al, in press). Higher frequencies are more sensitive to subtle layer transitions, while lower frequencies are required to penetrate wet snowpacks (Marshall et al, 2004), therefore we use a system which can operate from 2-18 GHz.
G(h)=1/N(h) S[(u-v) 2 /m(h) 2] where S[] is the sum over the N(h) pairs of data points (u,v) that are separated by a distance h. This is the same as the traditional semivariogram, but it is divided by the square of the mean of the data m(h) used in the sum. Finally, the function we will display is the square-root of 2 times the above equation: 2G ( h ) . This statistic represents the average relative difference of two measurements separated by a distance h. For example, if the value of this function at h=5 meters is 0.5, on average, two 360
measurements separated by 5 meters will differ by 50%.
an average depth over the antenna footprint (about 50cm x 50cm here). Note that the Magna probe also has a larger variability at the (smallest) 50 cm measurement spacing – on average, adjacent probes differ by 10%, while radar measurements at 50 cm spacing differ by ~2%.
3. RESULTS Spatial variability in snowpack properties is largely controlled by the interaction of wind, vegetation, and topography. Each of the locations sampled (alpine, sea ice, polar) show a different degree of variability, most likely due to differences in the dominant processes controlling variability.
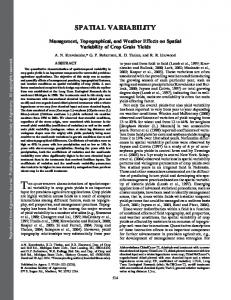
3.2 Devon Ice Cap, Canadian Arctic This study site is located at the summit of Devon Ice Cap, Devon Island, located north of Baffin Island in the Canadian Arctic. Again, there is no vegetation, and the large scale topography is minimal, as the measurements were made on the broad, flat summit. However, sastrugi form in the new snow each year, therefore smallscale roughness and wind interact together to control the spatial variability. Figure 2 below shows the modified semi-variogram of radar depths to the fall snow surface (about 6 months of snow accumulation) in the upper panel. The lower panel shows the modified semi-variogram of surface hardness in the same area.
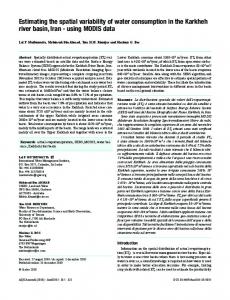
3.1 Barrow, Alaska These measurements were made on the sea ice of the Chuckchi Sea, north-west of the town of Barrow. The substrate consisted of first-year sea-ice, therefore the ice surface was completely flat to begin with, and without vegetation. The variability in snow depth in this environment, therefore, is controlled entirely by wind. Here we present snow depth data measured with the FMCW radar and Magna Probe along a 300 m line. Radar measurements were made every 10cm, and snow depth probe measurements were made every 50 cm. The modified semi-variograms are shown in Figure 1 below.
Figure 2: Semi-variograms of depth to the fall snow surface (upper panel) measured with FMCW radar, and of surface hardness measured with the SnowMicroPenetrometer (SMP). FMCW radar measurements shown in the upper panel of Figure 2 were made every 5 cm over 1 km. Note that the range is significantly less than that over sea-ice, possibly due to the effect of the sastrugi causing drifting on shorter length scales. The large-scale variability, however, is very similar, as in both environments at separation distances greater than the range, we expect variations of approximately 50%. In contrast, the mechanical properties of this snow cover show a much higher degree of
Figure 1: Semi-variograms of snow depth measured with FMCW radar (circles) and MagnaProbe (+’s). Both instruments have a very similar range near 40 m. The MagnaProbe measurements show more variability, which is expected since they each have a different support. The MagnaProbe measurements are point measurements, while the radar estimates
361
The profile parallel to the wind direction shows the most variability of any of the study sites. At a separation distance of 10 meters, the depths vary by more than 50%, and at 20 meters they vary by close to 100%.
variability. The SMP measurements shown in the lower panel of Figure 2 were made every 20 cm, along two different 20 meter transects. Note that measurements just 20 cm apart can vary quite significantly, on average about 58%. The range is much shorter for the mechanical properties, at 5.5 meters, and at this separation distance the hardness varies by 85% on average.
3.3 Swamp Angel Study Plot, Colorado The Swamp Angel Study Plot is located at the summit of Red Mountain Pass, Colorado. This site is below treeline, in a relatively flat meadow, well-protected from the wind. The location that was profiled was at least 20 meters from any large trees, therefore little spatial variability was expected. Figure 4 shows the modified semivariogram in the North-South and East-West directions at this site. In sharp contrast to the measurements at Niwot Ridge, this site shows the least variability of any of the study sites. All of the major factors controlling spatial variability are small, and this is reflected in the measurements.
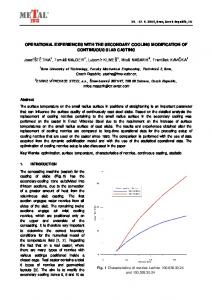
3.3 Niwot Ridge, Colorado The next study site is in a subalpine forest clearing on Niwot Ridge, Colorado. This site also experiences a great deal of wind, and in addition has vegetation and small scale topography. Two perpendicular radar profiles were measured. One profile was performed perpendicular to the predominant wind direction and along the downwind side of the clearing, where the deepest snow was located. The second profile was measured perpendicular to the first profile, and parallel to the predominant wind direction. The upper panel of Figure 3 shows the profile pallel to the wind, and the lower panel shows the profile perpendicular to the wind direction.
Figure 4: Snow depth measured with FMCW radar at Swamp Angel Study Plot. The circles show measurements in the North-South direction, and the +’s show measurements in the East-West direction. Figure 3: Snow depth measured with FMCW radar at Niwot Ridge. Upper panel shows the semi-variogram for a profile parallel to the predominant wind direction; the lower panel is the semi-variogram from a profile perpendicular to the wind direction.
At this site the snow depth measurements show a range of 5-10 meters, however the variability is less than 5% at all separation distances measured. This is near the accuracy of the radar depth estimates due to unknown changes in average density, therefore inferences should not be made about the range at this very low level of variability.
The profile perpendicular to the wind direction (lower panel) shows very little spatial variability in snow depth, with a range of approximately 18 meters. Even at separation distances larger than the range, the snow depth varies by ~10%.
362
forecasts, ground truth satellite measurements, and study climate change.
3. CONCLUSIONS This paper presented results from snowpack measurements in alpine, polar, and sea ice snowpacks. The study sites in each of these very different environments had factors which controlled the variability to differing degrees. Variability ranged from less than 5% to more than 100% depending on conditions. Mechanical properties varied over much shorter distances than snow depth. Point measurements with the Magnaprobe showed a larger degree of variability than the radar measurements, due to a difference in support. From an avalanche perspective, these quantitative results agree well with what practitioners have observed for years. Due to the large degree of spatial variability in the snowpack, especially where wind has a dominant effect such as above treeline, many small hasty pits are probably much more useful than one full detailed profile. In addition, mechanical properties can vary to a large degree over quite short distances. Previous work has shown that stability varies to a greater degree and over shorter length scales than the snow structure (depth,SWE,hardness,etc) that these new instruments are measuring. Large variability in stability has been measured even on slopes which are very uniform, containing little variability in stratigraphy (Landry et al, 2004). This indicates that larger stability tests such as the Rutschblock might capture a larger proportion of the variability present in some situations, making it potentially more reliable than smaller stability tests, if the location is chosen wisely. However, the time required usually limits recreational skiers to no more than one large scale test, therefore many well-spaced small stability tests might be a much better approach to stability evaluation, especially for skiers with less experience in choosing a representative location. With new snow science tools that allow rapid sampling over large areas, snow scientists can begin to answer questions about spatial variability. Hopefully an increase in understanding of the degree of spatial variability in many different environments will lead to more efficient sampling strategies. Combined with state-of-the-art sampling tools, snow scientists and practitioners will be better prepared to provide more accurate avalanche and flood
3. ACKNOWLEDGEMENTS This work was funded by a NASA Earth Systems Science Fellowship, the 2006 NASA AMSIR-Ice validation campaign, and the 2005/2006 CryoSat Devon Ice Cap calibration/validation campaign (through the Geological Survey of Canada). Most of the equipment used was generously provided by CRREL. We would like to thank John Holmgren, Andy Nichols, Evan Levine, Brian Lazar, Paul Kirschner, Austin Williamson, Conor Byrne, and Isaac Velander for help with the field work. Mark Williams allowed us to make measurements during his class field trip, and his students helped with the ground truth measurements. 3. REFERENCES Birkeland, K.W., Kronholm,K., 2004. A comparison of spatial patterns of penetration resistance of slabs and weak layers. Proceedings of the 2004 ISSW, Jackson Hole, WY. Bloschl, G., 1999. Scaling issues in snow hydrology. Hydrological Processes 13, p. 2149-2175. Deems, J.S., Fassnacht, S.R., Elder, K.J., 2006. Fractal distribution of snow depth from LiDAR data. Journal of Hydrometeorology 7(2), p. 285 - 297. Deutsch, C.V., Journel, A.G., 1998. GSLIB: Geostatistical Software Library and User’s Guide. Oxford University Press. Fassnacht, S.R., Deems, J.S., 2006. Measurement sampling and scaling for deep montane snow depth data. Hydrological Processes 20, p. 829 - 838 Gubler, H., Hiller, M., 1984. The use of microwave FMCW radar in snow and avalanche research. Cold Regions Science and Technology, 9, 109–119. Holmgren, Sturm, M., Yankielun, N., Koh, G., 1998. Extensive measurements of snow depth using FM-CW radar. Cold Regions Science and Technology, 27, 17–30. Isaaks, E.H., Srivastava, R.M., 1989. Applied Geostatistics. Oxford University Press.
363
Johnson, J.B., Schneebeli, M., 1999. Characterizing the micro structural and micro mechanical properties of snow. Cold Reg. Sci. Technol., 30, 91-100. Koh, G., Jordan, R., 1995. Sub-surface melting in a seasonal snow cover. Journal of Glaciology , 41(139), 474–482. Kronholm, K., 2004. Spatial variability of snow mechanical properties with regard to avalanche formation. Ph.D. thesis, University of Zürich, Zürich, 158 pp. Kronholm, K., Schweizer, J., 2003. Snow stability variation on small slopes. Cold Regions Science and Technology, 37(3), 453–465. Landry, C., Birkeland, K., Hansen, K., Borkowski, J., Brown, R., Aspinall, R., 2004. Variations in snow strength and stability on uniform slopes. Cold Reg. Sci. Technol., 39, 205-218. Marshall, H.P., Koh, G., Forster, R., 2004. Ground-based FMCW radar measurements in wet and dry snowpacks, Colorado, U.S.A. – An analysis and summary of the 2002-03 NASA CLPX data, Hydrological Processes 18, 3609-3622 Marshall, H.P., Koh, G., Forster, R., 2005. Estimating alpine snowpack properties using FMCW radar, Annals of Glaciology, v. 40 (1), 157-162. Marshall, H.P., 2005. Snowpack spatial variability: towards understanding its effect on remote sensing measurements and snow slope stability. Ph.D. thesis, University of Colorado at Boulder, 264 pp. Marshall,H.P., Schneebeli, M., Koh, G., in press. Snow stratigraphy measurements with high frequency radar: comparison with snow micro-penetrometer. Cold Reg. Sci. Technol. Schneebeli, M., Johnson, J.B., 1998. A constantspeed penetrometer for high-resolution snow stratigraphy. Ann. Glaciol., 18, 193-198. Sturm, M., Johnson, J., Holmgren, J., 2004. Variations in the mechanical properties of arctic and subarctic snow at local (1m) to regional (100-km) scales. Proceedings of the International Symposium on Snow Monitoring and Avalanches (ISSMA-2004), Manali, India, pp. 233-238.
364