MARINE ECOLOGY PROGRESS SERIES Mar Ecol Prog Ser
Vol. 383: 285–294, 2009 doi: 10.3354/meps07970
Published May 14
Spatial variation in growth, condition and maturation reaction norms of the Baltic herring Clupea harengus membras Anssi Vainikka1,*, Fabian Mollet 2, Michele Casini 3, Anna Gårdmark1 1
Institute of Coastal Research, Swedish Board of Fisheries, PO Box 109, 742 22 Öregrund, Sweden Wageningen Institute for Marine Resources and Ecological Studies (IMARES), PO Box 68, 1970 AB, IJmuiden, The Netherlands 3 Institute of Marine Research, Swedish Board of Fisheries, PO Box 4, 453 21 Lysekil, Sweden
2
ABSTRACT: Understanding of spatial patterns in life-history traits can help fisheries management focus on biologically and functionally relevant stock units. In the present study, we examined lifehistory variation in growth, condition and maturation of the Baltic herring Clupea harengus membras among different areas of the Baltic Sea. As expected based on environmental gradients, herring grew faster in southern than in northern areas. The condition factor for young individuals was higher in the north, but higher for older individuals in the south. Probabilistic maturation reaction norms (PMRNs) based on age, length and condition indicated counter-gradient variation: young herring in the northern areas reached the size at which they had a 50% probability of maturing when they were comparatively smaller than the southern specimens. However, the north–south differences in PMRNs were reversed in older age groups. This indicated that maturation of herring in the north was more size dependent (zero PMRN slope) than it was for herring in the south, where maturation was predominantly determined by age (negative PMRN slope). The geographical differentiation in maturation schedules would potentially translated into divergent changes in recruitment in response to changes in density-dependent growth and, hence, also fishing patterns. KEY WORDS: Clupeid · Counter-gradient variation · Life-history evolution · Phenotypic plasticity · PMRN · Size-selective fishing Resale or republication not permitted without written consent of the publisher
INTRODUCTION According to life-history theory, organisms maximise their expected lifetime fitness by varying energy intake and the subsequent allocation of resources to reproduction and somatic growth over their lifespan (Roff 1992, Stearns 1992, Arendt 1997). Variation in growth and maturation is commonly observed in fishes at geographical scales matching the range of their distribution and exploitation (e.g. Morgan & Bowering 1997, Hutchings et al. 2007, Yoneda et al. 2007). Phenotypic life-history variations result from the interplay between genetic constraints and the environment (e.g. Ernande et al. 2004), so that organisms often adapt to compensate for environmental gradients along their distribu-
tion range (Levins 1969, Conover & Present 1990). This phenomenon is known as counter-gradient variation (CGV; Conover & Schultz 1995), and occurs in growth rates (Belk et al. 2005, Yamahira et al. 2007) and maturation schedules (Olsen et al. 2005). CGV is rarely directly detectable in nature, but common-garden experiments may reveal that individuals living in harsh environmental conditions characterized by low temperatures, low food availability and strong competition grow faster or mature earlier than animals living in favourable conditions characterized by high temperatures, high food availability and weak competition (Arendt & Wilson 1999). Atlantic herring Clupea harengus is a polymorphic species that consists of several metapopulations. Dif-
*Email:
[email protected]
© Inter-Research 2009 · www.int-res.com
286
Mar Ecol Prog Ser 383: 285–294, 2009
ferent stock components typically overlap spatially during feeding (e.g. Aro 1989), but maintain their respective genetic divergence by natal homing to spawning grounds or heritable straying into temporal spawning groups (McQuinn 1997, Rajasilta et al. 2001, Jørgensen et al. 2005a,b, Larsson et al. 2007). Baltic herring C. harengus membras is a major component of the pelagic ecosystem in the Baltic Sea, in which spawning occurs more or less continuously throughout the spring and summer. Western Baltic herring in the proximity of the North Sea show several meristic (Rosenberg & Palmén 1981) as well as genetic differences from other North Atlantic stocks, as detected using microsatellite markers (Ruzzante et al. 2006). In the eastern Baltic Sea, neutral genetic markers suggest minor adaptation over salinity and temperature gradients, but no clear isolation by distance (Jørgensen et al. 2005a, but see Rajasilta et al. 2006). Herring may also have lost considerable genetic variation in the course of their colonisation of the Baltic Sea (Johannesson & André 2006). Nevertheless, life-history traits may be differentiated even when neutral genetic markers fail to demonstrate differences (Hutchings et al. 2007). Since a trade-off exists between reproduction and somatic growth in an individual’s energy budget (see e.g., Von Bertalanffy & Pirozynski 1953, West et al. 2001), covariation between these traits is expected at both the genetic and the phenotypic level. The dependence of sexual maturation on growth is captured by the concept of the probabilistic maturation reaction norm (PMRN; Heino et al. 2002). The PMRN describes the probability of an animal maturing as a function of age and of predominantly externally (ecologically or environmentally) driven variables, such as body length, body mass, or condition (Heino et al. 2002, Grift et al. 2007). Assuming that all environmental effects translate into differences in the length or condition of the fish, the estimated PMRN, by definition, removes these effects and yields a potentially genetic norm of reaction for maturation (Heino et al. 2002). Therefore, estimation of PMRNs has been applied in studies on long-term, potentially genetic, changes in maturation schedules (e.g. Olsen et al. 2005, Barot et al. 2004b). Although it is unlikely that growth captures all environmental factors affecting maturation (Kraak 2007, Marshall & McAdam 2007), there is no evidence that other characteristics of individual fish would affect maturation more than growth (Reznick 1993, Morgan & Lilly 2006). In the present study, we explored spatial variation in growth, condition and maturation of the 1997 to 2001 cohorts of Baltic herring, and used the PMRN method to examine whether some of the phenotypic variation in maturation is independent of differences in growth and condition. The null hypothesis of our study is that
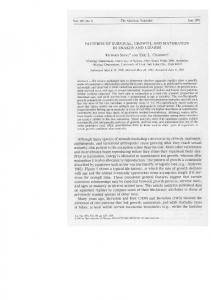
an equal PMRN is found across areas, and due to fast growth in the south and slow growth in the north it translates into early maturation in the south and late maturation in the north, respectively. There are 3 alternative hypotheses for CGV (Fig. 1). (1) Fish display CGV in growth, but not in PMRNs; thus, although fish in the north have a higher genetic growth rate, phenotypic expression of growth, due to the harsher northern environment, equals that in the south. This would result in similar age- and size-at-maturation across the areas (Fig. 1a). (2) Fish display CGV only at maturation, so that a lower PMRN in the north would compensate for slower growth. This would result in a similar age-at-maturation across the areas, but a larger sizeat-maturation in the south due to faster growth (Fig. 1b). (3) Fish display CGV both in growth and maturation (Fig. 1c), resulting in different ages and sizes at maturation in the south and in the north.
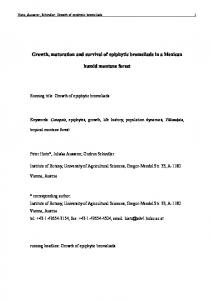
MATERIALS AND METHODS Data. Data from Finnish and Swedish commercial landings (January to March) by pelagic and bottom trawlers and from fishery-independent acoustic surveys (October) covered the entire northern and western parts of the Baltic Sea, i.e. ICES (International Council for Exploration of the Sea) subdivisions (ISD) 25 and 27 to 31 (Fig. 2, Table 1). The length (to the nearest 5 mm) and weight (to the nearest 1 g) of 5 fish were measured for every 5 mm interval per sampling location (2 sampling locations in each rectangle within subdivisions), except for the Swedish commercial samples in which fish were collected randomly. For all length strata, 585 607 randomly collected fish were available for the estimation of population-level length distributions. Age was determined from otoliths by considering 1 January as the birth date, but, for the analyses, the age of herring sampled between January and June was reduced by 1 yr. Thereby, all fish from a cohort belonged to the same age group independent of the sampling time. In order to obtain equal temporal coverage for all ISDs, only cohorts from 1997 to 2001 (data from catch years 1998 to 2006) were considered in the analyses. The age classes relevant to maturation, ages 1 to 4 yr, were included in the estimation. Maturity status was determined by macroscopic examination, using a scale of from 4 to 8 stages (survey samples, 8 stages; 1 to 2: immature, 3 to 5: maturing, 6: ready to spawn, 7: spent, 8: spent but maturing again [see ICES 1962]; Swedish commercial samples, 5 stages; 1 to 2: immature, 3 to 4: mature, 5: spent; Finnish commercial samples, 4 stages; 1: immature, 2 to 3: mature, 4: spent), according to which the fish were re-classified as ontogenetically mature or immature. In Swedish com-
Vainikka et al.: Life-history variation in Baltic herring
287
Fig. 2. Map of the Baltic Sea showing the area divisions (ICES subdivisions). Data were not available for the hatched subdivisions
Fig. 1. Illustration of growth curves (thin lines) and probabilistic maturation reaction norms (PMRNs, bold lines) for Hypotheses (a) 1, (b) 2 and (c) 3 (see ‘Introduction’) assuming that environmental conditions in the south (S, grey lines) are more favourable than in the north (N, black lines). By definition, the PMRN is a genetic property; growth rates, in contrast, may vary with environmental conditions, resulting in observable phenotypic growth (dashed line) and the corresponding observable age-at-maturation (Am) (dotted arrow). PN and PS: phenotypic growth rates in the north and south; GN and GS: genetic traits in the north and south. When the trait values in the north and south coincide, a black line is shown. The 3 hypotheses result in 3 alternative spatial patterns of phenotypic age- and size-at maturation: (1) identical age- and size-at-maturation in south and north, (2) identical age-at-maturation, but different size-atmaturation in south and north, or (3) both age- and size-at-maturation differ between south and north (slopes of the PMRN in Panel c are different only for illustrative purposes)
mercial samples, Stages 3 to 5 and, in Finnish commercial samples, Stages 2 to 4 were considered sexually mature. The time of sampling in acoustic surveys (October) was relatively early with regard to spawning in the following spring to summer, and may have resulted in un-
derestimation of the number of sexually mature fish. Since some Class 2 herring in survey samples would spawn in the following summer, we performed all PMRN estimations using either Stage 2 or 3 as the first sexually mature stage in the survey samples (from here on the ‘Stage 2 or 3 criterion’). However, the Stage 2 criterion was considered the most representative and the most comparable to the Finnish scale and is therefore used as a baseline for the results. Analysis of spatial variation in growth and condition. Analysis of variance (ANOVA) was used separately for each age class to study which of the factors year, ISD, sex or data source explained the variation in length and condition. Saturated ANOVA models indicated that none of the interaction terms between the factors significantly explained the variance in length-at-ages (not shown), and therefore they were left out of the final model (see Table 2). To account for size stratification in the sampling, the least squares were weighted by the relative frequency of the respective size classes in the length distribution of the population. Since the area and data source effects were confounded in these analyses and no overlapping data from Finnish and Swedish sources were available for ISDs 30 and 31 for the studied period,
288
Mar Ecol Prog Ser 383: 285–294, 2009
Table 1. Clupea harengus. Samples of age-determined herring that were used in the analysis for spatial variation in length-atage, condition and probabilistic maturation reaction norms (PMRNs). Lengths-at-age for the analyses of PMRNs were estimated only from survey data, except for ICES subdivisions (ISD) 30 and 31, for which Finnish commercial data were used in the absence of surveys in these areas. All surveys were conducted in October, and commercial data from January to March were used, except the Bothnian Bay data, which were from April to June ISD 25 27 28 29
30 31 Total
Area Southern Baltic Proper Western Baltic Proper Eastern Baltic Proper Northern Baltic Proper and Archipelago Sea Bothnian Sea Bothnian Bay 19 946
Survey Swedish Finnish data commercial commercial 7206
590
0
4980
641
0
1318
65
0
2906
0
0
0 0
716 0
748 776
16 410
2012
1524
m(a, l ) = m(a, l ,c ) =
we performed an additional analysis of ISD 30 data for the year 2007, when data from both Finnish commercial samples and from a Swedish acoustic survey were available. Comparison of Finnish commercial and Swedish acoustic survey data for year 2007 (N = 277 Finnish and N = 2301 Swedish age-determined herring) did not reveal any differences in length-at-age (ANOVA on raised data, p > 0.54). Hence, differences between ISDs were assumed to arise from spatial variation rather than from differences in sampling. The length–mass relationship was modelled as: log(w) = α + βlog(l), where w is total body mass (g) and l is body length (cm). The estimated length–mass scaling factor β = 3.1446 was used throughout the analyses to define the dimensionless allometric condition factor as: K = s wl –β
condition factor between mature and immature individuals. Fully factorial ANOVAs with month, cohort and ISD as factors were run separately for immature and mature fish to output the monthly estimates of condition. Analysis of PMRNs. PMRNs were estimated using the demographic estimation method of Barot et al. (2004a,b). The 2- and 3-dimensional (2D and 3D) maturation reaction norms (Eqs. 2 & 3, respectively) were constructed for ISDs and cohorts separately as:
(1)
where s is a scaler with value 100 g–1 cm– 3. To explore sources of variation in condition, we used a customised ANOVA model, including all main effects and secondorder interactions between ISD and sex, and ISD and maturity status, on individual data with the assumption that size stratification would not affect the estimates of condition (the condition factor was statistically independent of length). To examine the potential interplay of condition and the onset of maturation, additional Swedish commercial data (from all months) for cohorts from 1997 to 2001 (N = 7911) were pooled with the autumn and winter data for the analysis of seasonal variation in the
o(a, l ) − o(a − 1, l − Δ l ) 1 − o(a − 1, l − Δ l )
o( a,l , c )– o( a –1, l – Δ l , c – Δ c ) 1– o( a –1, l – Δ l , c – Δ c )
(2) (3)
where maturation ogives o(a,l), i.e. probabilities of being mature, are defined as a function of age (a) and size (length, l) in Eq. (2), and additionally of condition (c) in Eq. (3). We assumed that no fish could mature at age 0, so at age 1 the PMRN equals the ogive, i.e. m(a = 1, l, c) = o(a = 1, l, c). To estimate the annual length increments Δl, we used growth data from the surveys and Finnish commercial samples only, to eliminate the potentially biasing effect of Swedish commercial samples having relatively high length-at-ages. Due to the absence of data in the ice-covered, mid-winter period in ISD 31, we used Finnish commercial data from April and May for this ISD (Table 1). The inverse von Bertalanffy function was fitted to age-at-length to account for the size stratification and potential bias due to minimal mesh and landing-size regulations: a(l ) = −
L −l 1 log( ∞ ) k L∞ − L0
(4)
where L ∞ is the asymptotic length, k is the velocity to reach L ∞, and L 0 is the length-at-age 0. The corresponding ordinary von Bertalanffy growth curve, l(t) = L ∞ – (L ∞ – L0)e–kt was then used to predict the annual length increments. Annual changes in condition Δc were derived directly from population-level means (Eq. 1). Maturity ogives (Eqs. 5 & 6) were estimated by logistic regression using age and size as continuous variables. Model selection was based on the best Nagelkerke’s R2 value and log-likelihood tests between the competing candidate models in forward and backward stepwise model selection procedures. The selected models for the 2D and 3D PMRNs were: Logit[o(a,l)] ~ α0 + α1a + α2l + α 3al
(5)
Logit[o(a,l,c)] ~ α0 + α1a + α2l + α 3al + α 4c
(6)
To visualize the PMRN, LP50, defined as the size at which the probability of maturation is 50% (Heino et al. 2002), were calculated using Eqs. (2) & (3).
289
Vainikka et al.: Life-history variation in Baltic herring
To estimate the uncertainty in PMRN midpoints, the estimation procedure was repeated 1000 times by bootstrapping the original data stratified by age (using the original sample size). To study which of the factors, cohort or ISD, explained variation in the PMRN midpoints, customised ANOVA models including only the main effects cohort and area, and weighted with the inverse of the bootstrap variance in LP50 were used separately for each age. Bonferroni-type pairwise post hoc tests were used to examine pairwise differences between the ISDs. The entire PMRN analysis was performed using AV Bio-Statistics software V. 4.8 (available from A. Vainikka). ANOVA analyses were performed using SPSS 15.0.0. (SPSS). Estimated marginal means were calculated using mean values of the covariates. Eta-squared values are reported as measures of effect size. Eta-squared was calculated as the proportion of the total variance that was attributed to an effect, i.e. it was calculated as the ratio of the effect variance (SSeffect) to the total variance (SStotal). Significant level α = 0.05 was used throughout the analyses.
RESULTS Spatial variation in length-at-age Most variation in length-at-age of Clupea harengus was explained by ICES subdivision (Table 2). Interannual variation was also significant as indicated by the year effect (Table 2). Sexes did not differ in length at any age (Table 2). Pairwise Bonferroni comparisons revealed that fish in the southernmost area (ISD 25; Fig. 3) were statistically significantly larger than fish in the north (ISDs 27 to 29 at all ages, ISD 30 at age 2). Herring in ISD 28 were larger than herring in ISD 27 at ages 1, 3 and 4 yr and larger than herring in ISD 29 at all ages. Herring in ISDs 30 and 31 did not differ from each other in length-at-age. Despite the different seasonal sampling times and fishing gears (mesh sizes) of acoustic surveys and commercial catches, the main effect of data source was significant only at older ages (Table 2). At ages 3 and 4, the herring sampled in Swedish surveys were statistically significantly smaller than the herring in Swedish commercial samples (Fig. 3).
Spatial and annual variation in condition factor Condition factor varied mainly with data source, year, year × ISD, and maturity × ISD interaction (Table 3). Variation between years and data sources exceeded the variation between ISDs (Table 3, Fig. 4). There was no difference in the condition factor be-
Table 2. Clupea harengus. Factors explaining variation in the length-at-age of herring in cohorts from 1997 to 2001. Etasquared (η2) refers to the proportion of variation explained by the corresponding variable, i.e. is a measure of the effect size. Data source refers to survey, Swedish commercial, or Finnish commercial samples. The year effect equals the cohort effect. ISD: ICES subdivision; Sig.: significance F
Sig.
η2
Type III SS
df
Age 1 Intercept Data source Year ISD Sex Error
8730000 28700 1360000 12800000 14300 9550000
1 2 4 5 1 498
455 < 0.001 0.749 0.473 17.8 < 0.001 134 < 0.001 0.747 0.388
0.477 0.003 0.125 0.573 0.001
Age 2 Intercept Data source Year ISD Sex Error
39100000 81900 14700000 2500 968000 15200000
1 2 4 5 1 738
1910 < 0.001 1.99 0.137 144 < 0.001 0.122 < 0.001 11.8 0.727
0.721 0.005 0.060 0.493 0.000
Age 3 Intercept Data source Year ISD Sex Error
49000000 194000 2510000 9650000 26200 20200000
1 2 4 5 1 849
2060 < 0.001 4.08 0.017 26.3 < 0.001 81.1 < 0.001 1.10 0.294
0.708 0.010 0.110 0.323 0.001
Age 4 Intercept Data source Year ISD Sex Error
37400000 133000 1450000 7270000 26500 15000000
1 2 4 5 1 865
2160 < 0.001 3.8 0.022 20.9 < 0.001 83.9 < 0.001 1.53 0.217
0.714 0.009 0.088 0.327 0.002
tween the sexes. According to the pairwise Bonferroni tests, herring sampled from the Swedish commercial landings had a significantly higher condition factor than the herring sampled from Finnish commercial landings at ages 2 to 4. In addition, the herring sampled in surveys had a lower condition factor than those from Swedish commercial samples at ages 3 and 4 (Fig. 4). There were no consistent differences between the areas across all ages, but in the southern areas condition increased with age, whereas in the north condition decreased with age (Fig. 4b). Mature fish had a higher condition factor than immature fish at all ages, and throughout the annual cycle, except in October and November (Fig. 5). The condition factor of fish increased from April until a peak in June to July. After a decrease in August, the condition factor slowly increased until a new decrease between January and April (Fig. 5).
290
Mar Ecol Prog Ser 383: 285–294, 2009
Table 3. Clupea harengus. Factors explaining variation in the condition factor at age of herring in cohorts from 1997 to 2001. Symbols and abbreviations as in Table 2 Type III SS
Fig. 3. Clupea harengus. Estimated marginal mean length-atage in (a) different subsets of samples (based on data sources) and (b) different ICES subdivisions (ISDs). ISD 25 is the southernmost area, and ISD 31 is the northernmost area. Note that connective lines are for demonstration purposes only, and actual estimates were annual
2D and 3D PMRNs All the terms included in both the 2D and 3D ogive models were highly significant (p < 0.001). The 2D ogive model (Eq. 6) correctly predicted the maturity class in 89.3% of the cases, whereas the 3D ogive model (Eq. 7) achieved this in 89.8% of the cases. In the 3D PMRN, the overall probabilities of maturing at the observed average size and condition at ages 1 to 4 were 0.05, 0.54, 0.92, and 0.95, respectively. ANOVAs indicated that ISD significantly explained variation in the 2D PMRNs at all ages except for age 3 and that the effect of ISD was stronger than that of cohorts at ages 1 and 2 (Table 4). When the Stage 3 criterion of maturity was used, the effect of area was always statistically significant, whereas the effect of cohort was not (Table 4). At age 1, fish in the northern areas reached a maturation probability equal to the southern fish at smaller sizes (Fig. 6a). At older ages, the LP50 varied strongly between cohorts, and no consistent differences could be found between the areas except when the Stage 3 criterion was used (Fig. 6a, Table 4). The estimated 3D PMRNs confirmed the
df
F
Sig.
η2
Age 1 Intercept Data source Year ISD Maturity Year × ISD Maturity × ISD Error
49.0 0.024 0.094 0.060 0.010 0.295 0.075 3.02
1 68600 < 0.001 2 17.0 < 0.001 4 33.1 < 0.001 5 16.9 < 0.001 1 14.5 < 0.001 20 20.7 < 0.001 5 20.9 < 0.001 4226
0.942 0.008 0.030 0.020 0.003 0.089 0.024
Age 2 Intercept Data source Year ISD Maturity Year × ISD Maturity × ISD Error
64.6 0.198 0.055 0.013 0.007 0.754 0.011 6.02
1 57500 < 0.001 2 88.1 < 0.001 4 12.3 < 0.001 5 2.38 0.036 1 6.53 0.011 20 33.6 < 0.001 5 1.98 0.078 5355
0.915 0.032 0.009 0.002 0.001 0.111 0.002
Age 3 Intercept Data source Year ISD Maturity Year × ISD Maturity × ISD Error
35.6 0.652 0.363 0.089 0.012 0.624 0.012 3.42
1 56300 < 0.001 2 516.6 < 0.001 4 143.7 < 0.001 5 28.3 < 0.001 1 18.7 < 0.001 20 49.4 < 0.001 5 3.9 0.002 5415
0.912 0.160 0.096 0.025 0.003 0.154 0.004
Age 4 Intercept Data source Year ISD Maturity Year × ISD Maturity × ISD Error
20.2 0.640 0.258 0.039 0.005 0.488 0.024 3.55
1 27200 < 0.001 2 431.7 < 0.001 4 87.1 < 0.001 5 10.6 < 0.001 1 6.4 0.011 19 34.7 < 0.001 5 6.5 < 0.001 4794
0.850 0.153 0.068 0.011 0.001 0.121 0.007
results obtained using 2D PMRNs: ISD explained more of the variation than cohort at ages 1 and 3 (Table 4, Fig. 6b). Analogically to 2D PMRNs, the Stage 3 criterion increased the LP50-values of southern ISDs at constant condition in comparison to the results based on the Stage 2 criterion (Fig. 6).
DISCUSSION Given that PMRNs can exclude the major environmental influences on maturation (Dieckmann & Heino 2007), the present study, by reporting higher LP50-values for southern than for northern herring Clupea harengus supports the hypothesis of latitudinal CGV in
291
Vainikka et al.: Life-history variation in Baltic herring
Fig. 5. Clupea harengus. Within-year changes in the condition of mature and immature herring in pooled samples of herring of ages 1 to 4 from ICES subdivisions 25 to 31. A fully saturated ANOVA model was used to predict the monthly marginal means. In June and July, only 3 immature individuals were collected, and therefore the values are not shown
play a minor role in the maturation patterns of herring (see also Morgan & Lilly 2006). In conclusion, the differences in PMRNs and phenotypic growth rates of herring between the northern and southern Baltic Sea reject our null hypothesis, and support our Hypothesis 2 of counter-gradient variation in maturation reaction norms (see Fig. 1). However, since the observed pheno-
Fig. 4. Clupea harengus. Estimated marginal mean condition factor at age in (a) different subsets of samples and (b) different ICES subdivisions (ISDs). In southern ISDs, condition increases with age, whereas it decreases with age in northern ISDs. According to pairwise Bonferroni comparisons, the following ISDs had statistically different mean condition factors: ISD 25 < ISDs 29 and 30, ISD 27 ≠ ISDs 29 and 30 and ISD 30 > all except for ISD 29 at age 1. At age 2, no significant pairwise differences were found. At age 3, ISD 25 > all other ISDs except for ISD 28, ISD 27 ≠ ISDs 29 to 31, ISD 28 ≠ ISDs 29 to 31 and ISD 31 < all other ISDs except for ISD 30. At age 4, ISD 25 > all ISDs except for ISDs 27 and 31, ISD 30 < ISD 27 and ISD 27 > ISD 28. Note that connective lines are for demonstration purposes only, and actual estimates were annual
the maturation schedules. A similar pattern has been found for instance in Atlantic cod, where LP50 correlated negatively with latitude (Olsen et al. 2005). However, older herring in the northern Baltic Sea needed to reach a comparable or even larger size in order to mature, as indicated by the more negatively sloped PMRNs of the southern herring. The patterns observed in age- and length-based PMRNs also remained when condition was included in the analyses, and the inclusion of condition only marginally improved the fit of the ogive models. Therefore, condition is concluded to
Table 4. Clupea harengus. Factors contributing to the variation in the age-specific LP50s of the 2D and 3D PMRNs of herring at ages 1 to 4 and cohorts from 1997 to 2001. In the ANOVA, the least squares were weighted by the inverse of the bootstrapped variance of LP50s. Sig. II: significance levels when the Stage 3 criterion (more conservative maturity staging) was used; other symbols and abbreviations as in Table 2 Age
df
F
Sig.
Sig. II
η2
2D PMRNs ISD Cohort ISD Cohort ISD Cohort ISD Cohort
1 1 2 2 3 3 4 4
5, 20 23.52 4, 20 5.64 5, 20 6.46 4, 20 5.98 5, 20 2.60 4, 20 27.40 5, 20 4.42 4, 20 34.25
< 0.001 0.003 0.001 0.002 0.057 0.000 0.007 < 0.001
< 0.001 0.533 < 0.001 < 0.001 < 0.001 0.918 < 0.001 0.827
0.85 0.53 0.62 0.54 0.39 0.85 0.53 0.87
3D PMRNs ISD Cohort ISD Cohort ISD Cohort ISD Cohort
1 1 2 2 3 3 4 4
5, 19 23.67 4, 19 10.32 5, 19 3.76 4, 19 7.15 5, 19 8.65 4, 19 6.56 5, 19 2.11 4, 19 5.12
< 0.001 0.043 0.016 0.001 0.000 0.002 0.109 0.006
< 0.001 0.448 < 0.001 < 0.001 0.001 0.070 0.043 < 0.001
0.74 0.44 0.50 0.60 0.69 0.58 0.36 0.52
292
Mar Ecol Prog Ser 383: 285–294, 2009
Fig. 6. Clupea harengus. Estimated marginal mean length at 50% probability of maturing (LP50) for ICES subdivisions (ISD) 25 to 31 using 2 different criteria for maturity staging. In (a) 2D PMRNs and (b) 3D PMRNs, Stage 2 fish were considered mature fish; in (c) 2D PMRNs and (d) 3D PMRNs, Stage 2 fish were considered immature. Note that connective lines are for demonstration purposes only, and actual estimates were annual. For clarity, the observed growth curves were not plotted. The areas (subdivisions) that did not differ statistically (pairwise Bonferroni comparisons) from each other in their 2D PMRN in (a) were at age 1, in ISDs 25 and 27; 27, 28, 29 and 30; and 28, 30 and 31; and at age 2 in all except for ISDs 25 and 28. At ages 3 and 4, the ISDs did not differ from each other. The areas that did not differ statistically in their 3D PMRN in (b) were at age 1, in ISDs 25 and 27; 27 and 29; and 28, 29, 30 and 31, and at age 3, in ISDs 25, 27 and 29; and 28, 29, 30 and 31. At ages 2 and 4, no significant pairwise differences were found. The Stage 3 criterion led to significant differences among almost all pairwise differences, and those are not specified here
typic differences in growth rates might also be affected by genetic differences, we cannot rule out Hypothesis 3 (see Fig. 1). In contrast to the rather clear pattern of fast growth in the south and slow growth in the north, the condition factor (based on total weight) did not show a clear spatial pattern. This might confirm the result of previous studies (e.g. Casini et al. 2006), suggesting that density dependence, rather than abiotic factors, is the main factor influencing condition in Baltic herring. Interestingly, herring from Swedish commercial landings sampled in winter had a significantly higher condition factor (were fatter at a certain length) than those sampled in fishery-independent surveys in autumn. This difference in condition factor is not likely to result from the time difference between the surveys and commercial samples, since the condition factor was observed to decrease from autumn to spring in the commercial samples. Instead, it suggests that fishing gear (mostly trawls and gillnets) based on mesh size
may more easily capture herring that have a high condition factor, i.e. have higher diameter at a certain length than individuals in poorer condition. Alternatively, fishermen may make active choices to fish herring that are in better condition than randomly sampled herring in the open sea. This issue clearly deserves further empirical study. The condition factor may remove additional environmental variability from the PMRNs (Grift et al. 2007). However, in the present study the predictive power of the ogive model (Eq. 6) only increased marginally after its inclusion. Nor is it clear whether the condition factor measured prior to spawning, i.e. after the ‘maturation decision’, reflects conditions that affect maturation probability (Wright 2007). Mature fish could be in good condition due to effects of the maturation process itself, i.e. the storage of energy that would later be allocated to reproduction, including gonadic development (Grift et al. 2007). We found that the condition factor was higher in mature herring throughout the year, except
Vainikka et al.: Life-history variation in Baltic herring
during the time of sampling in autumn. Therefore, good condition might be a consequence and not the cause of the ‘maturation decision’. Nevertheless, this would not have had implications in our study since there were no consistent differences in condition between the areas, and the short-term variability in the condition factor did not explain differences in the 2D PMRNs. We conclude that inclusion of the condition factor in the analysis of PMRNs may not increase their precision or improve their interpretation. Statistical analyses of biological data with spatial resolution are difficult because the area effect is coupled, and thus statistically collinear, with various environmental factors. Environmental variables that covary with the area effect within the Baltic Sea include temperature (Dhillon & Fox 2004), abundance of predators, of competitors (Casini et al. 2004, 2006, Rönkkönen et al. 2004) and of prey (Horbowy 1997), salinity (Bekkevold et al. 2005) and the amount of light. All these factors likely affect growth rate and the condition of herring, therefore, they controlled for in the estimation of PMRNs to the extent that their direct effect on maturation is negligible (cf. Dhillon & Fox 2004). However, all of these environmental variables also create selective pressures and could consequently lead to evolutionary divergence in life histories (Arendt & Wilson 1997). Therefore, it remains unclear to what extent the observed geographic differences in PMRNs are of genetic and uncontrolled environmental origin. In addition, area-specific spawning times could confound the analyses by affecting the length of the growing season, but, in recent years, most herring have spawned in spring to summer, and autumn spawners have been rare (Parmanne et al. 1994, Rajasilta et al. 2001). The skipped spawning recorded in the Norwegian springspawning herring (Engelhard & Heino 2006) has not been documented for the Baltic herring, but when occurring in different proportions among areas, it could bias the area-specific PMRNs by falsely increasing the proportions of (misclassified) immature herring. Our results support the hypotheses of CGV in maturation schedules, and genetic differentiation between herring subpopulations within the Baltic Sea. Given that maturation patterns have a genetic basis, they have more important management implications than fully environmentally driven patterns (Conover et al. 2006). The more horizontal form of the PMRN in the northern areas suggests that northern herring are more dependent on reaching the maturation size than their southern counterparts, which mature at an early age. Therefore, any mechanism improving the likely density-dependent growth rate of herring (Horbowy 1997, Casini et al. 2006) might improve recruitment more easily in the north than in the south. However, since most herring mature at a very early age, these
293
differences have limited importance for practical management of Baltic Sea herring fisheries. For species with greater variation in age and size of maturation, however, CGV in maturation schedules may cause divergent population responses to fisheries management actions that affect individual growth. Acknowledgements. This research was supported by the European Marie Curie Research Training Network FishACE (Fisheries-Induced Adaptive Changes in Exploited Stocks), funded through the European Community’s Sixth Framework Programme (Contract MRTN-CT-2004-005578). We thank J. Pönni for providing the Finnish commercial data for the analyses. For helpful discussions during preparation of the manuscript, we thank especially J. Modin, and H. Pardoe is gratefully acknowledged for comments that helped to improve the manuscript. LITERATURE CITED
➤ Arendt JD (1997) Adaptive intrinsic growth rates: an integra➤
➤ ➤ ➤
➤
➤
➤ ➤
tion across taxa. Q Rev Biol 72:149–177 Arendt JD, Wilson DS (1997) Optimistic growth: competition and an ontogenetic niche shift select for rapid growth in pumpkinseed sunfish (Lepomis gibbosus). Evolution 51: 1946–1954 Arendt JD, Wilson DS (1999) Countergradient selection for rapid growth in pumpkinseed sunfish: disentangling ecological and evolutionary effects. Ecology 80:2793–2798 Aro E (1989) A review of migration patterns in the Baltic. Rapp P-V Réun Cons Int Explor Mer 190:72–96 Barot S, Heino M, O’Brien L, Dieckmann U (2004a) Estimating reaction norms for age and size at maturation when age at first reproduction is unknown. Evol Ecol Res 6: 659–678 Barot S, Heino M, O’Brien L, Dieckmann U (2004b) Longterm trend in the maturation reaction norm of two cod stocks. Ecol Appl 14:1257–1271 Bekkevold D, André C, Dahlgren TG, Clausen LAW and others (2005) Environmental correlates of population differentiation in Atlantic herring. Evolution 59:2656–2668 Belk MC, Johnson JB, Wilson KW, Smith ME, Houston DD (2005) Variation in intrinsic individual growth rate among populations of leatherside chub (Snyderichticus copei Jordan & Gilbert): Adaptation to temperature or length of growing season? Ecol Freshw Fish 14:177–184 Casini M, Cardinale M, Arrhenius F (2004) Feeding preferences of herring (Clupea harengus) and sprat (Sprattus sprattus) in the southern Baltic Sea. ICES J Mar Sci 61: 1267–1277 Casini M, Cardinale M, Hjelm J (2006) Inter-annual variation in herring, Clupea harengus, and sprat, Sprattus sprattus, condition in the central Baltic Sea: What gives the tune? Oikos 112:638–650 Conover DO, Present TMC (1990) Countergradient variation in growth rate compensation for length of the growing season among Atlantic silversides from different latitudes. Oecologia 83:316–324 Conover DO, Schultz ET (1995) Phenotypic similarity and the evolutionary significance of countergradient variation. Trends Ecol Evol 10:248–252 Conover DO, Clarke LM, Munch SB, Wagner GN (2006) Spatial and temporal divergence in marine fishes conservation. J Fish Biol 69:21–47
294
➤ Dhillon ➤ ➤ ➤
➤ ➤
➤
➤ ➤
➤ ➤
➤
➤
Mar Ecol Prog Ser 383: 285–294, 2009
RS, Fox MG (2004) Growth-independent effects of temperature on age and size at maturity in Japanese medaka (Oryzias latipes). Copeia 2004:37–45 Dieckmann U, Heino M (2007) Probabilistic maturation reaction norms: their history, strengths, and limitations. Mar Ecol Prog Ser 335:253–269 Engelhard GH, Heino M (2006) Climate change and condition of herring (Clupea harengus) explain long-term trends in extent of skipped reproduction. Oecologia 149:593–603 Ernande B, Dieckmann U, Heino M (2004) Adaptive changes in harvested populations: plasticity and evolution of age and size at maturation. Proc R Soc Lond B Biol Sci 271: 415–423 Grift RE, Heino M, Rijnsdorp AD, Kraak SBM, Dieckmann U (2007) Three-dimensional maturation reaction norms for North Sea plaice. Mar Ecol Prog Ser 334:213–224 Heino M, Dieckmann U, Godø OR (2002) Measuring probabilistic reaction norms for age and size at maturation. Evolution 56:669–678 Horbowy J (1997) Growth of the Baltic herring as a function of stock density and food resources. Acta Ichthyol Piscatoria 27:27–39 Hutchings JA, Swain DP, Rowe S, Eddington JD, Puvanendran V, Brown JA (2007) Genetic variation in life-history reaction norms in a marine fish. Proc R Soc Lond B Biol Sci 274:1693–1699 ICES (International Council for Exploration of the Sea) (1962) Report of Working Group on methods used in North Sea herring investigations. ICES Herring Committee, CM 12, Hamburg Johannesson K, André C (2006) Life on the margin: genetic isolation and diversity loss in a peripheral marine ecosystem, the Baltic Sea. Mol Ecol 15:2013–2029 Jørgensen HBH, Hansen MM, Bekkevold D, Ruzzante DE, Loeschcke V (2005a) Marine landscapes and population genetic structure of herring (Clupea harengus L.) in the Baltic Sea. Mol Ecol 14:3219–3234 Jørgensen HBH, Hansen MM, Loeschcke V (2005b) Springspawning herring (Clupea harengus L.) in the southwestern Baltic Sea: Do they form genetically distinct spawning waves? ICES J Mar Sci 62:1065–1075 Kraak SBM (2007) Does the probabilistic maturation reaction norm approach disentangle phenotypic plasticity from genetic change? Mar Ecol Prog Ser 335:295–300 Larsson LC, Laikre L, Palm S, Andre C, Carvalho GR, Ryman N (2007) Concordance of allozyme and microsatellite differentiation in a marine fish, but evidence of selection at a microsatellite locus. Mol Ecol 16:1135–1147 Levins R (1969) Thermal acclimation and heat resistance in Drosophila species. Am Midl Nat 103:483–499 Marshall CT, McAdam BJ (2007) Integrated perspectives on genetic and environmental effects on maturation can reduce potential errors of inference. Mar Ecol Prog Ser 335:301–310 McQuinn IH (1997) Metapopulations and the Atlantic herring. Rev Fish Biol Fish 7:297–329
Editorial responsibility: Romuald Lipcius, Gloucester Point, Virginia, USA
➤ Morgan MJ, Bowering WR (1997) Temporal and geographical
➤ ➤
➤
➤
➤
➤
➤ ➤ ➤ ➤
➤
variation in maturity at length and age of Greenland halibut (Reinhardtius hippoglossoides). ICES J Mar Sci 54: 875–885 Morgan MJ, Lilly GR (2006) The impact of condition on reproduction in Flemish cap cod. J Northwest Atl Fish Sci 37: 81–86 Olsen EM, Lilly GR, Heino M, Morgan MJ, Brattey J, Dieckmann U (2005) Assessing changes in age and size at maturation in collapsing populations of Atlantic cod (Gadus morhua). Can J Fish Aquat Sci 62:811–823 Parmanne R, Rechlin O, Sjöstrand B (1994) Status and future of herring and sprat stock in the Baltic Sea. Dana 10:29–59 Rajasilta M, Laine P, Hänninen J (2001) Ovarian weight of the Baltic herring (Clupea harengus membras) in relation to spawning time in the Archipelago Sea, northern Baltic. ICES J Mar Sci 58:106–113 Rajasilta M, Eklund J, Laine P, Jönsson N, Lorentz T (2006) Intensive monitoring of spawning population of the Baltic herring (Clupea harengus membras L.). SEILI Archipelago Research Institute Publications 3, Turku Reznick DN (1993) Norms of reaction in fishes. In: Stokes TK, McGlade JM, Law R (eds) The exploitation of evolving resources. Springer-Verlag, Berlin Roff DA (1992) The evolution of life histories: theory and analysis. Chapman & Hall, New York Rönkkönen S, Ojaveer E, Raid T, Viitasalo M (2004) Longterm changes in Baltic herring (Clupea harengus membras) growth in the Gulf of Finland. Can J Fish Aquat Sci 61:219–229 Rosenberg R, Palmén LE (1981) Composition of herring stocks in the Skagerrak-Kattegat and the relations of these stocks with those of the North Sea and adjacent areas. Fish Res 1: 83–104 Ruzzante DE, Mariani S, Bekkevold D, Andre C and others (2006) Biocomplexity in a highly migratory pelagic marine fish, Atlantic herring. Proc R Soc Lond B Biol Sci 273: 1459–1464 Stearns SC (1992) The evolution of life histories. Oxford University Press, Oxford Von Bertalanffy L, Pirozynski WJ (1953) Tissue respiration, growth, and basal metabolism. Biol Bull (Woods Hole) 105: 240–256 West GB, Brown JH, Enquist BJ (2001) A general model for ontogenetic growth. Nature 413:628–631 Wright PJ (2007) Understanding the maturation process for field investigations of fisheries-induced evolution. Mar Ecol Prog Ser 335:279–283 Yamahira K, Kawajiri M, Takeshi K, Irie T (2007) Inter- and intrapopulation variation in thermal reaction norms for growth rate: evolution of latitudinal compensation in ectotherms with a genetic constraint. Evolution 61:1577–1589 Yoneda M, Kurita Y, Kitagawa D, Ito M (2007) Spatial variation in the relationship between growth and maturation rate in male Japanese flounder Paralichthys olivaceus off the Pacific coast of northern Japan. J Sea Res 57:171–179
Submitted: February 28, 2008; Accepted: February 12, 2009 Proofs received from author(s): April 17, 2009