This article was downloaded by: [Technical University of Crete] On: 05 September 2014, At: 08:32 Publisher: Routledge Informa Ltd Registered in England and Wales Registered Number: 1072954 Registered office: Mortimer House, 37-41 Mortimer Street, London W1T 3JH, UK
International Journal of Water Resources Development Publication details, including instructions for authors and subscription information: http://www.tandfonline.com/loi/cijw20
Spatial Water Use efficiency Index towards resource sustainability: application in the island of Crete, Greece a
b
c
O. Tzoraki , M. Kritsotakis & E. Baltas a
School of Environment, Marine Sciences Department, University of the Aegean, Mytilini, Greece b
Directorate of Water, Decentralized Administration of Crete, Iraklion, Greece c
School of Civil Engineering, National Technical University of Athens, Zografou, Greece Published online: 03 Sep 2014.
To cite this article: O. Tzoraki, M. Kritsotakis & E. Baltas (2014): Spatial Water Use efficiency Index towards resource sustainability: application in the island of Crete, Greece, International Journal of Water Resources Development, DOI: 10.1080/07900627.2014.949637 To link to this article: http://dx.doi.org/10.1080/07900627.2014.949637
PLEASE SCROLL DOWN FOR ARTICLE Taylor & Francis makes every effort to ensure the accuracy of all the information (the “Content”) contained in the publications on our platform. However, Taylor & Francis, our agents, and our licensors make no representations or warranties whatsoever as to the accuracy, completeness, or suitability for any purpose of the Content. Any opinions and views expressed in this publication are the opinions and views of the authors, and are not the views of or endorsed by Taylor & Francis. The accuracy of the Content should not be relied upon and should be independently verified with primary sources of information. Taylor and Francis shall not be liable for any losses, actions, claims, proceedings, demands, costs, expenses, damages, and other liabilities whatsoever or howsoever caused arising directly or indirectly in connection with, in relation to or arising out of the use of the Content. This article may be used for research, teaching, and private study purposes. Any substantial or systematic reproduction, redistribution, reselling, loan, sub-licensing,
Downloaded by [Technical University of Crete] at 08:32 05 September 2014
systematic supply, or distribution in any form to anyone is expressly forbidden. Terms & Conditions of access and use can be found at http://www.tandfonline.com/page/termsand-conditions
International Journal of Water Resources Development, 2014 http://dx.doi.org/10.1080/07900627.2014.949637
Spatial Water Use efficiency Index towards resource sustainability: application in the island of Crete, Greece O. Tzorakia, M. Kritsotakisb and E. Baltasc* a
School of Environment, Marine Sciences Department, University of the Aegean, Mytilini, Greece; Directorate of Water, Decentralized Administration of Crete, Iraklion, Greece; cSchool of Civil Engineering, National Technical University of Athens, Zografou, Greece
Downloaded by [Technical University of Crete] at 08:32 05 September 2014
b
(Received 9 May 2014; accepted 21 July 2014) This paper introduces a new index to test water resource sustainability in regions where groundwater is the main source of water supply. The Spatial Water Use efficiency Index (SWUI) is a geographical information system (GIS) environment index which expresses the ratio of potential available water volume (groundwater recharge minus water needs) to the respective water needs. Its low and/or negative values indicate water stress. SWUI is applied in the island of Crete, Greece, where water needs are mainly covered by groundwater abstractions. The annual water mass balance is estimated using the RIBASIM (River Basin Simulation) model. The total freshwater needs in the Cretan region reach 535 hm3 annually according to the model’s simulation. SWUI with values ranging from 2 0.8 to 214.3 has proved to be an important visual tool towards depicting the low efficiency of the east part of the island to cover water demand and a useful decision-making tool in the sustainability evaluation of groundwater aquifers. Keywords: water; sustainability; efficiency index; water use; Greece
Introduction A consistent increase in both surface water and groundwater use with a more rapid increase in the latter use since the 1990s is observed worldwide due to population growth, improvement in living standards and economic development (Wada, Wisser, & Bierkens, 2014). Groundwater is the main water resource for agricultural ecosystems, industry and the drinking water supply for an estimated population of 2 billion people globally (Gleeson & Wada, 2013). In the Mediterranean region the fact that the majority of rainfall events occur during the autumn and winter months, while water needs peak during the summer, creates a discrepancy between water supply and demand. The small drainage area in many islands and coastal areas in combination with high slopes and restricted rainfall volumes result in rivers’ and wetlands’ desiccation during the summer. Usual practices for the confrontation of water shortages, include dam construction, river abstraction and overexploitation of groundwater (Krol, de Vries, van Oel, & de Arau´jo, 2011, Tzoraki, Do¨rflinger, Dimitriou, & Polykarpou, 2012) alter the seasonal and inter-annual variability of terrestrial water storage. According to the definition given by Foster and Loucks (2006, p. 14), aquifer overexploitation is a ‘prolonged (multi annual) withdrawal of groundwater from an aquifer in quantities exceeding its average annual replenishment, bringing about a persistent fall in groundwater levels and reduction of aquifers reserves with undesirable side-effects’. Even in regions considered as water abundant regions, the scarcity in the dry
*Corresponding author. Email:
[email protected] q 2014 Taylor & Francis
Downloaded by [Technical University of Crete] at 08:32 05 September 2014
2
O. Tzoraki et al.
season is expected to be a serious problem in the upcoming decades and climate change scenarios forecast an increasing dependency on groundwater resources for water supply in future (Gain & Wada, 2014). The threat of seawater intrusion prohibits the use of existing coastal aquifers. Taking into account the limited water resources and increasing water demands, a serious task for the next few years will be the achievement of a water supply – demand balance. Water resource allocation in these coastal areas is posing great challenges to decision-makers and water managers who are aiming to maintain both economic development and environmental protection by avoiding aquifer overexploitation. According to the recommendations of European Commission for Environment, to achieve the goals of the Europe 2020 Strategy, ‘New policies should be inspired to measure environmental footprints and resource use; to measure whether more wealth is being generated domestically with fewer resources’ (Potocˇnik, 2013). Regarding the use of water resources, plenty of methodologies have been developed to quantify the water footprint, like the product’s Virtual Water, which includes the green water of rain transpired by plants, the blue water added as irrigation and the grey water contaminated by agrichemicals (Papatheodoulou et al., 2013; Su, Lu, & Hong, 2013). Also Life Cycle Analysis (LCA) is a widely known approach that assesses the environmental risk associated with a product, process or service. A basic step in this technique is Inventory Analysis which includes the identification and quantification of energy, water and material usage, and environmental releases (e.g. air emissions, solid waste disposal, waste water discharges). In Inventory Analysis, process water usage and eutrophication converted to resource equivalents or phosphate are important indicators of environmental impact. Most methodologies, including LCA, although incorporating viable tools of water sustainability, completely ignore the spatial and temporal scale of water availability at regional and local scales. The concept of safe yield has been used in several studies to establish the rate at which groundwater can be withdrawn from an aquifer without causing undesirable adverse effects (Voudouris, 2006), attempting to maintain a long-term balance between abstraction and recharge. In another study, aquifer intrinsic vulnerability was classified in seven zones indicating the specific susceptibility of the aquifer systems related to the different components, geometric and hydrodynamic situations (Parisi, Pascale, Sdao, & Soupios, 2013). Gleeson & Wada (2013) suggested, as an index of aquifer stress, the so-called groundwater footprint index, which is defined as the area required to sustain groundwater use and groundwater-dependent ecosystem services for the aquifer. An indicator for transboundary aquifers was introduced (Wada & Heinrich, 2013) to express aquifer stress based on aquifer abstraction and depletion volumes, even though a simplified approach was followed to estimate additional recharge or the base-flow component. In complex hydrogeological environments such as Crete, Greece, surface water bodies are regulated by seasonal rainfall pattern, streams experience temporary flow and water needs are covered mainly by groundwater sources. During the last few decades several hydraulic projects (dense irrigation networks, small reservoirs and water allocation systems) have altered drastically the natural regime of rivers and aquifers in the island. A conflict between users’ demand and the protection of the existing water resources in the island is taking place. The development of new indexes is crucial in the direction of better management and optimal decision-making. The main objective of this work is the estimation of the balance of water resources of the island, including groundwater resources as well as the application of a new Spatial Water Use efficiency Index (SWUI) based on specific local hydrogeological conditions and taking into account the hydrological extremes. The new index could be incorporated in LCA analysis of products, processes or services and be related to the environmental impact of them regarding water efficiency.
Downloaded by [Technical University of Crete] at 08:32 05 September 2014
International Journal of Water Resources Development
3
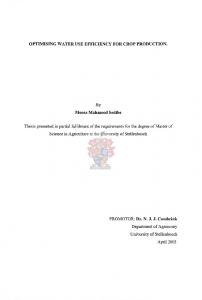
Water allocation models are often comprised by a network of nodes and links, where links represent rivers and nodes various types of water usage such as public water supply and irrigation, or water infrastructure projects such as reservoirs. Water allocation models have been used widely to analyse the impacts of various scenarios for water demand at a river basin scale. A typical water allocation model is RIBASIM (River Basin Simulation) (Krogt, 2008a, 2008b) which has been used in various studies during the last few years (Safaei, Safavi, Loucks, Ahmadi, & van der Krogt, 2013). Equations used by the RIBASIM model are given in detail by Krogt (2008a, 2008b). The RIBASIM model has been applied to the entire island of Crete at a scale of the municipality (569 nodes of existing municipalities) in order to estimate water needs and water deficit. The wider goal was the prediction of potential water allocation, the planning of new water infrastructures and the demand management in different hydrological conditions, namely a normal, a dry and a very dry hydrological year. The results of the above-mentioned RIBASIM model runs were utilized for the derivation of the SWUI. Site description General The island of Crete is located in the southern part of Greece with an area of 8265 km2 and administratively is divided into four prefectures: Lassithi (1810 km2), Heraklion (2626 km2), Rethymno (1487 km2) and Chania (2342 km2). The economy is based on the primary sector, tourism and services. The permanent population of the island is 601,131 (Greek statistical Service, 2011). Agricultural areas cover 37.9% of the island (3134 km2). Permanent trees (mostly olives and orange trees) occupy 1901 km2, arable land 300 km2, vegetables and other horticultural crops 86 km2, grapes and raisins 255 km2, and fallow land 592 km2. The Livestock population in the island was counted in 2006 and found to be (in thousands of heads): 2 cattle, 65 pigs, 1343 sheep and 635 goats, 6 equidae, 1027 poultry, 544 rabbits and 158 beehives. Climate The climate in Crete is typical Mediterranean with cool winters and hot summers. Mean annual temperature ranges from 18.58C in the west side to 208C in the south part of the island. A high variation in precipitation patterns is observed. Mean precipitation ranges from 327 mm in coastal areas to 2161 mm in the headwaters of White Mountains, as shown in Figure 1. The highest precipitation fraction is observed in the mountain massif and much less in the north coast of Chania prefecture and south part of Heraklion. During the last few decades a slight decrease trend in annual precipitation has been observed, with the highest reduction in higher elevations (Naoum & Tsanis, 2003). It should be noted that no significant decrease trend of precipitation was observed compared with the island of Cyprus. The combination of the Cretan mountainous relief, complex geology, long coastline and remoteness of some biotopes has led to great diversity and the existence of many endemic and rare animal and plant species. The national Woodland of Samaria (4850 ha) has been categorized as a Biosphere Reserve according to UNESCO. Also, 37 biotopes were recorded in the survey of Greek Biotope/Wetland Centre (1994 survey) and additionally three sea lakes and plenty of sites in Crete have been included in the NATURA 2000 network. The climate stations monitoring system that operates in Crete includes 71 precipitation stations (available data since 1960), 53 meteorological stations, 84 flow gauge stations (53
Downloaded by [Technical University of Crete] at 08:32 05 September 2014
4
O. Tzoraki et al.
Figure 1. The island of Crete and mean annual precipitation.
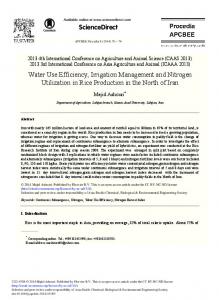
to monitor springs and 31 river flow on a monthly basis) and 120 ground water stations since 1980. Geology Four mountain ranges run from west to east: the White Mountains in the west (2453 m), Idis Mountain (2456 m) in the centre, Asterousia (1280 m) in south Heraklion and Dikti (2148) in the east. The geology of Crete can be described in terms of a pile of four preNeogene major nappes and one autochthonous isopic zone with a cumulative thickness of 6.5 km. The nappes were transported from the north along the east – west trending thrusts and were emplaced between Late Eocene and Early Miocene times. Shortly after nappe emplacement during the Middle Miocene (13 my) a north – south extensional regime was established in the region due to the initiation of subduction in the Hellenic trench. The extensional tectonics have resulted in the development of numerous east – west grabens with offsets of up to 5 km. This period is associated with the deposition within the grabens of Miocene to Quaternary sediments, which consist mainly of red beds, sandstones, marls, limestones and evaporites. It is the nappe emplacement and post-emplacement tectonic and depositional history of the island that formulated its present day hydrogeologic structure. The Neogene – Quaternary sediment-filled grabens host shallow aquifers whereas the carbonates of the pre-Neogene nappes host the deep Karstic aquifers (Figure 2). Furthermore, the major fault systems play an important role in the ground water flow regime and spring discharge by imbedding or facilitating flow, depending on their relative structural positions. It is estimated that approximately 20% of the ground water resources of the island (totalling approximately 2.2 billion m3) are associated with the Neogene – Quaternary aquifers, whereas the remaining 80% represent the groundwater potential of their deep Karstic counterparts. Hydrogeologic settings Crete is a typical Mediterranean island with uneven seasonal precipitation distribution and high inter-annual precipitation variation. The precipitation of a dry year is almost the half than a wet year and 37% less than the average. Most important from a hydrogeological
Downloaded by [Technical University of Crete] at 08:32 05 September 2014
International Journal of Water Resources Development
5
Figure 2. Spatial distribution of Neogene – Quaternary sediment-filled grabens hosting shallow mainly alluvial aquifers (purple) and pre-Neogene formations hosting deep Karstic aquifers (blue).
point of view are the three major Karstic units of White Mountains, Idis, Dikti-Selenas and the smaller unit of Ornou-Sitias karstic formations. The groundwater of these mountains supplies numerous springs, but the majority are located on the coast and are physically contaminated by seawater, resulting in brackish water. Karstic aquifers occupy an area of 2730 km2 (33% of the total area of the island) and are characterized by low runoff and high infiltration capacity. They operate as a high storage capacity reservoir (80% of total storage capacity) with small freshening times. For instance, Malia karstic aquifer has a freshening time of 15 years, whereas Neogene formation in Gouves (Heraklion prefecture) has a freshening time of 10,000 years under natural recharge conditions (Lambrakis & Kallergis, 2001). It is estimated that 40– 55% of the mean annual precipitation infiltrates to the ground in these formations, creating a renewable annual groundwater potential of approximately 1.75 billion m3. The majority of karstic springs’ discharge (80%) is disposed along the coast, thus is mixed with seawater. The Neogene and Quaternary sediment filled grabens occupy an area of 2597 km2 (31% of the total area of the island), including the major plains of the island, and are commonly characterized by a rich network of streams due to the presence of surficial marly deposits and shallow aquifers hosted by Quaternary alluvial and/or older sandstone –conglomeratic deposits with a renewable annual groundwater potential of approximately 0.37 billion m3. These plains are the foci of intense agricultural activity with cultivation of olives, grapes, fruits and vegetables. The alluvial aquifers, which were among the most productive on the island, have undergone severe overexploitation. The remaining 36% of the island is comprised by aquitards of ‘impermeable’ geological formations such as phyllites, flysch, etc. characterized by a rich network of streams. It should be noted that there are no perennial streams on Crete and the total mean annual runoff is estimated to be in the magnitude of 0.08 billion m3. Table 1 shows the main aquifer types, area, mean annual precipitation and mean annual recharge in the island of Crete (IGME, 2009). Methodology RIBASIM model RIBASIM is a generic model package for simulating the response of river basins under various hydrological conditions and scenarios. It particularly deals with the hydrological
6
O. Tzoraki et al.
Table 1. Main aquifer types in the island of Crete and mean annual recharge.
Aquifer type Karstic Alluvial/Neogene Impermeable Total
Area (106 m2)
Mean aerial annual precipitation (mm)
Mean annual precipitation (hm3)
Mean annual aquifers recharge (hm3)
2730 2597 2938 8265
1300 693 801 934
3549 1800 2351 7700
1750 370 80 2200
Downloaded by [Technical University of Crete] at 08:32 05 September 2014
Source: IGME (2009).
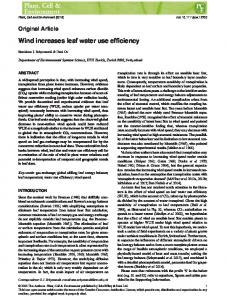
simulation of the river basins and also links the hydrological water inputs at various locations with specific water users in the supply system. The analysis of water demand is extensive (i.e., based on demographic, financial, crop water requirement aspects). Also current and future demands at different horizons can be compared and matters relative to crop production and crop damage caused by climate drought can be assessed. RIBASIM allows the user to define operating/planning scenarios where each scenario is characterized by a particular operating rule and/or water supply projection (Sulis & Sechi, 2013). The RIBASIM model uses allocation rules based on a hierarchical order of demand priorities. It has been used to incorporate environmental flow requirements in water resources planning (Meijer, Krogt, & Beek, 2012) and by setting sustainability criteria helped in the direction of integrated water resources management under climate change impact in the Zayandehrud river basin, Iran (Safaei et al., 2013). The RIBASIM model was applied to calculate the water needs of 569 municipalities which were represented by a node in the model. The model also schematized the river network, surface water, groundwater and water users, especially focusing on the irrigation management in the Messara Valley and the irrigation network managed by Eastern and Western Crete Development Organizations and several local Land Reclamation Services. The agricultural use in each municipality was extracted by statistical data (National Statistical Service of Greece). Agricultural demand was set (in m3 per hectare) for grapes at 3000, olive trees 2500, vegetables 5000, greenhouse/vegetables 6500, hypotropical plants 6000 and fodder plants 7000. In a second phase, based on the model simulation and calibration of the year 2007, a scenario was adopted taking into account existing problems in basin management and the categorization of priorities among various stakeholders. The increase in surface water storage due to planned construction and operation of three new reservoirs was also taken into account. The RIBASIM model schematization is shown in Figure 3. Four main groups of elements were inserted into the model: (1) infrastructure: surface and ground reservoir, rivers, canals, pumping stations and pipelines; (2) water use: public water supply, agriculture, hydropower, etc.; (3) management of the water resources system: reservoir operation rules, allocation methods; and (4) hydrology: river flow, runoff, precipitation, evaporation and geohydrology. Spatial Water Use efficiency Index (SWUI) SWUI (dimensionless) is defined as (R – N)/N, i.e. the difference between annual groundwater recharge volume (R) and annual needs volume (N) divided by water needs volume. SWUI has a physical meaning, expressing the ratio of potential groundwater availability in an annual basis for each municipality. The water needs for each municipality were supported by RIBASIM simulation results. Groundwater recharge is inserted in the SWUI as the amount of precipitation that is infiltrated and reaches the
Downloaded by [Technical University of Crete] at 08:32 05 September 2014
International Journal of Water Resources Development
7
Figure 3. Spatial discretization of RIBASIM model performance in Crete.
aquifer each year. It is estimated by multiplying the rainfall amount with the specific infiltration ratio of each aquifer defined by pertinent field studies (IGME, 2009). Hydrological balance results Water resources balance Precipitation indicates spatial and temporal variation. It decreases from west to east and from north to south, while it increases upwards with an estimated lapse rate of 61 mm/100 m in altitude. Based on RIBASIM runs, a mean annual precipitation of 934 mm corresponds to a water volume of 7700 hm3. Due to high temperatures it is estimated that almost 60% (4620 hm3) of the precipitation is subject to actual evapotranspiration. The potential evapotranspiration is estimated to be up to 1500 mm using the Penman – Monteith method. Due to the extensive occurrence of carbonate rocks, 33% (2235 hm3) of precipitation is infiltrated, recharging the aquifers (Koutroulis, Tsanis, Daliakopoulos, & Jacob, 2013). A portion of the infiltrated groundwater emerges as spring water, which is estimated around 593 hm3. However in karstic aquifers a significant water volume is becoming brackish due to seawater intrusion in coastal karstic springs or the fact that a portion of karstic aquifers discharge directly into the sea. The springs of high salinity are estimated to have an average discharge of 450 hm3. It is estimated that saline spring water and spring outflow of freshwater into the marine environment exceeds 900 hm3, resulting in almost half the groundwater not being available for any use, taking into account the conventional extraction technologies and available infrastructures. Similar patterns are observed in Zakynthos island where only a volume of 4.9 hm3 (3.3%) is the annual consumption of groundwater, from 149 hm3 total annual groundwater recharge, which is mainly discharged through submarine springs into the Ionian Sea (Diamantopoulou & Voudouris, 2008). A great number of small hydrological basins are formed on the island of Crete due to its elongate shape and the occupation of massifs on the central axis. The annual rivers’ outflow to the sea is estimated to be 740 hm3, which includes both the river flow and inland spring discharge that contributes to the rivers.
Downloaded by [Technical University of Crete] at 08:32 05 September 2014
8
O. Tzoraki et al.
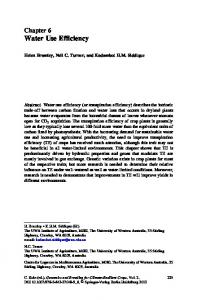
Table 2 depicts the estimated hydrological balance of Crete in billions m3 per year for three hydrological states, namely a normal year with a return period equal to or exceeding 50%, a wet year with a return period equal to or exceeding 10%, and a dry year with a return period equal to or exceeding 90%. West Crete, which has a smaller drainage area than the east, accepts higher precipitation volumes in comparison with east Crete. Major springs are met in the north-west part of Crete (maximum recorded flow 6000 m3h21) in contrast to the south-east part where the springs’ flow is less (15 – 70 m3h21) (IGME, 2009). The freshwater needs of the Cretan region were estimated to reach 535 hm3 annually. About 65 hm3 are needs for the human water supply and tourism, 6.2 hm3 for livestock, 460 hm3 for agriculture, 0.9 hm3 for olive mills and 3.2 hm3 for industrial purposes. Around half (46%) of the total water needs is requested by Heraklion prefecture. The available water volume on an annual basis is estimated as 372 hm3 and is extracted from alluvial and karstic aquifers. The increased water demand for agricultural use on the island, which absorbs approximately 86% of the water use, cannot always be met (Koutroulis, Vrohidou, & Tsanis, 2011). The water deficit of the island is estimated at about 163 hm3 by the RIBASIM model, which equals 30% of total needs. Thus, great effort has been focused on the rational use of water by the agricultural sector, even though it is observed that the irrigated water exceeds 500 mm annually (a mean rate for agriculture). The future water mass balance scenario, as simulated by the RIBASIM model, predicts that the operation of the three reservoirs under construction with a storage capacity of 50 hm3 will result in a future decreased water deficit of 114 hm3. The water stored in reservoirs is planned to cover mainly irrigation demands. The fact that a great portion of the available water resources comes from groundwater aquifers (92%) dictates the need for effective groundwater management and indicates that all viable tools like SWUI will help in that direction. Spatial Water Use efficiency Index (SWUI) The mean SWUI was estimated (16.9) for the whole island with maximum values in the south-west part of the island (214.3) and minimum negative values in the east part of the island (– 0.8). As shown in Figure 4, SWUI depicts the low efficiency of the east part of Table 2. Hydrologic mass balance of a normal, dry and wet year for the island of Crete, east and west parts. Annual water mass balance (109 m3) in Crete Rainfall
Actual evaporation
Hydrologic year Normal 7.69 Wet 10.33 Dry 5.07 East Crete (area 4400 km 2) Normal 3.61 Wet 4.91 Dry 2.33 West Crete (area 3865 km 2) Normal 4.07 Wet 5.40 Dry 2.74
Surface runoff
Infiltration to ground water
4.75 6.48 3.18
0.74 0.99 0.49
2.20 2.85 1.40
2.27 3.08 1.49
0.35 0.47 0.22
1.00 1.35 0.64
2.55 3.39 1.72
0.39 0.52 0.26
1.12 1.49 0.76
Downloaded by [Technical University of Crete] at 08:32 05 September 2014
International Journal of Water Resources Development
9
Figure 4. Spatial water use efficiency index (SWUI).
the island to cover the water needs in a sustainable way, where the index values are lower than the mean. SWUI receives negative values in the area of Messara aquifer (– 0.83 up to zero) at south Heraklion. Groundwater extraction by Messara aquifer reaches 51 hm3 annually, exceeding aquifer yield by 10 hm3 (Kritsotakis & Tsanis, 2009). The aquifers’ capacity in the north part of Chania and Heraklion prefectures has negative values of SWUI since water needs overcome the natural aquifers’ recharge process. Apparently positive values of SWUI imply that recharge capacity overcomes aquifer depletion; however limits to its applicability are imposed by the fact that most coastal aquifers are unconfined over the coastline of central, north and south-east Crete and freshwater is inserted through submarine springs into the sea and therefore it cannot be used for any purpose. Discussion SWUI highlighted the areas that suffer water deficit or that the demands are higher than the natural recharge. Negative values of SWUI indicate that the water scarcity is caused mainly by excessive irrigation and urban development, which disrupt the balance between water supply and demand in the river basins. Especially, specific coastal areas are already threatened by salt intrusion phenomena but continue to be a source of freshwater after decades of alarm. Positive values of SWUI show the high potential for freshwater resources without coming close to aquifer sustainable thresholds. SWUI values were estimated in some case studies of aquifers, which are listed in Table 3. Information on annual recharge and abstraction was made available by means of various methodologies and models. They are impacted by water stress due to human intervention and SWUI values ranges between 2 0.61 and 5.06. Similar to Crete, the semiarid coastal aquifer of the southern Italy region that suffers by overexploitation has negatives values or is close to zero: 2 0.01 for Tavoliere, 0.07 for Arco Ionico, 1.43 for Salento and 2.19 for Murge (Sami & Hughes, 1996). Pumping in Critical and Dry years in a 2300 km2 semi-arid, irrigated agricultural area in the southern San Joaquin Valley, California, accounted for 55– 80% of the total applied water (SWUI ¼ 0.25 –0.82), therefore Above Normal and Wet years accounted for 30– 54% (SWUI ¼ 0.85 –2.30) (Ruud, Harter, & Naugle, 2004). In that case, positive SWUI values close to unity (0.82) are the critical threshold value of aquifer depletion in a Critical Dry year. The examination of typical cases in various parts of the world pointed out by some experts as serious aquifer
10
O. Tzoraki et al.
Table 3. SWUI estimated for various aquifers under overexploitation. Case study
Comments
References Sami & Hughes (1996)
Above normal wet year Lora
20.01 Karoo aquifer, Africa 0.07 1.43 2.19 0.25 – 0.82 Southern San Joaquin Valley, California, USA 0.85 – 2.30 20.16
South-east Spain
Ming East Bourne
20.33 1.88
Martos-Rosillo, Rodrı´guezRodrı´guez, Moral, Cruz-Sanjulia´n, & Rubio (2009)
Five chalk blocks of the South Downs, UK
Robins et al. (1999)
Seaford Brighton Worthing Chichester Tucson
3.59 2.91 1.57 5.06 20.5
Hermosillo and Sahuarall Valleys aquifer Mexico City Alt Vinalopo Valley Wetland Dona˜na Sokh aquifer
20.39 20.375 20.61 2.5 20.31
Mexico Spain South-west Spain Central Asia
Valle de Toluca Lusaka Plateau North-east Corinthian aquifer Hebei Province Beijing Plain
20.008 20.214 20.24
Mexico Zambia Greece
20.425 20.115
North China China
Toluca Valley
20.24
Mexico
Tavoliere Accolanico Salento Murge Critical dry year
Downloaded by [Technical University of Crete] at 08:32 05 September 2014
SWUI
Ruud et al. (2004)
Typical cases pointed out Custodio (2002) by some experts as serious aquifer overexploitation; Arizona, USA
Gracheva, Karimov, Turral, & Miryusupov (2009) Esteller & Andreu (2005) Mpamba et al. (2008) Voudouris (2006) Chen (2010) Zhou, Wang, Liu, Li, & Zheng (2012) Calderhead, Martel, Garfias, Rivera, & Therrien (2012)
overexploitation (Custodio, 2002) found SWUI values from 2 0.61 (Alt Vinalopo Valley, Spain) to 2 0.375 (Mexico City). Even the positive value of 2.5 for wetland and natural wildlife Dona˜na, south-west Spain, is characterized as a serious overexploitation status because the lowering of the water table has affected some perennial vegetation and habitats and reduced the frequency of appearance of a temporary lagoon. The aquifer management of the South Downs in the UK which consists of five overexploited chalk blocks (Robins, Jones, & Ellis, 1999) has positive values of SWUI (1.57 – 5.06). Agricultural plants and products could be associated with SWUI to measure whether more wealth is being generated domestically with fewer resources. SWUI does not correspond to the hydrological footprint but visualizes the potential of an aquifer when regarding the availability of water resources, a key element in the water cycle of semi-arid areas and especially on small Mediterranean islands. Except for aquifer hydraulics and
International Journal of Water Resources Development
11
Downloaded by [Technical University of Crete] at 08:32 05 September 2014
water-balance changes, SWUI and a number of indicators should also be considered, such as geochemical interaction between groundwater, aquifer sediments, soils and vegetation, in order to maintain the sustainable yield of an aquifer under stress conditions of low rainfall. Conclusions and recommendations Intensive agricultural and touristic development has resulted in serious environmental problems in Crete regarding water issues. Some of them involve coastal aquifers affected by seawater intrusion and contaminated return flow from large irrigation areas and urban water recharge. The fast growth of irrigated agriculture was favoured by low water prices, stimulating uncontrolled groundwater use. The difficulties in defining overexploitation and the uncertainty of the magnitude of recharge should not hinder groundwater use. Issues of water management, spatial planning and agriculture were administered by distinct organizational bodies such as the Eastern Crete Development Organization and the Western Crete Development Organization, municipalities, water associations and several local Land Reclamation Services without any cooperation between them. Crete is recognized as WD13 and the responsibility for water management belongs to the Water Department of the Decentralized Administration of Crete. Crete faces droughts quite often. A prerequisite in the creation of management plans is public participation and the active involvement of all interested parties. Even water authorities inexperienced in the participatory and cooperative forms of governance supervised several stakeholders groups. By examining the impact of the participatory processes, a main outcome was the effective link to several water use sectors. Some forms of interaction and cooperation were established between associations managing irrigation water and public water supply services. Current policies identify as a first priority the maintenance of domestic and municipal water supply and as a second priority agricultural needs. Perennial crops are the first priority of the agricultural sector compared with seasonal vegetables. Negative values of SWUI are an alarm that measures should be taken to maintain aquifer sustainability. Even values close to unity correspond to Critical and Dry years (Ruud et al., 2004) and a value of 2.5 is a threshold for overexploitation, a characterization of wetlands in Spain (Custodio, 2002). A high number of Cretan municipalities are served by aquifers that have reached negative SWUI values. Especially, the coastal cities of north Crete are served by a dense network of pipes that transfer water from springs, reservoirs and groundwater bodies. Measures are considered (e.g. managed aquifer recharge, village connection to wastewater treatment plants, river ecological flow, erosion elimination, flood control) to prevent drought and ecological problems towards resources efficiency. A substantial amount of water is reused; eight of the 18 domestic wastewater treatment plants in Crete reuse the water satisfying agricultural water needs. Also during the last years desalination technology has started to be used to obtain small quantities of water for domestic supplies, even though that is recognized as a very expensive solution. The availability of various hydro-informatics tools, such as simulation models, optimization techniques, database management systems, the Internet and geographical information system (GIS), provide an excellent basis for building a decision support system (DSS). Experiments with the components of DSS built in the framework of this study, especially with RIBASIM, give the authors the ability to state that DSS can facilitate considerably the integrated water resources management in this river basin. With increasing water scarcity due to climate change and the need for financial sustainability and declining financial resources available for irrigation and water resource
12
O. Tzoraki et al.
Downloaded by [Technical University of Crete] at 08:32 05 September 2014
development, reform of water pricing is essential. A gradually increasing water price is recommended for Messara Valley. In order to implement an integrated conservation policy, the water pricing mechanism should work together with other measures of water conservation. Crete is moving into the sustainable management era of existing water resources, aiming to achieve maximum yields and optimal utilization. An important goal taking into consideration the limited available resources and the growing demands in the urban and touristic sector is the need to balance demand and supply. Additional measures should be taken to prevent ecological problems, such as irrigation by reclaimed water, desalination technology, drought control, salt intrusion prevention of coastal aquifers.
References Calderhead, A. I., Martel, R., Garfias, J., Rivera, A., & Therrien, R. (2012). Pumping dry: An increasing groundwater budget deficit induced by urbanization, industrialization, and climate change in an over-exploited volcanic aquifer. Environmental Earth Sciences, 66, 1753– 1767. Chen, J. (2010). Holistic assessment of groundwater resources and regional environmental problems in the North China plain. Environmental Earth Sciences, 61, 1037– 1047. Custodio, E. (2002). Aquifer overexploitation: What does it mean? Hydrogeology Journal, 10, 254– 277. Diamantopoulou, P., & Voudouris, K. (2008). Optimization of water resources management using SWOT analysis: The case of Zakynthos Island, Ionian Sea, Greece. Environmental Geology, 54, 197– 211. Esteller, M. V., & Andreu, J. M. (2005). Anthropic effects on hydrochemical characteristics of the Valle de Toluca aquifer (central Mexico). Hydrogeology Journal, 13, 378– 390. Foster, S., & Loucks, P. D. (2006) Non-renewable groundwater resources: A guidebook on sociallysustainable management for water-policy makers. IHP-VI Series on groundwater, No 10, UNESCO. Gain, A. K., & Wada, Y. (2014). Assessment of future water scarcity at different spatial and temporal scales of the Brahmaputra river basin. Water Resources Management, 28, 1 – 14. Gleeson, T., & Wada, Y. (2013). Assessing regional groundwater stress for nations using multiple data sources with the groundwater footprint. Environmental Research Letters, 8. Gracheva, I., Karimov, A., Turral, H., & Miryusupov, F. (2009). Evaluation du potentiel et impact des eaux hivernales infiltrees dans l’aquifere de sokh, asie centrale. Hydrogeology Journal, 17, 1471– 1482. IGME. (2009). Una evaluacio´n del potencial e impactos del embancamiento de agua invernal en el acuı´fero sokh, asia central. Technical Project, 42. Koutroulis, A. G., Tsanis, I. K., Daliakopoulos, I. N., & Jacob, D. (2013). Impact of climate change on water resources status: A case study for Crete island, Greece. Journal of Hydrology, 479, 146– 158. Koutroulis, A. G., Vrohidou, A. K., & Tsanis, I. K. (2011). Spatiotemporal characteristics of meteorological drought for the Island of Crete. Journal of Hydrometeorology, 12, 206– 226. Kritsotakis, M., & Tsanis, I. (2009). An integrated approach for sustainable water resources management of Messara basin, Crete, Greece. European Water, 27/28, 15 – 30. Krogt, V. d. (2008a). RIBASIM Version 7.00. Technical reference manual. Delft: WNM Deltares. Krogt, V. d. (2008b). RIBASIM Version 7.00. User manual. Delft: WNM Deltares. Krol, M. S., de Vries, M. J., van Oel, P. R., & de Arau´jo, J. C. (2011). Sustainability of small reservoirs and large scale water availability under current conditions and climate change. Water Resources Management, 25, 3017– 3026. Lambrakis, N., & Kallergis, G. (2001). Reaction of subsurface coastal aquifers to climate and land use changes in Greece: Modelling of groundwater refreshening patterns under natural recharge conditions. Journal of Hydrology, 245, 19 –31. Martos-Rosillo, S., Rodrı´guez-Rodrı´guez, M., Moral, F., Cruz-Sanjulia´n, J. J., & Rubio, J. C. (2009). Analyse de l’exhaure dans deux aquife`res carbonate´s de la sierra de estepa (s.e. De l’espagne) base´e sur des donne´es hydrodynamiques et hydrochimiques. Hydrogeology Journal, 17, 1617– 1627.
Downloaded by [Technical University of Crete] at 08:32 05 September 2014
International Journal of Water Resources Development
13
Meijer, K. S., Krogt, W. N. M., & Beek, E. (2012). A new approach to incorporating environmental flow requirements in water allocation modeling. Water Resources Management, 26, 1271– 1286. Mpamba, N. H., Hussen, A., Kangomba, S., Nkhuwa, D. C. W., Nyambe, I. A., Mdala, C., . . . Shibasaki, N. (2008). Evidence and implications of groundwater mining in the Lusaka urban aquifers. Physics Chemistry of the Earth, Parts A/B/C, 33, 648– 654. Naoum, S., & Tsanis, I. K. (2003). Temporal and spatial variation of annual rainfall on the island of Crete, Greece. Hydrological Processes, 17, 1899– 1922. Papatheodoulou, A., Tzoraki, O., Panagos, P., Taylor, H., Ebdon, J., Papageorgiou, G., & Symons, N. (2013). Simulation of daily discharge using the distributed model SWAT as a catchment management tool-Limnatis River case study. Parisi, S., Pascale, S., Sdao, F., & Soupios, P. (2013). Assessment and mapping of the intrinsic vulnerability to pollution: An example from Keritis River Basin (Northwestern crete, Greece). Environmental Earth Sciences, 70, 2659– 2670. Potocˇnik J. (2013). Speech 13/767, Opting in for innovation on our road towards resource efficiency. Speech at the 5th European Innovations Summit, Brussels 30 September 2013. Robins, N. S., Jones, H. K., & Ellis, J. (1999). An aquifer management case study-The Chalk of the English South Downs. Water Resources Management, 13, 205– 218. Ruud, N., Harter, T., & Naugle, A. (2004). Estimation of groundwater pumping as closure to the water balance of a semi-arid, irrigated agricultural basin. Journal of Hydrology, 297, 51 – 73. Safaei, M., Safavi, H. R., Loucks, D. P., Ahmadi, A., & van der Krogt, W. (2013). Integrated river basin planning and management: A case study of the Zayandehrud River basin, Iran. Water International, 38, 724– 743. Sami, K., & Hughes, D. A. (1996). A comparison of recharge estimates to a fractured sedimentary aquifer in South Africa from a chloride mass balance and an integrated surface-subsurface model. Journal of Hydrology, 179, 111– 136. Su, C. C., Lu, J. Y., & Hong, J. H. (2013). A field investigation of the sediment transport characteristics of a high sediment load intermittent river in Taiwan. Hydrological Processes, 27, 4043– 4056. Sulis, A., & Sechi, G. M. (2013). Comparison of generic simulation models for water resource systems. Environmental Modelling & Software, 40, 214– 225. Tzoraki, O., Do¨rflinger, G., Dimitriou, C., & Polykarpou, P. (2012). Controlling pollution risk of an important drinking water reservoir in a strongly human altered and climatically induced semiarid environment. 3nd International Conference on Industrial and Hazardous Waste Management, Chania, Crete. September 10 – 14. Voudouris, K. S. (2006). Groundwater balance and safe yield of the coastal aquifer system in NEastern Korinthia, Greece. Applied Geography, 26, 291– 311. Wada, Y., & Heinrich, L. (2013). Assessment of transboundary aquifers of the world-Vulnerability arising from human water use. Environmental Research Letters, 8. Wada, Y., Wisser, D., & Bierkens, M. F. P. (2014). Global modeling of withdrawal, allocation and consumptive use of surface water and groundwater resources. Earth System Dynamics, 5, 15 – 40. Zhou, Y., Wang, L., Liu, J., Li, W., & Zheng, Y. (2012). Options of sustainable groundwater development in Beijing Plain, China. Physics Chemistry of the Earth, Parts A/B/C, 47 –48, 99 – 113.