U.S. Air Force Academy, Colorado 80841. DOI: 10.2514/1.36716. The ability to spatially alter both the amount of body force along the span of a plasma actuator ...
AIAA JOURNAL Vol. 47, No. 6, June 2009
Spatially Distributed Forcing and Jet Vectoring with a Plasma Actuator C. Porter,∗ A. Abbas,† K. Cohen,‡ T. McLaughlin,§ and C. L. Enloe¶ U.S. Air Force Academy, Colorado 80841 DOI: 10.2514/1.36716 The ability to spatially alter both the amount of body force along the span of a plasma actuator and the angle of the resulting jet relative to the surface has been demonstrated. A dielectric barrier discharge plasma actuator consists of two electrodes separated by a dielectric barrier, which imparts momentum to the surrounding fluid parallel to the dielectric. To investigate a technique to shape the spanwise body force created by the plasma actuator, a control volume momentum balance was used. By shaping the buried electrode along the span of the actuator, the local volume of plasma generated can be controlled, which is related to the local body force. Pressure measurements were taken in the boundary layer behind the actuator to calculate the momentum imparted to the flow at various spanwise locations corresponding to different electrode widths. Particle image velocimetry data were then used to show that spatially varying, steady jets could be created with the use of only one actuator by varying the width of the buried electrode in a quiescent flow. The angle of the jet created, relative to the dielectric, by a plasma synthetic jet is also investigated. By pointing two plasma actuators at each other, an inverted impinging jet can be created as a result of the two independent jets colliding. By altering the strength of one of the jets relative to the other, the angle of separation can be changed. Particle image velocimetry data were taken to show the effects of altering the voltage (strength) applied to one of the actuators relative to the other. It was found that, with this method, jet vectoring could be achieved. The angle of the jet could be controlled a full 180 deg through small changes in the voltage applied to the electrodes, also in a quiescent flow.
Nomenclature D FB FS P qd;off
= = = = =
qd;on
=
Re St U ud;off
= = = =
ud;on
=
W � �V
= = =
�
=
I. Introduction
F
diameter body force shear force power dynamic pressure downstream of the actuator (0.035 m) with the plasma off dynamic pressure downstream of the actuator (0.035 m) with the plasma on Reynolds number Strouhal number freestream velocity velocity downstream of the actuator (0.035 m) with the plasma off velocity downstream of the actuator (0.035 m) with the plasma on waviness amplitude angle of jet measured counterclockwise voltage differential between exposed electrodes relative to ground wavelength
LOW control as described by Gad-el-Hak [1] is a process in which energy must be expended to manipulate the flow: “The potential benefits of realizing efficient flow-control systems range from saving billions of dollars in annual fuel costs for land, air, and sea vehicles to achieving economically and environmentally more competitive industrial processes involving fluid flows.” In general, flow control can be separated into two general categories: passive and active. Active flow control differs from passive flow control in that the latter does not require an external input of energy. In other words, passive flow control would, for instance, include using boundary-layer trips or surface roughness to prematurely transition a boundary layer. Active flow control, on the other hand, requires an external energy input allowing employment only under beneficial conditions. Many different forms of actuation have been used to provide the potential benefits of active flow control, including synthetic jets, surface movement (displacing the object of interest), acoustic excitation, and electro/magnetohydrodynamic-type devices such as the dielectric barrier discharge (DBD) plasma actuator [2]. Actuators can generally be divided into two main categories: zero net mass or net-mass addition. Zero-net-mass actuators consist of an alternating suction and blowing in which the time-averaged addition of mass is zero. On the other hand, net-mass actuators consist of continually adding mass to the system, such as a continuousblowing-type actuator. Typically, both forms of actuation are achieved by cutting a slot into the object of interest and either blowing/sucking the fluid of interest in/out of the slot. This creates a two-dimensional jet, uniform across the span of the slot and, therefore, typically uniform across the object of interest. However, studies have shown that geometrically altering the shape of an object or, more specifically, introducing a spatial “waviness,” can greatly reduce the mean drag. Introducing this spatial waviness has also been shown to greatly reduce the unsteady fluctuations in lift and drag associated with vortices shedding off the body of interest [3–11]. Similarly, the jet induced from suction/blowing out of a slot is constrained to a given exiting angle relative to the object. This constraint precludes investigating the possibility that different scenarios would benefit from a different exit angle. Previous efforts, both computational and experimental, have shown that minor geometric modifications can be very beneficial to
Presented as Paper 1374 at the 46th AIAA Aerospace Sciences Meeting and Exhibit, Reno Nevada, 7–10 January 2008; received 21 January 2008; revision received 7 March 2009; accepted for publication 7 March 2009. This material is declared a work of the U.S. Government and is not subject to copyright protection in the United States. Copies of this paper may be made for personal or internal use, on condition that the copier pay the $10.00 percopy fee to the Copyright Clearance Center, Inc., 222 Rosewood Drive, Danvers, MA 01923; include the code 0001-1452/09 $10.00 in correspondence with the CCC. ∗ Graduate Research Assistant, Department of Aeronautics, Headquarters; also, Master’s Student, University of Colorado, Department of Mechanical Engineering, Colorado Springs, Colorado 80933. Student Member AIAA. † Cadet, Department of Aeronautics, Headquarters. Student Member AIAA. ‡ Contracted Research Engineer, Department of Aeronautics, Headquarters. Associate Fellow AIAA. § Director, Aeronautics Research Center, Department of Aeronautics, Headquarters. Associate Fellow AIAA. ¶ Professor, Department of Physics, Headquarters. Senior Member AIAA. 1368
1369
PORTER ET AL.
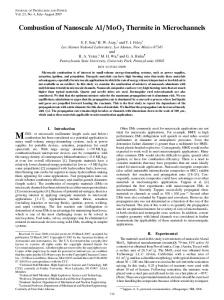
the overall aerodynamic performance [3–11]. Researchers have found that creating three-dimensional wavy leading or trailing edges with identical mean thickness/diameters as their counterpart straight edges can result in a reduction of the mean drag. A three-dimensional edge is created by introducing waviness to the object. Figure 1 shows a typical right cylinder compared with a wavy cylinder with identical mean diameters [6,7]. This same concept can be used for square cylinders [4] or airfoils [3,9]. The addition of a spanwise waviness has been shown to reduce the mean drag from 10 to 30%, which has been shown experimentally and computationally [3–11]. The DBD plasma actuator has the potential to create a spatially distributed force without the practical difficulty of the other forms of actuation that have been used successfully to create spatial distributions without geometric modifications. The application of the DBD actuator to a cylinder in crossflow is reported in another paper [12]. Finally, as has been shown in experimental and computational investigations [3–11], there exists a waviness ratio (W=�) that optimizes the reduction in drag, but is correlated to the distance between shedding vortices. As the freestream velocity (U) increases, the shedding frequency also increases (assuming a constant Strouhal number). As a result, the distance between vortices is constant because the convective speed is also increased. Therefore, achieving a spatially varying force with a constant wavelength and amplitude has the potential to provide a means of drag reduction that spans a large range of Reynolds numbers, making for a very robust technique. Using jets to modify a flowfield has been investigated to bring about the ability to vector thrust, mix, and reduce noise or thermal signatures [13]. One common application of such jets is the use on flight vehicles for thrust vectoring. Jet vectoring is typically achieved by either extended or moving surfaces. These techniques typically rely on attaching the jet to one side of the nozzle and using fluidic properties, such as the Coanda effect, to cause the flow to then attach to the adjacent side of a nozzle. This results in a bistable apparatus, in which the jet can either be attached to one wall or the other, but cannot be vectored to any angle in between. Besides using extended or moving surfaces, this can also be achieved by using a small secondary jet to bring about a deflection in the primary jet, in which the secondary jet is not located on the same plane as the primary jet, as in the case of a fluidic oscillator [14–16]. Another technique uses two adjacent jets on the same plane to create a fluidic interaction. As fluid from the secondary jet is entrained into the primary jet, the local static pressure is altered, resulting in the primary jet deflecting toward the secondary jet [17]. Therefore, no moving or extended surfaces are needed. This allows the angle of the primary jet to be altered in precise increments by changing the strength of the secondary jet. However, most jet vectoring applications have been in large-scale or high speed applications. There remains a void in the actuator designs needed for flow control in which the angle of the jet relative to the surface cannot be controlled. To date, any actuator used for flow control, such as synthetic jets, has a fixed angle for the jet with respect to the surface. Similarly, even the use of a secondary jet to change the primary jet’s angle is typically limited to about a 30 deg deflection from normal. Therefore, if a current actuator were used to vector other actuators, the angle of deflection is limited, while simultaneously increasing the complexity and unreliability of the system. As will be shown, the use of plasma actuators will result in an actuator that has no moving parts, and the angle of the resulting jet
U
II.
Background
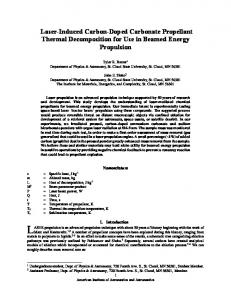
The single dielectric barrier discharge (SDBD) plasma actuator has been studied extensively, ranging from applications such as delaying separation on airfoils down to the basic phenomenology associated with the surface discharge itself. The DBD plasma actuator consists of two electrodes separated by a dielectric barrier. When a voltage [ac � >10 kV peak to peak (kVpp)] is applied, the local air is ionized. By offsetting the electrodes, as shown in Fig. 2, the ions are simultaneously accelerated by the resulting electric field. As the ions are accelerated, they collide with the surrounding neutral particles, transferring their momentum. Because of weak ionization of the plasma, the collision rate of the ions and neutrals, and the mean free path of air, it is safe to assume that all the momentum of the ions is eventually transferred to the surrounding neutrals; therefore, the plasma actuator can be thought of as imposing a localized body force to the surrounding air. Enloe et al. [19], Baughn et al. [20], and Porter et al. [21] have previously characterized the amount of body force produced by the plasma actuator and shown that the amount of force produced is on the order of milli-Newtons per meter. Similarly, it has been shown that the amount of momentum imparted to the flow is confined within the first couple of millimeters above the surface [19– 25]. Visbal et al. [26], Seraudie et al. [27], and Porter et al. [22] have shown that the plasma actuator serves as an electronic boundarylayer trip, causing a laminar boundary layer to transition prematurely. Forte et al. [24] have used laser Doppler velocimetry to provide timeresolved boundary-layer data with the plasma actuator turned on. The plasma actuator has also been shown to have great potential to serve as a means to achieve active flow control. Post and Corke [28,29] have shown that, when the plasma actuator is placed on an airfoil, the separation angle of attack of the airfoil can be increased approximately 4–6 deg compared with an identical airfoil without the actuator (with the Reynolds number ranging from 77,000 to 460,000). Göksel et al. [30] also used actuators to investigate their effect on micro air vehicles and compared their results with both twoand three-dimensional boundary-layer trips. List et al. [31] and Huang et al. [32] have observed the same phenomenon by placing the plasma actuator on low-pressure turbine blades (with Reynolds numbers ranging from 30,000 to 203,000). It has also been demonstrated by McLaughlin et al. [33,34] that actuators placed on the sides of a cylinder in a crossflow have the ability to lock in the frequency of the vortex shedding, effectively altering the natural shedding frequency to that of the forcing frequency of the plasma actuator, within limits (with Reynolds numbers ranging from 74,000 to 300,000). The applications mentioned here all rely on the actuator inducing momentum into the flow to bring about some change. However, certain applications will require more force than others. Van Dyken et al. [35] made force measurements for two standard (linear, constant-width insulated electrode) plasma actuators in which they tested the effects of the width of the buried electrode. Their results
U
Z
Y
Z
X
a)
can be controlled with small voltage changes, resulting in a jet that can be vectored at the convective speed of the fluid through a full 180 deg. Note that Bolitho and Jacobs [18] have independently developed a similar configuration by altering the duty cycle as opposed to the applied voltage.
Y
X
b)
Fig. 1 Two cylinders in a crossflow with identical mean diameters: a) right cylinder, and b) wavy cylinder.
Fig. 2 Standard linear dielectric barrier discharge plasma actuator diagram.
1370
PORTER ET AL.
show two interesting effects of value to this experimental effort. The first was that, when the plasma actuator was dissipating a large amount of power (>80 W=m), having a wider insulated electrode resulted in the actuator producing more force. However, at lower power level settings, wider electrodes produced no significant difference in force. These two results led to the conclusion that the amount of force produced by the plasma actuator is directly related to the volume of air with which the plasma interacts. As the power dissipated by the plasma actuator increases, so does the physical extent of the plasma. In other words, as the dissipated power increases, the plasma marches farther out along the insulated electrode, as demonstrated by Enloe et al. [19]. At the lower power dissipated levels, the plasma’s extent is not limited by the insulated electrode; therefore, both the plasmas (one for each width of electrode) interact with the same volume of air. However, as the dissipated power increases, so does the extent of the plasma; therefore, the narrower insulated electrode begins to limit the extent of the plasma and, therefore, the volume of air that the plasma interacts with. This fact will be used here to create a steady, spatially distributed body force using the plasma actuator. Although the amount of momentum imparted to the air from the plasma is related to the volume of the plasma, it is also related to the strength of the electric field. Therefore, increasing the voltage (Vrms ) applied to the electrodes will both increase the volumetric extent of the plasma as well as the strength of the electric field. This results in an increase in the number of ions available to be accelerated, as well as the force to accelerate them. Therefore, small voltage changes in the applied voltage can result in noticeable force changes. These facts will be used to vector the actuator-produced jet a full 180 degrees.
III. Experimental Setup A.
Body Force Measurements
Two experimental setups were used. In the first, two separate actuators were used to create a spatially distributed body force varying in the spanwise direction. A diagram of the electrical circuit and power supply can be found in Van Dyken et al. [35]. Each actuator was built on a 0.0024-m-thick flat glass panel with an exposed electrode of constant width (0.0064 m). The first actuator had an insulated electrode on the bottom of the glass surface cut into a wedge shape, as shown in Fig. 3a, in which the measurements of the glass plate shown serve as the control volume for the momentum balance. The widest portion of the insulated electrode was 0.0127 m, linearly varying its width down to 0 m at the other end over a span of 0.1524 m. This served as the benchmark for this experimental effort. As will be discussed in the following section, because the plasma is self-limiting, there existed some spanwise portion of the electrode in which the plasma would quench itself before it reached the end of the electrode, due to the reversal of the voltage signal. To obtain a higher resolution on the effect of varying the width of the insulated electrode, a second actuator was built in what will be referred to as the V-shaped actuator. The geometry of the V-shaped actuator can be seen in Fig. 3b, in which the maximum width, located in the center of the actuator, was limited to 0.0089 m. This width was chosen based on the maximum extent of the plasma on the wedgeshaped actuator just discussed. To determine the maximum width to
which the plasma would expand, a digital photo was taken of the wedge-shaped actuator with the plasma on and with the plasma off. To calibrate the picture, a ruler placed in the picture served as a reference. The pictures were then calibrated, and the maximum extent of the plasma was determined by observing the number of pixels for which the blue value exceeded an red–green–blue scaling threshold. Each actuator was individually placed on the floor of a 0:3 � 0:3 m wind tunnel, and a fairing was added to the front of the glass plate to provide a smooth transition from the floor of the wind tunnel to the glass plate. A total pressure boundary-layer probe (United Sensor BA-.025-12-C-11-0.650 connected to a Baratron 0.2 torr Pressure Transducer 223BD-000.2AAB accurate to within 0.5% full scale) was used to measure the amount of force produced by the actuator using a standard control volume momentum balance. The probe was positioned both 0.075 m upstream and 0.035 m downstream of the trailing edge of the exposed electrode (Fig. 3). These points served as the boundaries of the control volume, in which measurements were made with the plasma on and plasma off. All tests were performed with the plasma operating at 5 kHz and 19 kVpp. The V-shaped actuator was also tested at 10 kHz, holding dissipated power the same as at 5 kHz. The power was calculated by ensemble-averaging multiple voltage/current cycles together to remove the current spikes. Voltage and current were then multiplied at each time point and summed over the waveform period to determine the net power consumption. The height of the probe above the plate was set using a step motor traverse, whereas the spanwise location of the probe was set by hand. To set the spanwise location of the total pressure probe, the wedgeshaped actuator plate was marked in 0.01 m increments, covering the 0.15 m span of the actuator. On the V-shaped actuator, 0.01 m spanwise markings were also started at one of the edges and continued until the apex of the insulated electrode was reached. At that point, the next spanwise measurement location occurred 0.005 m from the previous one and then continued on in the standard 0.01 m increment used elsewhere. By offsetting the spanwise location, more data points could be obtained for different insulated widths. B.
Constant-Width Insulated Electrodes
Using the same setup mentioned earlier, an additional set of tests was run in which the width of the insulated electrode was held constant. For this set of tests, eight different actuators were tested, each with a different insulated electrode width ranging from 0.002 to 0.009 m. This was undertaken to determine if three-dimensional effects were present from either the reshaping of the electric field or the velocity field due to the unevenly distributed momentum addition. Note, however, that the two effects cannot be separated using this technique. C.
Distributed Plasma Synthetic Jets and Jet Vectoring
Two different plasma synthetic jets were constructed to create a velocity distribution varying spanwise but directed normal to the surface, as opposed to the tangential arrangement described earlier, shown in Fig. 4. The first will be referred to in this paper as the triangular plasma synthetic jet, in which two V-shaped actuators
Fig. 3 Shown are the following: a) wedge-shaped DBD plasma actuator, and b) V-shaped DBD plasma actuator.
1371
PORTER ET AL.
Insulated Electrode
Exposed Electrode
a)
b) Fig. 4 Distributed plasma synthetic jets, each creating four distinct jets.
were constructed to fire in opposite directions, resulting in a normal jet. The second is termed the binary plasma synthetic jet, in which the ground electrode was constructed so that either the plasma’s extent was fully limited from the width of the electrode, leaving just enough electrode to complete the circuit, or the plasma’s extent was not limited at all. To measure the effect of these constructions of the plasma actuator, a particle image velocimetry (PIV) setup was used, in which 150 image pairs were captured with a field of view of 0:254 � 0:254 m. The correlated images were then time averaged. All the PIV data presented here are for a plasma actuator in quiescent flow. The jet vectoring results were obtained using a standard linear plasma synthetic jet (L-PSJA) [36–38], also described by Sherman [39]. However, the voltage applied to each of the exposed electrodes was not held at the same value (Fig. 5). For the steady jet vectoring data, each exposed electrode’s voltage was set and fixed such that there existed a distinct voltage differential between the two. PIV data, taken in an identical manner to that mentioned earlier, were obtained. Once the static tests were complete, such that a known voltage differential would result in a known jet vectoring angle, the input voltage waveforms were then amplitude modulated to create a jet that oscillated a full 180 deg at a fixed frequency. This is similar to the work of Sherman [39] except that, instead of turning one side on and then the other, creating a jet at either 0, 90, or 180 deg measured from the surface, every angle from 0 to 180 deg is achieved.
IV. A.
Results
Plasma Extent
To correlate the amount of force produced by the plasma actuator with the extent of the plasma (volume of air that the plasma interacts with), photos of the plasma were taken. As mentioned earlier, the pictures were then calibrated and the extent of the plasma was determined by specifying a threshold blue value of each pixel to determine the location of the plasma. This assumed that the plasma only extended as far as visible light created by the plasma. A photo of the wedge-shaped actuator can be seen in Fig. 6. Notice that, in the
Fig. 5 Jet vectoring using two independently controlled plasma actuators orientated at each other. The angle of the jet relative to the surface can be controlled by changing the voltage applied to one of the upper electrodes relative to the other.
right half of the picture, the extent of the plasma linearly decreases from the center to the right edge of the picture. From the light correlations, the extent of the plasma matched the extent of the encapsulated electrode. Therefore, the plasma in the far right portion of the picture is interacting with a smaller volume of air when compared with the plasma in the left half of the picture. However, in the left half of the picture, the extent of the plasma appears to have plateaued, even though the extent of the electrode is beyond this point, as indicated by the dotted line. In this region, the plasma is quenching due to its self-limiting nature before it reaches the edge of the electrode. The measured value of the plasma’s extent in this region, based on light measurements with the plasma at 5 kHz, 19 kVpp, and at an atmospheric pressure of 77.2 kPa, was found to be 0.0089 m. This was used to set the maximum extent of the insulated electrode for the V-shaped actuator. The temperature was between 18 and 19� C during these tests. B.
Spanwise Body Force Measurements
The body force (or amount of momentum) created by the plasma actuator was determined by boundary-layer measurements, using a control volume analysis. Boundary-layer profiles are shown in Fig. 7 for plasma on/off and for two different spanwise locations (electrodes widths) of the wedge-shaped actuator. In each, three boundary-layer profiles are shown. The first is a theoretical profile based on the Falkner–Skan boundary-layer solution, in which a favorable pressure gradient is present. The second profile is the natural (plasma off) boundary layer that develops along the plate in the wind tunnel. Ideally, the Falkner–Skan theoretical profile and the “off” cases shown would be identical. The differences are the result of establishing the correct parameter for the local pressure gradient, as well as determining the virtual leading edge of the boundary layer. The final profile shown is for the plasma forced at 5 kHz on the wedge-shaped actuator. Figure 7a shows the profiles obtained at a spanwise station where the buried electrode width is 0.003 m, and Fig. 7b shows the profile obtained at a spanwise station where the buried electrode width is 0.0134 m. Therefore, Fig. 7b represents the maximum extent of the plasma (0.0089 m of plasma) for which the electrode width does not affect the volume of air with which the plasma interacts and, thereby, the body force produced. Upon inspection, it is evident that there exists a difference in the amount of momentum added to the flow in the two cases. More important, it supports the determination of an engineering model to predict the distribution of force when compared with the electrode width. Then any desired distribution could be obtained to specifically suit the application of interest. For all the measurements, the freestream velocity was set at approximately 6:5 m=s. To determine how the body force varied with electrode width, similar boundary-layer profiles were measured at the remaining spanwise locations. The body force, normalized to an equivalent force per meter, was then determined using a momentum balance (1). The details can be found in Baughn et al. [20]. In Eq. (1), the shear stress is estimated based on the velocity gradient of the downstream measurements. The value is assumed constant from the downstream edge of the exposed electrode to the end of the control volume. Z� Z� FB � �Fs � �U1 �ud;on � ud;off � dy � 2 �qd;on � qd;off � dy 0
0
(1) Fig. 6 Wedge-shaped plasma actuator used to correlate the extent of the plasma based on light emission.
The results of the body force for both the wedge- and V-shaped actuators are shown in Fig. 8. It should be noted that the wedge-
1372
PORTER ET AL.
Electrode Width = 0.3 cm Falkner Skan Off 5 kHz
6
4
2
4 Velocity (m/s)
Fig. 7
0
6
Constant-Width Insulated Electrodes
For comparison purposes, standard constant-width electrode plasma actuators were tested. The actuators’ width ranged from 0.002 to 0.009 m in 0.001 m increments, resulting in a total of eight individual actuators being tested. As with the wedge- and V-shaped actuators, the span of the actuators was 0.152 m. The measurements were made with a constant input voltage and forcing frequency. For each width, the voltage at the electrodes and the power dissipated was calculated. The applied voltage remained constant for all the widths (Fig. 9a, shown as an amplitude or half of the peak-to-peak value),
5 kHz − wedge 5 kHz − V shape 10 kHz − V shape
18 16
Force (mN/m)
14 12 10 8 6 4 2 0
0
0.2
0.4
0.6
2
4 Velocity (m/s)
6
b) Boundary-layer profiles, plasma extent: a) 0.003 m, and b) 0.0089 m
shaped actuator was completely tested before the V-shaped actuator. In testing the wedge-shaped actuator, several peculiarities were observed. First, as shown in Fig. 8, at the ends of the actuator, the amount of force is much larger than expected. Second, minus the final point, the amount of force for the wedge-shaped actuator plateaus at the same spanwise location that the extent of the plasma plateaus, again indicating that the amount of force produced by the actuator is directly related to the volume of air that it interacts with. Finally, at the spanwise point where the electrode width reaches 0.006 m, the body force notches down compared with the adjacent locations.
20
4
0 0
a)
C.
6
2
2
0
Falkner Skan Off 5 kHz
8 Height (mm)
Height (mm)
8
Electrode Width = 1.34 cm
10
10
0.8
1
1.2
1.4
Electrode Width (cm)
whereas the power dissipated (Fig. 9b) increased as the electrode width increased. This again indicates that the plasma is interacting with a larger air volume as the electrode width increases, changing the resistance seen by the circuitry and, therefore, increasing the power dissipated. Body force measurements were also made for each electrode width. The resulting body force for each electrode width can be seen in Fig. 10. Comparing these values with those obtained for the wedge- and V-shaped actuators shows the same general trends in that both increase as the electrode width increases and both have a maximum value of approximately 6 mN (excluding the endpoints). One difference seen in the two is the rate at which the force increases as the electrode width increases, which is a result of the interaction of the spatial variation in force for the wedge- and V-shaped actuators that is not present for the constant-width actuators. D.
E. Fig. 8 Calculated body force at different spanwise locations (buried electrode widths).
Spatially Distributed Plasma Synthetic Jet
As shown in simulations by Kim and Choi [10], creating a spatially distributed jet normal to the surface can result in significant drag reduction for a bluff body in a crossflow. By using the results obtained earlier with the results of Sherman [39], Santhanakrishnan et al. [37], Santhanakrishnan and Jacob [38,40,41], and Bolitho and Jacob [36], who created jets normal to the surface with plasmas, a spatially varying force normal to the surface can be created. Figure 11a shows PIV data normal to the surface in the center plane of two V-shaped plasma actuators, for which the top view in operation is also shown in Fig. 11a. For the results shown, the span of the actuators was limited to 0.23 m. In the areas in which both actuators are creating the largest volume of plasma, the induced vertical momentum is the greatest, producing the spatial distribution. Two distinguishable jets are formed, resulting in a wavelength of 0.074 m, which is smaller than the 0.114 m wavelength precut into the insulated electrode. Further data were then taken to determine the smallest wavelength achievable within the given span. It was found that creating a binary plasma synthetic jet, with step changes in buried electrode width, allowed a closer spacing, as well as a more defined individual jet. The minimum wavelength achievable was 0.06 m. This was created by fully limiting the plasma such that there was just enough electrode to connect the areas in which the plasma was not limited. This setup and the corresponding PIV data can be seen in Fig. 11b. By using the digital plasma synthetic jet, the wavelength can be reduced because individual jets are created. This also results in the creation of vorticity in between the jets, which the triangular jets did not create. The corresponding vorticity of each synthetic jet can be found in Fig. 12, oriented in the same manner as Fig. 11. Thrust Vectoring Using a Plasma Synthetic Jet
Although creating a spatially distributed plasma synthetic jet has many potential applications, to date the plasma has been limited to adding momentum tangential or normal to the dielectric. However,
1373
PORTER ET AL.
10.5
40
Power Dissipated (W)
Voltage (kV)
10.4 10.3 10.2 10.1 10
0
0.2
0.4
0.6
0.8
35
30
25
20
1
0
0.2
Insulated Electrode Width (cm)
0.4
0.6
0.8
1
Insulated Electrode Width (cm)
a)
b)
Fig. 9 Shown are the following: a) corresponding voltage amplitude (in kilovolts) for the different buried electrode widths, and b) power dissipated (in watts) for the different buried electrode widths.
10
Force (mN/m)
8
6
4
2
0
0
0.2
0.4
0.6
0.8
1
Insulated electrode width (cm)
Fig. 10 Individual constant-width insulated electrode force measurements.
by changing the voltage applied to one of the exposed electrodes in jets such as those in Fig. 5 (in which constant-width electrodes are used), the amount of force that one of the plasma actuators creates differs from the other actuator. Therefore, one of the jets provides more momentum to the flow than the other. By controlling the voltage differential between the two exposed electrodes, the angle of the jet can be controlled. As an initial investigation, the voltage differential of each exposed electrode was varied between tests, but remained constant during the test, resulting in a steady jet at some angle from the surface. Figures 13a–13i show the individual test in which the voltage was altered as a means of thrust vectoring. Note that, in each of these, a dotted black line is shown. This line represents the angle of the jet, based on a linear fit of the maximum velocity at each height above the surface. Once it was established that varying the voltage could provide the ability to thrust vector (although in a steady fashion), then the plasma should be able to create an oscillating jet or fluidic oscillator capable of oscillating at the maximum frequency in which the fluid can respond based on the convective speed. Therefore, because the plasma can operate at the kilohertz level, the only limit to the oscillation frequency is determined from the maximum velocity that the plasma actuator can induce and the inertia of the fluid in use.
1.5
0.15
1.5
0.1
1
0.15
Height [m]
Height [m]
0.2
2
0.2
1
0.1 0.5
0.05
0.5
0.05
0
0 0
0.05
0.1
Span [m]
0.15
0.2
m/s
0
0
0.05
0.1
0.15
0.2
m/s
Span [m]
a) b) Fig. 11 PIV (velocity magnitude) measurements of the spatially distributed plasma synthetic jets; image plane is between the two plasma actuators, normal to the surface: a) ground electrode cut in a triangular pattern (� � 0:074 m), and b) digital plasma synthetic jet, electrode cut in a square pattern (� � 0:06 m).
1374
PORTER ET AL.
50 0.2
0
0.15
0.1
50
0.15
Height [m]
Height [m]
0.2
0 0.1
−50 0.05
0.05 −100 0
0.05
0.1
0.15
0.2
−50
0
1/s
0
0.05
a)
0.1
0.15
0.2
1/s
Span [m]
Span [m]
b)
Fig. 12 Corresponding vorticity data from the PIV images shown in Fig. 11: a) vorticity plot of the triangular plasma synthetic jet, and b) vorticity plot of the digital plasma synthetic jet.
V. Discussion A.
Body Force Results
To investigate the reduction in body force per unit span that corresponded to an electrode width of �0:006 m, as seen in Fig. 8, the data were first compared with the constant-width data obtained. From the constant-width data (Fig. 10), it appears that there might also be a dip in the force at an electrode width of 0.006 m, although the magnitude of the dip, if present, is much smaller than the corresponding dip in the wedge- and V-shaped data. Initially it was suspected that this might correspond to a localized impedance mismatch or a defect in the glass, which served as the dielectric. Because the plasma circuitry behaves as a resistor–inductor– capacitor circuit, in which the resistance varies in time and is only present during the discharge of the plasma, it was suspected that the amount of air with which the plasma interacts was changing the localized resistance. Therefore, at that specific location, there might be a mismatch in impedance. Another possibility was that a defect in the dielectric at that location might exist, indicating that the localized dielectric constant was higher than at the other locations. However, both these explanations were found to be lacking. For the testing of the V-shaped actuator, a second forcing frequency was used that was twice that of the original frequency. If there were an impedance mismatch, doubling the frequency would change the spanwise location of the mismatch. However, as seen in Fig. 8, even at 10 kHz, there remains a reduction in the amount of force produced at the same electrode width of �0:006 m. Similarly, testing the Vshaped actuator eliminates the likelihood that there was a defect in the glass (dielectric), because the V-shaped actuator was built on a completely different glass specimen. Another possible explanation was the total pressure probe itself, because it is made of stainless steel, which may be coupling with the electrical properties at a width of 0.006 m. This might also explain why no dip is seen in the PIV data. The increase in the amount of force production (momentum addition) seen at the ends of the actuators was also an interesting observation. This effect was much more pronounced in the wedgeshaped actuator as compared with the V-shaped actuator. Multiple test runs were made at both ends, interspersed with tests at other spanwise locations, and the same effects were always observed. Similarly, the natural boundary-layer measurements were always consistent with the theoretical Falkner–Skan solutions. It should be noted here that, at each height, measurements were made with the plasma off. Then the plasma was turned on and the measurement were made before moving to the next height. Speculation as to the cause of this effect include the sharp endpoints created at the ends while cutting the wedge and the V shape [42], as well as the potential of some three-dimensional effects from the shear layer resulting from the increase in momentum caused by the plasma when compared
with the natural boundary layer. If the first of these speculations is correct, it could point to the fact that sharp points could result in an increase in force, which agrees well with the data presented in Abe et al. [42]. The increase at the ends is also probably related to the decrease seen at a width of 0.006 m from some unaccounted threedimensional effects. This is further evident from the fact that PIV measurements never showed a dip in the velocity created by the actuator at an electrode width of 0.006 m (Fig. 11). Note that the wedge- and V-shaped electrodes were formed using a paper cutter to produce as straight an edge as possible with sharp endpoints. The triangular and binary electrodes were cut with scissors, resulting in a more rounded edge. It has been pointed out that there must be a spanwise velocity component introduced by the actuator because the electric field is no longer two dimensional. This could also be contributing to unaccounted three-dimensional effects and flow structures, which might also result in the anomaly seen at an electrode width of 0.006 m. Furthermore, for the distributed plasma synthetic jets, this spanwise velocity component will also create flow structures due to the jets colliding at an angle and the resulting velocity gradient in the spanwise direction. B.
Spatial Distribution
For the various electrode configurations attempted, the waviness ratio provides a means to compare what the plasma actuator can produce with what has been done with fixed models (geometrically) and computationally. To determine the wavelength, the maximum velocity of each jet at a height of 0.05 m above the surface was found and the distance between these peaks was used as the wavelength, as shown in Fig. 14. The case shown in Fig. 14 corresponds to the smallest spatial wavelength achieved during this experimental effort. Note that the wavelength was also extended to as large as 0.203 m and, it is believed, could be extended even further, which would scale better to the spatial distributions presented by Bearman and Owen [5,8] and Kim and Choi [10] for applicable cylinder or chord length scales. Using this same cut of the data, the amplitude of the resulting velocity jet was determined. Table 1 shows the calculated values. The first row in Table 1 corresponds to the data presented in Fig. 14. From the tabulated values, this is also the scenario in which the largest amplitude ratio exists. For the triangular jet data, when four different jets were created, even though a small wavelength was achieved, the amplitude across the span of the actuator changed little in comparison. This is because, instead of having true individual jets, the jets were starting to merge into one another, which results in a lower waviness ratio. For the triangular plasma actuator with three jets, the only noticeable difference from what would be expected is that the wavelength cut into the electrodes did not match the measured wavelength. The problem experienced here is the influence
1375
PORTER ET AL.
0.15
0.1
0.05
0 −0.1
−0.05
0
0.05
m/s
0.2
Y Axis [m]
Y Axis [m]
0.2
1.5 1.4 1.3 1.2 1.1 1 0.9 0.8 0.7 0.6 0.5 0.4 0.3 0.2 0.1 0
0.15
0.1
0.05
0 −0.1
−0.05
∆V = 0.89 kv
∆V = 0.72 kv
0.15
0.1
0.05
0
−0.1
−0.05
0
0.05
m/s
1.5 1.4 1.3 1.2 1.1 1 0.9 0.8 0.7 0.6 0.5 0.4 0.3 0.2 0.1 0
0.2
Y Axis [m]
0.2
Y Axis [m]
m/s
b)
a)
0.15
0.1
0.05
0
−0.1
−0.05
X Axis [m]
0
0.05
m/s
1.5 1.4 1.3 1.2 1.1 1 0.9 0.8 0.7 0.6 0.5 0.4 0.3 0.2 0.1 0
X Axis [m]
∆V = 0.56 kv
∆V = 0.38 kv
d)
0.2
0.15
0.1
0.05
0
−0.1
−0.05
0
0.05
m/s
1.5 1.4 1.3 1.2 1.1 1 0.9 0.8 0.7 0.6 0.5 0.4 0.3 0.2 0.1 0
0.2
Y Axis [m]
c)
Y Axis [m]
0.05
X Axis [m]
X Axis [m]
0.15
0.1
0.05
0 −0.1
−0.05
0
0.05
m/s
1.5 1.4 1.3 1.2 1.1 1 0.9 0.8 0.7 0.6 0.5 0.4 0.3 0.2 0.1 0
X Axis [m]
X Axis [m]
∆V = 0.23 kv
∆V = 0.05 kv
f)
0.2
0.15
0.1
0.05
0
−0.1
−0.05
0
0.05
1.5 1.4 1.3 1.2 1.1 1 0.9 0.8 0.7 0.6 0.5 0.4 0.3 0.2 0.1 0 m/s
0.2
Y Axis [m]
e)
Y Axis [m]
0
1.5 1.4 1.3 1.2 1.1 1 0.9 0.8 0.7 0.6 0.5 0.4 0.3 0.2 0.1 0
0.15
0.1
0.05
0
−0.1
−0.05
0
0.05
X Axis [m]
X Axis [m]
∆V = -0.13 kv
∆V = -0.32 kv
g)
h) 1.5 1.4 1.3 1.2 1.1 1 0.9 0.8 0.7 0.6 0.5 0.4 0.3 0.2 0.1 0
Y Axis [m]
0.2
0.15
0.1
0.05
0
−0.1
−0.05
0
0.05
m/s
X Axis [m]
∆V = -0.50 kv
Fig. 13
i) Thrust vectoring PIV data for voltage differentials (rms) in exposed electrodes.
m/s
1.5 1.4 1.3 1.2 1.1 1 0.9 0.8 0.7 0.6 0.5 0.4 0.3 0.2 0.1 0
1376
PORTER ET AL.
Table 1 Comparison of the prescribed spatial variations and the actual measured spatial variations in a DBD plasma actuator Electrode wavelength (�), m
Calculated wavelength (�), m
Amplitude (W) m=s
Waviness ratio (W=�), 1=s
0.057 0.057 0.076 0.114
0.060 0.056 0.069 0.074
1.25 0.34 0.99 0.32
20.5 6.07 14.35 4.32
Binary plasma jet Triangular plasma jet (4 jets) Triangular plasma jet (3 jets) Triangular plasma jet (2 jets)
of the static air next to the jets, which can also be seen in the final triangular jet setup. Because of the static air next to the jets, the jets tend to pull together, decreasing their measurable wavelength. In general, however, if multiple jets at this spacing were used, only the outer jets would be affected; therefore, the jets in the middle should exhibit the wavelength precut into the electrode. This is the same effect discussed in the Introduction, in which a secondary jet can be used to bend a primary jet, except, in this case, both jets are of equal strength. The main trend to point out here is that, as the spatial 2 Amplitude = 1.25 m/s
Velocity [m/s]
1.5
1
0.5 Wavelength = 0.06 m
0
0.08 0.09 0.1 0.11 0.12 0.13 0.14 0.15 0.16
Span [m]
Fig. 14 Velocity profile of the digital plasma synthetic jet 0.05 m above the surface.
180 160
Angle (deg)
140 120 100 80 60 40 20 0 −1
−0.5
0
0.5
1
Voltage differential (kVrms)
Fig. 15 Angle of the jet created compared with the voltage differential between two different plasma actuators.
wavelength increases, the amplitude change decreases. Therefore, for larger applications, a strong plasma is needed to create the waviness ratio needed to mimic the results obtained geometrically and computationally. C.
Jet Vectoring
To determine the angle of the jet relative to the surface, the maximum velocity at the 149 heights (representing the individual interrogation areas from the PIV data) was found along with the corresponding X location of the maxima. A least-squares linear approximation was then fit to the X and Y locations, and the angle determined from the slope of that line. Figure 15 shows the correlation between the voltage differential between the two exposed electrodes and the resulting angle of the jet. However, as the jet approaches either wall, the jet tends to attach to the wall, due to the Coanda effect. This can be seen in Fig. 15, in which the endpoints tend to provide a larger angle than the voltage differential would suggest. Furthermore, it can be seen in the corresponding velocity data for these jets that there tends to be some curvature in which the weaker plasma still causes the jet to rise from the surface. Past the plasma, the Coanda effect dominates, pulling the jet back down and attaching it to the surface. Note that, by using the plasma actuator and controlling the voltage, a full 180 deg of vectoring is possible. As shown in Fig. 13, the plasma actuator used here can induce a jet with a velocity of approximately 1:5 m=s. Therefore, as a first approximation, the maximum frequency of oscillation in which a distinct jet can be formed can be found dividing the velocity of the jet by a characteristic length, in this case the field of view. Therefore, a 1:5 m=s flow should be able to oscillate over 0.25 m at a rate of approximately 6 Hz. To verify this, the plasma was initially oscillated at 1 Hz, and then the frequency of oscillation was slowly increased until a distinct jet could no longer be seen. The signal to create the plasma consists of a 5 kHz carrier frequency with a 1 Hz modulating frequency imposed on it. The maximum root mean square voltage differential between the two electrodes at any given time was 1.41 kV with a mean voltage of 6:7 kVrms . To gauge the plasma’s ability to create an oscillating jet, the spatial rms fluctuations based on the magnitude of the velocity were calculated. Figure 16 shows two different rms graphs corresponding to a 1 and 5 Hz oscillating jet, respectively. If an identical voltage modulation scheme is used, but the modulating frequency is increased, the rms fluctuations should then decrease, as the fluid is no longer able to respond to the change in the force direction, resulting in the spreading of the jet. Note that the extent of the fluctuations at
0.5
0.5
0.45
0.2
0.45
0.2
0.4
0.4
0.15
0.3 0.25
0.1
0.2
0.35
Height [m]
Height [m]
0.35 0.15
0.3 0.25
0.1
0.2
0.15 0.05
0.1
0.15 0.05
0.1
0.05 0
−0.1
−0.05
0
0.05
Streamwise Direction [m]
0.1
0 m/s
0.05 0
−0.1
−0.05
0
0.05
0.1
0 m/s
Streamwise Direction [m]
Fig. 16 Fluctuation in rms of the velocity magnitude from the oscillating plasma synthetic jet: a) modulating frequency of 1 Hz driving the rate of oscillation, and b) oscillating frequency of 5 Hz, which is approaching the maximum rate of oscillation for the velocity created from the actuator.
1377
PORTER ET AL.
the higher frequency is limited to an area directly above the plasma actuators, whereas, at the lower oscillating frequency, the extent of the fluctuations all but fills up the field of view. Therefore, the rate of oscillation, in which a distinct jet can be formed, is limited to the velocity that the plasma actuator can induce. However, because the plasma is electronically controlled and operates at radio frequencies, any oscillation rate less than the forcing frequency can be used. Using a frequency of oscillation greater than the convective speed divided by the characteristic length results in the spreading of the jet.
VI.
Conclusions
In this effort, experimental results indicate that the geometry of the buried electrode dictates the body force produced at a given spanwise location on the plasma actuator. A wedge-shaped buried electrode produces a linearly varying body force until plasma saturation occurs due to limited maximum input voltage. The plasma at the ends of the actuator may produce 3-D effects from both the 3-D electric field and the shear from a difference in velocity along the span of the actuator. Because of the way the ends were cut, sharp points were prevalent, resulting in a localized increase in the electric field such as that described by Abe et al. [42] using mesh electrodes instead of the standard copper tape electrodes. This can be seen in the electrostatic equations in which the gradient of the electric potential must equal the electric field. It was also found that a decrease in force by the plasma actuator was always found when the width of the buried electrode was 0.006 m. This cannot currently be explained, but two possibilities have been ruled out. The first possibility is that there was a defect in the dielectric used. However, because both the wedge- and V-shaped actuators saw a decrease, this is most likely not the case, because each was built on a different substrate. The second possibility that can be ruled out is an impedance mismatch. As shown in the V-shaped body force data, two frequencies were tested: 5 and 10 kHz. For both forcing frequencies, the locations of the decrease remained the same, whereas, if this were due to an impedance mismatch, one would expect the location of the decrease in force to change. It is also interesting to note that this decrease is not seen when constant-width buried electrodes are used, at least to the extent seen in the wedge- and V-shaped electrodes. Limiting the amount of plasma interacting with the flow by varying the geometry of the buried electrode solves the difficulty of creating a spatially distributed force. As discussed, this could result in an actuator that has the ability to “introduce a waviness” to an object and take advantage of the reduction in drag and unsteady lift that other researchers have observed either through computational efforts or by changing the geometries of the object of interest. Gregory et al. [12] have applied the spatially distributed plasma actuator to a cylinder in crossflow in an effort to see its effects on an applicable flow, in which a spanwise modulation along the cylinder span can be seen. By changing the amount of body force that one of the plasma actuators creates (when configured in the linear plasma synthetic jet actuator [36–41] configuration), the angle of the jet with respect to the surface can be altered, resulting in jet vectoring capabilities of a full 180 deg. Finally, through voltage amplitude modulation, an oscillating jet can be achieved in which the jet oscillates in time through a full 180 deg. As noted previously, Bolitho and Jacobs [18] have also independently developed a similar technique by altering the duty cycle to achieve the ability to jet vector. Both the ability to modulate the angle of the jet created and the spatial variation dictated from the electrode geometry result in an actuator that has no moving parts with a spatial resolution that would otherwise require multiple actuators working together.
Acknowledgments The authors acknowledge the support of the U.S. Air Force Office of Scientific Research, Air Force Research Laboratories, and Rhett Jefferies. The authors greatly appreciate the help of cadet John Tekell and his assistance in gathering and analyzing the data collected for a research project at the U.S. Air Force Academy. The authors also
appreciate all the assistance of James Gregory, the teacher and mentor of the cadets for this research project. Their participation was vital to the success of the project.
References [1] Gad-el-Hak, M., Flow Control: Passive, Active and Reactive Flow Management, Cambridge Univ. Press, Cambridge, England, U.K., 2000. [2] Joslin, R. D., Thomas, R. H., and Choudhari, M. M., “Synergism of Flow and Noise Control Technologies,” Progress in Aerospace Sciences, Vol. 41, 2005, pp. 363–417. doi:10.1016/j.paerosci.2005.07.002 [3] Fish, F. E., and Lauder, G. V., “Passive and Active Flow Control by Swimming Fishes and Mammals,” Annual Review of Fluid Mechanics, Vol. 38, 2006, pp. 193–224. doi:10.1146/annurev.fluid.38.050304.092201 [4] Darekar, M. R., and Sherwin, J. S., “Flow Past a Square-Section Cylinder with a Wavy Stagnation Face,” Journal of Fluid Mechanics, Vol. 426, 2001, pp. 263–295. doi:10.1017/S0022112000002299 [5] Bearman, W. P., and Owen, C. J., “Reduction of Bluff Body Drag and Suppression of Vortex Shedding by the Introduction of Wavy Separation Lines,” Journal of Fluids and Structures, Vol. 12, 1998, pp. 123–130. doi:10.1006/jfls.1997.0128 [6] Ahmed, A., and Byram, B., “Traverse Flow over a Wavy Cylinder,” Physics of Fluids A, Vol. 4, 1992, pp. 1959–1967. doi:10.1063/1.858365 [7] Lam, K., Wang, H. F., Li, Y. J., and So, C. M. R., “Experimental Investigation of the Mean and Fluctuating Forces of Wavy (Varicose) Cylinders in a Cross Flow,” Journal of Fluids and Structures, Vol. 19, 2004, pp. 321–334. doi:10.1016/j.jfluidstructs.2003.12.010 [8] Bearman, W. P., and Owen, C. J., “Flow Past a Square-Section Cylinder with a Wavy Stagnation Face,” Journal of Fluid Mechanics, Vol. 426, 2001, pp. 263–295. doi:10.1017/S0022112000002299 [9] Cai, J., Chng, T. L., and Tsai, H. M., “Numerical Study of a Vortical Flows Shedding from a Bluff Body with a Wavy Trailing Edge,” AIAA Paper 2007-131, Jan. 2007. [10] Kim, J., and Choi, H., “Distributed Forcing of Flow over a Circular Cylinder,” Physics of Fluids, Vol. 17, No. 3, 2005, pp. 033103-1– 033103-16. [11] Sung, J. H., and Chun, S., “Effect of Spanwise-Varying Local Forcing on Turbulent Separated Flow over a Backward-Facing Step,” Experiments in Fluids, Vol. 26, 1999, pp. 437–440.doi:10.1007/ s003480050307 [12] Gregory, J. W., Porter, C. O., and McLaughlin, T. E., “Circular Cylinder Wake Control Using Spatially Distributed Plasma Forcing,” AIAA Paper 2008-4198, June 2008. [13] Smith, B. L., and Glezer, A., “Jet Vectoring Using Synthetic Jets,” Journal of Fluid Mechanics, Vol. 458, 2002, pp. 1–34.doi:10.1017/ S0022112001007406 [14] Gregory, J. W., Ruotolo, J. C., Byerley, A. R., and McLaughlin, T. E., “Switching Behavior of a Plasma Fluidic Actuator,” AIAA Paper 2007785, Jan. 2007. [15] Viets, H., “Flip-Flop Jet Nozzle,” AIAA Journal, Vol. 13, No. 10, Oct. 1975, pp. 1375–1379.doi:10.2514/3.60550 [16] Raman, G., and Cornelius, D., “Jet Mixing Control Using Excitation From Miniature Oscillating Jets,” AIAA Journal, Vol. 33, 1995, pp. 365–368. doi:10.2514/3.12444 [17] Smith, B. L., Trautman, M. A., and Glezer, A., “Controlled Interactions of Adjacent Synthetic Jets,” AIAA Paper 99-0669, 1999. [18] Bolitho, M., and Jacobs, J., “Thrust Vectoring Flow Control Using Plasma Synthetic Jet Actuators,” AIAA Paper 2008-1429, Jan. 2008. [19] Enloe, C. L., McLaughlin, T. E., VanDyken, R. D., Kachner, K. D., Jumper, E. J., Corke, T. C., Post, M., and Haddad, O., “Mechanisms and Responses of a Single Dielectric Barrier Plasma Actuator: Geometric Effects,” AIAA Journal, Vol. 42, No. 3, 2004, pp. 595–604. doi:10.2514/1.3884 [20] Baughn, J. W., Porter, C., Peterson, B., McLaughlin, T., Enloe, L., Font, G., and Baird, C., “Momentum Transfer for an Aerodynamic Plasma Actuator with an Imposed Boundary Layer,” AIAA Paper 2006-168, Jan. 2006. [21] Porter, C., Baughn, J., McLaughlin, T., Enloe, L., and Font, G., “Plasma Actuator Force Measurements,” AIAA Journal, Vol. 45, No. 7, 2007,
1378
PORTER ET AL.
pp. 1562–1570.doi:10.2514/1.24497 [22] Porter, C., McLaughlin, T., Enloe, L., Font, G., and Baughn, J., “Boundary Layer Control Using a DBD Plasma Actuator,” AIAA Paper 2007-786, Jan. 2007. [23] Jacob, J., Rivir, R., and Carter, C., “Boundary Layer Flow Control Using AC Discharge Plasma Actuators,” AIAA Paper 2004-2128, July 2004. [24] Forte, M., Jolibois, J., Moreau, M., and Touchard, G., “Optimization of a Dielectric Discharge Actuator by Stationary and Non-Stationary Measurements of the Induced Flow Velocity—Application to Airfoil Flow Control,” AIAA Paper 2006-2863, June, 2006. [25] Balcer, B. E., Franke, M. E., and Rivir, R. B., “Effects of Plasma Induced Velocity on Boundary Layer Flow,” AIAA Paper 2006-875, Jan. 2006. [26] Visbal, M. R., Gaitonde, D. V., and Roy, S., “Control of Transitional and Turbulent Flows Using Plasma-Based Actuators,” AIAA Paper 2006-3230, June 2006. [27] Seraudie, A., Aubert, E., Naude, N., and Cambronne, J. P., “Effect of Plasma Actuators on a Flat Plate Laminar Boundary Layer in Subsonic Conditions,” AIAA Paper 2006-3350, June 2006. [28] Post, M. L., and Corke, T. C., “Separation Control of High Angle of Attack Airfoil Using Plasma Actuators,” AIAA Paper 2003-1024, Jan. 2003. [29] Post, M. L., and Corke, T., “Flow Control with a Single Dielectric Barrier Plasma Actuator,” AIAA Paper 2005-4630, June 2005. [30] Göksel, B., Greenblatt, D., Rechenberg, I., Nayeri, C. N., and Paschereit, C. O., “Steady and Unsteady Plasma Wall Jets for Separation and Circulation Control,” AIAA Paper 2006-3686, June 2006. [31] List, J., Byerley, A. R., McLaughlin, T. E., and Van Dyken, R., “Using Plasma Actuators Flaps to Control Laminar Separation on Turbine Blades in a Linear Cascade,” AIAA Paper 2003-1026, Jan. 2003. [32] Huang, J., Corke, T. C., and Thomas, F. O., “Plasma Actuators for
[33] [34] [35] [36] [37] [38] [39]
[40] [41] [42]
Separation Control of Low Pressure Turbine Blades,” AIAA Paper 2003-1027, 2003. McLaughlin, T. E., Felker, B., Avery, J. C., and Enloe, C. L., “Further Experiments in Cylinder Wake Modification with Dielectric Barrier Discharge Forcing,” AIAA Paper 2006-1409, Jan. 2006. McLaughlin, T. E., Munska, M. D., Vaeth, J. P., Dauwalter, T. E., Goode, J. R., and Siegel, S. G., “Plasma-Based Actuators for Cylinder Wake Vortex Control,” AIAA Paper 2004-2129, July 2004. Van Dyken, R., McLaughlin, T. E., and Enloe, C. L., “Parametric Investigation of a Single Dielectric Barrier Plasma Actuator,” AIAA Paper 2004-846, Jan. 2004. Bolitho, M., and Jacob, J., “Use of Aggregate Plasma Synthetic Jet Actuators for Flow Control,” AIAA Paper 2007-637, Jan. 2007. Santhanakrishnan, A., Jacob, J., and Suzen, Y., “Flow Control Using Plasma Actuators and Linear/Annular Plasma Synthetic Jet Actuators,” AIAA Paper 2006-3033, June 2006. Santhanakrishnan, A., and Jacob, J., “On Plasma Synthetic Jet Actuators,” AIAA Paper 2006-317, Jan. 2006. Sherman, D. M., “Manipulating Aerodynamic Boundary Layers Using an Electrohydrodynamic Effect Generated by a One Atmosphere Uniform Glow Discharge Plasma,” M.S. Thesis, Univ. of Tennessee, Knoxville, TN, Aug. 1998. Santhanakrishnan, A., and Jacob, J., “Formation and Scaling of Plasma Synthetic Jet Actuators,” AIAA Paper 2007-940, Jan. 2007. Santhanakrishnan, A., and Jacob, J., “Effect of Plasma Morphology on Flow Control Using Plasma Synthetic Jet Actuators,” AIAA Paper 2007-783, Jan. 2007. Abe, T., Takizawa, Y., Sato, S., and Kimura, N., “A Parametric Experimental Study for Momentum Transfer by Plasma Actuator,” AIAA Paper 2007-187, Jan. 2007.
E. Gutmark Associate Editor