792861 research-article2018
EHI0010.1177/1178630218792861Environmental Health InsightsGorai et al
Spatio-Temporal Variation of Particulate Matter(PM2.5) Concentrations and Its Health Impacts in a Mega City, Delhi in India
Environmental Health Insights Volume 12: 1–9 © The Author(s) 2018 Article reuse guidelines: sagepub.com/journals-permissions DOI: 10.1177/1178630218792861 https://doi.org/10.1177/1178630218792861
Amit Kumar Gorai1, Paul B Tchounwou2, SS Biswal1 and Francis Tuluri3 1Department
of Mining Engineering, National Institute of Technology Rourkela, Rourkela, India. RCMI Center for Environmental Health, College of Science, Engineering and Technology, Jackson State University, Jackson, MS, USA. 3Department of Industrial Systems and Technology, Jackson State University, Jackson, MS, USA. 2NIH/NIMHD
ABSTRACT: Rising concentration of air pollution and its associated health effects is rapidly increasing in India, and Delhi, being the capital city, has drawn our attention in recent years. This study was designed to analyze the spatial and temporal variations of particulate matter (PM2.5) concentrations in a mega city, Delhi. The daily PM2.5 concentrations monitored by the Central Pollution Control Board (CPCB), New Delhi during November 2016 to October 2017 in different locations distributed in the region of the study were used for the analysis. The descriptive statistics indicate that the spatial mean of monthly average PM2.5 concentrations ranged from 45.92 μg m−3 to 278.77 μg m−3. The maximum and minimum spatial variance observed in the months of March and September, respectively. The study also analyzed the PM2.5 air quality index (PM2.5—Air Quality Index (AQI)) for assessing the health impacts in the study area. The AQI value was determined according to the U.S. Environmental Protection Agency (EPA) system. The result suggests that most of the area had the moderate to very unhealthy category of PM2.5-AQI and that leads to severe breathing discomfort for people residing in the area. It was observed that the air quality level was worst during winter months (October to January). Keywords: Particulate matter (PM2.5), inverse distance weight, AQI mapping, health effect RECEIVED: April 4, 2018. ACCEPTED: July 11, 2018. Type: Original Research
Declaration of conflicting interests: The author(s) declared no potential conflicts of interest with respect to the research, authorship, and/or publication of this article.
Funding: The author(s) disclosed receipt of the following financial support for the research, authorship, and/or publication of this article: The partial support from the National Institutes of Health NIMHD (grant no. G12MD007581) through the RCMI Center for Environmental Health at Jackson State University is also acknowledged.
CORRESPONDING AUTHOR: Paul B Tchounwou, NIH/NIMHD RCMI Center for Environmental Health, College of Science, Engineering and Technology, Jackson State University, Jackson, MS 39217, USA. Email:
[email protected]
Introduction
model was developed for analyzing the effect of air pollutants on all natural causes of mortality in Delhi. The study revealed that the health burden is associated with local air quality in Delhi.7 Liu et al8 analyzed the seasonal impact of regional outdoor biomass burning on air pollution in three Indian cities viz. Delhi, Bengaluru, and Pune using HYSPLIT model. The study results suggested that outdoor fires are not the dominant air pollution source in India throughout the year, but postmonsoon fires contribute substantially to high air pollution exposure levels around Delhi.8 Pant et al9 proposed a review study to determine the exposure to PM in India for future action. The most common ambient air pollutants encountered in our daily life are PM, sulfur dioxide (SO2), nitrogen dioxide (NO2), ozone (O3), carbon monoxide (CO), and carbon dioxide (CO2).1 Although a number of air pollutants (PM, nitrogen dioxides, sulfur dioxide, carbon monoxide, ozone, lead, etc.) are listed as criteria pollutants in most of the country’s air quality standards, this study considers PM2.5 for analyzing the spatial variations and its health impacts due to limitations of data availability and accessibility. Particulate matter is often implicated as the most significant predictor of the health outcomes among the air pollutants in most of the studies. However, PM is a chemically non-specific pollutant and may originate or be derived from various emission source types. Thus, its degree of
Clean air is one of the basic requirements of human health and well-being. However, during the process of economic development, air pollution has been and continues to be a significant health hazard worldwide. The driving forces of air pollution include economic development, urbanization, energy consumption, transportation, and motorization.1 In recent times, air pollution problem is one of the biggest issue in most of the developed and developing countries.2-4 According to World Health Organization (WHO), Delhi, the capital of India, topped among the list of most-polluted cities and thus the public has focused its attention on the issue and the government has responded with ever-stronger measures.5 In the last few years, many studies have been conducted by different research groups on the air quality issues in Delhi. Panda et al6 conducted a study for analyzing the effect of meteorology, long-range transport, boundary layer, and anthropogenic activities on the chemical composition of particulate matter (PM2.5) in Delhi and Bhubaneswar. The results revealed that PM2.5 mass is dominated by fossil fuel specifically from coal combustion in Bhubaneswar, whereas vehicular exhaust, fossil fuel combustion along with biomass burning and road dust were the main sources of emission in Delhi.6 Maji et al7 studied the short-term effects of criteria air pollutants (PM10, SO2, NO2, CO and O3) on daily mortality in Delhi, India. A time-series
Creative Commons Non Commercial CC BY-NC: This article is distributed under the terms of the Creative Commons Attribution-NonCommercial 4.0 License (http://www.creativecommons.org/licenses/by-nc/4.0/) which permits non-commercial use, reproduction and distribution of the work without further permission provided the original work is attributed as specified on the SAGE and Open Access pages (https://us.sagepub.com/en-us/nam/open-access-at-sage).
2
Environmental Health Insights
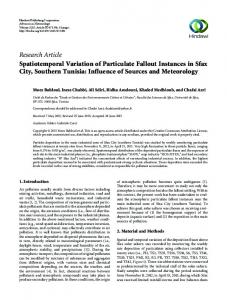
Figure 1. Study area map.
impact may well vary depending on its source and chemical composition. If the impacts of PM could be determined based on source types, the regulation of PM may be implemented more effectively. Outdoor suspended particulate matter (SPM) is considered to be the most serious pollutant in metropolitan areas, in view of its adverse health effects as a cause of cardiovascular disease, respiratory irritation, and pulmonary dysfunction.5 Many time-series studies have explored the acute health effects associated with short-term exposure to airborne particulates.10 Epidemiological studies have suggested associations of long-term exposure to current air pollution levels and particularly cardio-respiratory health.10,11 Particulate matter is used as an indicator for airborne particulates as there are extensive monitoring data for PM2.5 in most of the developed nations but at the same time the network of PM2.5 monitoring is poorly maintained to obtain the quality and continuous data. Substantial evidence indicate that PM exposure is linked to a variety of adverse effects on mortality (non-accidental allcause mortality, cardiovascular, and respiratory mortality)12 and morbidity (hospital admissions, outpatient and emergency-room visits, asthma attacks, acute respiratory infection of young children, etc.).13-16 The risk for acute events, including myocardial infarction and stroke has been assessed.17 The risk for birth outcomes has also been studied, but the evidence is still inconclusive based on the currently available data.18,19 The major sources of air pollution in Delhi are diesel generators and tandoors in restaurants, public transport, combustion of fuels (coal, liquefied petroleum gas, and wood), and power plants.20 Increased combustion of fossils fuel is mainly responsible for the continuous change in the atmospheric
composition.21 The size of particles is directly linked to their potential for causing health problems. Small particles less than 2.5 μm in diameter pose the greatest problems because they can get deep into your lungs, and some may even get into your bloodstream. Air pollution also causes environmental effects like visibility impairment, environmental damage, and materials damage. The main objective of the proposed study is to analyze the spatial variations of PM2.5 concentrations in a mega city (Delhi) and assessment of health impacts due to exposure to the higher PM2.5 concentrations.
Materials and Methods Study area The air quality in Delhi, the capital of India, according to a WHO survey of 1600 world cities, is the worst of any major city in the world.22 Pollution in Delhi, which spikes during winter, hit almost 30 times the WHO’s safe limits23 in the second week of November 2016, with the concentration of harmful PM2.5 particles topping 700 μg/m3 (micrograms per cubic meter).24 Air pollution in India is estimated to kill 1.5 million people in 2012 and also the fifth largest killer in India.25 India has the world’s highest death rate from chronic respiratory diseases and asthma, according to the WHO reports.25 Delhi (shown in Figure 1) was selected for analyzing the spatio-temporal variations of PM2.5 concentrations. The latitude and longitude of the study area ranges from 28°24′30.46″N to 28°53′4.24″N and 76°49′58.50″S to 77°20′15.86″S, respectively. The state of Delhi is characterized by weather extremes. Both summer and winter are severe with June being the hottest month and January the coldest.26 The annual rainfall is around 700 mm. Maximum rain occurs
Gorai et al
3
Table 1. Air pollution monitoring stations. Station Id
Location
Latitude (N)
Longitude (E)
Landuse type
1
Shadirpur
28°39′12.069″N
77°3′42.057″E
Residential and industrial
2
R K Puram
28°32′25.985″N
77°4′52.68″E
Residential cum commercial
3
IHBAS
28°41′33.315″N
77°16′31.85″E
Residential cum commercial
4
DTU
28°46′51.12″N
77°0′38.436″E
Residential and industrial
5
Dwarka
28°34′18.982″N
76°54′59.444″E
Residential
6
Sirifort
28°31′22.424″N
77°7′49.238″E
Ecologically sensitive
7
Punjabi Bagh
28°40′26.223″N
77°0′24.311″E
Residential cum commercial
8
ITO
28°37′4.947″N
77°10′42.265″E
Residential cum commercial
IHBAS: Institute of Human Behaviour and Allied Sciences; DTU: Delhi Technological University; ITO: Income tax office.
during July to August. The latitudes and longitudes of Delhi range from 28°24′17″ to 28°53′00N and 76°50′24″ and 77°20′37″ E, respectively. The city is 216 m above the mean sea level (MSL). The city is surrounded by other major growth centers of adjoining states such as Haryana and Uttar Pradesh, and thus the geographical location of this city influences the weather conditions of Delhi. Thus, the significant variations in the climate in the specified geographical region may influence the PM2.5 concentrations. The population in Delhi was 16 779 294 in 2011 as per Census-India.27 The population density of National Capital Territory (NCT) of Delhi grew substantially from 1176 to 11 297 people per square kilometer of land area between 1951 and 2011 as per Census-India.27
points closer to the processing cell greater than those further away. The IDW interpolation technique calculates the value for an unknown location using the following equation
Zj =
i
∑
i
Zi
d ij n 1 d ij n
The prediction performance of the model was evaluated using root mean square error (RMSE) value. The RMSE can be determined as
Methods In Delhi’s air quality–monitoring network, continuous data are rarely available for all the monitoring stations for long-term study. Thus, this study considered a specified time period and pollutants based on the availability of continuous data for a limited number of monitoring stations. For analyzing the spatial distribution, the PM2.5 concentrations monitored by the Delhi Pollution Control Committee (DPCC) and Central Pollution Control Board (CPCB), New Delhi at eight sampling locations (shown in Figure 1) distributed in the study area were selected. The latitude and longitude of each monitoring location along with the landuse type are shown in Table 1. Particulate matter concentration monitored during November 2016 to October 2017 was used for this study. The spatial distributions of PM2.5 status was studied in Delhi using geographic information system (GIS) tool. An inverse distance weighting (IDW) interpolation method28 was used to predict the PM2.5 concentrations at unknown points in the study area. The IDW interpolator assumes that each input point has a local influence that diminishes with distance. It weights the
∑
RMSE =
∑
n i =1
( X obs,i − X mo del ,i )2 n
PM2.5 data Particulate matter2.5 data monitored by DPCC, New Delhi’s Air Quality Monitoring Network (AQMN) at eight monitoring stations located in Delhi region for 1 year (November 2016 to October 2017) were used for the study. Daily data of all the PM2.5 concentrations were downloaded from the website of the DPCC, New Delhi’s air quality network system data mart. Particulate matter concentrations have been monitored using the gravimetric sampling method at all the locations. However, the quality control of data has not been reported in the website and not known to the authors. This study used the deterministic approach (IDW method) for spatial analysis of PM2.5 concentrations in Delhi. The IDW method was used for spatial analyses in the area in each of the 12 months. Particulate matter concentrations for each sampling location are summarized in Table 2. The monthly mean of spatial data and annual means of each station are
IHBAS
DTU
Dwarka
Sirifort
Punjabi Bagh
ITO
3
4
5
6
7
8
250.75
242.01
230.84
162.18
290.99
240.81
170.08
180.78
244.29
135.91
206.37
117.79
200.70
143.89
103.37
128.60
264.23
110.20
160.22
81.68
139.52
148.21
77.30
105.65
107.57
120.36
108.14
227.05
129.53
121.91
105.33
62.34
94.15
104.58
104.92
107.81
119.17
145.67
May, 2017
116.05
57.81
55.91
163.59
68.11
67.87
72.29
71.14
June, 2017
67.24
37.42
34.74
55.85
38.42
40.76
41.43
51.50
July, 2017
65.10
38.81
36.44
62.78
40.24
95.86
49.17
60.05
August, 2017
86.78
55.78
54.36
73.60
60.29
73.56
71.33
69.05
147.47
160.45
140.50
165.92
197.00
158.60
176.90
178.23
September, October, 2017 2017
123.01 ± 57.96
122.06 ± 84.09
141.35 ± 104.51
138.35 ± 67.47
147.91 ± 106.15
126.49 ± 73.50
131.03 ± 71.71
131.70 ± 64.32
Annual mean ± SD
118.85 ± 72.2 124.69 ± 44.24 105.5 ± 23.3 84.09 ± 37.13 45.92 ± 11.24 56.06 ± 19.67 68.09 ± 10.84 165.63 ± 18.16
86.85
96.04
85.22
291.54
116.84
61.25
92.99
120.07
January, 2017 February, March, 2017 April, 2017 2017
278.77 ± 63.19 228.27 ± 38.38 174.98 ± 41.87 142 ± 55.6
199.80
298.98
347.96
213.66
383.43
244.83
203.67
204.88
December, 2016
IHBAS: Institute of Human Behaviour and Allied Sciences; DTU: Delhi Technological University; ITO: Income tax office.
Monthly mean ± SD
R K Puram 275.69
2
265.81
Shadirpur
1
November, 2016
Stations
Sl. No.
Table 2. PM2.5 concentrations at various locations from November 2016 to October 2017.
4
Environmental Health Insights
Gorai et al
5 Table 3. RMSE values for each month.
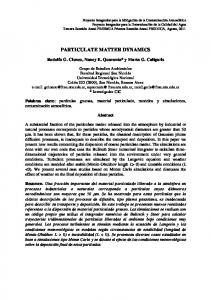
Figure 2. Monthly average concentrations of PM2.5 at different monitoring stations.
also shown in Table 2. The results indicate that the monthly mean PM2.5 concentrations of eight locations varied from 45.92 ± 11.24 μg m−3 in July 17 to 278.77 ± 63.19 μg m−3 in November 16 during the study period. The higher value of standard deviation indicates that the spatial variations of PM2.5 concentrations are significant, and thus the mapping is very useful for assessing the health impacts. The annual mean PM2.5 concentrations were found to be 131.70 ± 64.32, 131.03 ± 71.71, 126.49 ± 73.50, 147.91 ± 106.15, 138.35 ± 67.47, 141.35 ± 104.51, 122.06 ± 84.09, and 123.01 ± 57.96 μg m−3, respectively for monitoring station 1 to 8. Thus, the lowest annual mean was observed at Punjabi Bagh, whereas the highest was observed at Delhi Technological University (DTU). The monthly mean of spatial data of eight stations are also shown in Figure 2. The results (shown in Figure 2) suggest that the monthly spatial mean values of PM2.5 concentrations exhibit a decreasing trend from November 16 to July 17, and an increasing trend from September 17 to October 17. That is, the concentrations were relatively higher in winter months compared to summer and monsoon months.
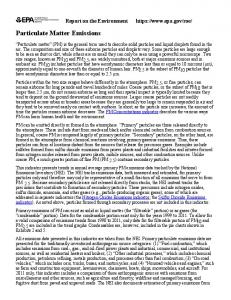
Results and Discussion Spatial analysis This study examined IDW method for prediction of PM2.5 concentrations at the un-sampled locations in the study area. The performances of the fitted models were examined based on the RMSE values (shown in Table 3). The RMSE values seem to be high. This may be due to less number of sampling locations. However, the predictions can be used for estimating the PM2.5 exposure level. The spatial distribution maps were derived using the IDW model for each month during the study period. The analysis was done using Geostatistical Analyst module of ArcGIS software, version 10.3. The spatial distributions of PM2.5 concentrations are presented for each month in Figure 3. The monthly spatial maps (shown in Figure 3) indicate that the spatial distributions of PM2.5 concentrations do not have uniform patterns with month. However, the spatial patterns were found to be uniform in few months due to uniform influences of meterological
Month
RMSE Error
November, 2016
66.69
December, 2016
39.29
January, 2017
39.72
February, 2017
60.26
March, 2017
69.79
April, 2017
48.82
May, 2017
28.37
June, 2017
40.07
July, 2017
12.57
August, 2017
18.11
September, 2017
11.82
October, 2017
19.46
factors (wind speed [WS], temperature, and precipitation; shown in Figure 3) with the assumptions of constant emission factors. It is also obvious from Figure 3 that the monthly mean of PM2.5 concentrations exceeded the 24-h average standard (40 μg/m3)29 and annual average standard (60 μg/ m3)29 concentrations in the entire study area in each month except in July and August. The influences of local meterological factors such as WS, temperature, and precipitation may be reason for the observed distribution patterns. The correlation analyses of PM2.5 concentration with three meterological factors (temperature, precipitation, and WS) were conducted to understand the role of meteorological factors on the concentration level of PM2.5. The monthly average meterological data during the same period (November 2016 to October 2017) was retrived from online sources (https:// www.weatheronline.in/weather/maps/city?). These are represented in Figure 4. The correlation analyses results (shown in Table 4) indicated that PM2.5 had significant negative correlations with WS and precipitations. To understand the actual reason of the observed pattern, region-wise emission sources need to be studied.
PM2.5-air quality index maps for estimation of health impacts The Air Quality Index (AQI) is an indicator for reporting daily air quality. It tells how clean or unhealthy the air is and provides recommendation for populations that may be sensitive to excess pollution. During the last two decades, a number of AQI determination methods have been developed worldwide.30 This study uses the U.S. Environmental Protection Agency’s (EPA) AQI system for determining the AQI. The PM2.5-AQI was determined as
6
Environmental Health Insights
Figure 3. Spatial distributions of PM2.5 concentrations during November 2016 to October 2017.
Figure 4. Meterological data vs PM2.5 concentrations.
Ip =
( I HI − I LO )
BPHI − BPLO
(CP − BPLO ) + I LO
where Ip represents the Index for PM2.5, Cp is the rounded concentration of PM2.5, BPHI is the breakpoint that is greater than or equal to Cp, BPLO is the breakpoint that is
less than or equal to Cp, IHI is the PM2.5-AQI value corresponding to BPHI, and ILO is the PM2.5-AQI value corresponding to BPLO. The breakpoints for PM2.5 concentrations along with the ranges of various PM2.5-AQI category and the possible health consequences are reported in Table 5. These breakpoints (shown
Gorai et al
7
Table 4. Correlation analysis results. PM2.5
WS
Precipitation
Temperature
PM2.5
1
WS
–0.713**
1
Precipitation
–0.751**
0.547
1
Temperature
–0.727**
0.502
0.622*
1
PM: particulate matter; WS: wind speed. *Correlation is significant at the 0.05 level (two-tailed). **Correlation is significant at the 0.01 level (two-tailed).
Table 5. Breakpoint concentration of air pollutants defined in U.S. EPA (1999) system. Breakpoints
AQI
Category
Health impacts
Good
Air quality is satisfactory and poses little or no health risk
Moderate
People who are unusually sensitive to ozone or particle pollution may experience respiratory symptoms
PM2.5 (µg/m3)
0-15.4
0-50
15.5-40.4
51-100
40.5-65.4
101-150
Unhealthy for sensitive groups (USG)
People with heart or lung disease, older adults, and children are considered sensitive and therefore at greater risk
65.5-150.4
151-200
Unhealthy
Members of sensitive groups may experience more serious health effects
150.5-250.4
201-300
Very unhealthy
Everyone may experience more serious health effects
250.5-350.4
301-400
Hazardous
The entire population is even more likely to be affected by serious health effect
350.5-500.4
401-500
Hazardous
The entire population is even more likely to be affected by serious health effect
PM2.5: particulate matter less than 2.5 μm; AQI: air quality index.
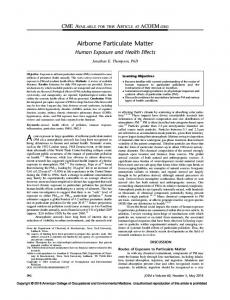
in Table 5) were used to determine the PM2.5-AQI values using the above equation. The values of IHI, ILO, BPHI, and BPLO were taken from the Table 5, and the Cp was taken from the observed data to calculate the PM2.5-AQI. The probable health impact of a particular region was estimated based on the observed category of PM2.5-AQI. The PM2.5-AQI values were calculated for each of the monitoring locations in the GIS database. As the breakpoints are defined only for 24-h average concentration, it was assumed that the monthly average of 24-h daily monitored values represents the 24-h average values. The PM2.5-AQI maps were generated using the same interpolation method (IDW ) as explained above. The maps are shown in Figure 5, which indicate that the spatial distributions of PM2.5-AQI have uniformity patterns in part of the study regions during a particular season. The results (shown in Figure 5) indicate that the AQI of PM2.5 in the region is not under “Good category” in any of the month during November 16 to October 2017. The PM2.5-AQI maps indicate that AQI values range from “Unhealthy” to “Hazardous” category in most of the places in each month except in July to September. In the month of July 2017 and August 2017, part of the region showed the Moderate category of AQI. The population
density in Delhi is 11 297 people per square kilometer, and the entire region shows a higher air pollution exposure level than the permissible level throughout the year. Thus, a huge air pollution–related health burden exists in Delhi.
Conclusion
This study analyzed the temporal and spatial variations of PM2.5 concentrations in Delhi, India. The mean value of the spatial PM2.5 concentrations was found to be relatively higher in the winter months (October to January) in comparison to that of the summer and monsoon months. The monthly spatial distribution maps of PM2.5 indicate that the PM2.5 concentrations do not show uniform patterns. However, the spatial patterns were found to be uniform in few months due to uniform influences of local meterological factors such as WS, temperature, and precipitation. Hence, the correlation coefficients of these parameters and PM2.5 were found to be higher and significant. The vulnerable zone or area of highest concentrations was generally found in most of the regions of the study area during winter seasons. The results of AQI maps indicate that AQI values range from Unhealthy to Hazardous category in most of the places in each month except from July to September. In the month of July and August, few areas
8
Environmental Health Insights
Figure 5. PM2.5-AQI maps for each month.
showed the Moderate category of AQI. Thus, the entire population residing in Delhi is more likely to be affected by serious health effect. As the dispersion of PM2.5 depends on the atmospheric conditions and it cannot be changed and thus it is essential to reduce the vehicular emission (identified as major air pollution sources in Delhi in most of past research) by facilitating better public transport system.
Acknowledgement
The authors are thankful to the Central Pollution Control Board, New Delhi for making air pollution data available on the website for public use.
Author Contributions
AKG conceived and designed the experiments. SSB analyzed the data and wrote the first draft of the manuscript. AKG, PBT
and FT contributed to the writing of the manuscript and given critical comments on the draft manuscript. All authors agree with manuscript results and conclusions, reviewed and approved the final manuscript. References
1. Chen B, Kan H. Air pollution and population health: a global challenge. Environ Health Prev Med. 2008;13:94–101. 2. Molina MJ, Molina LT. Megacities and atmospheric pollution. J Air Waste Manage Assoc. 2004;54:644–680. 3. Sikder HA, Nasiruddin M, Suthawaree J, Kato S, Kajii Y. Long term observation of surface O3 and its precursors in Dhaka, Bangladesh. Atmospher Res. 2013; 122:378–390. 4. Al-Harbi M. Assessment of air quality in two different urban localities. Int J Environ Res. 2014;8:15–26. 5. Dodge E. How to pinpoint Delhi’s air-pollution sources. http://www.indiaspend.com/cover-story/how-to-pinpoint-delhis-air-pollution-sources-45985. Updated January 20, 2016. Accessed July 1, 2017.
Gorai et al 6. Panda S, Sharma S K, Mahapatra PS, et al. Organic and elemental carbon variation in PM2.5 over megacity Delhi and Bhubaneswar, a semi-urban coastal site in India. Nat Hazards. 2016;80:1709–1728. 7. Maji S, Ahmed S, Siddiqui WA, Ghosh S. Short term effects of criteria air poll utants on daily mortality in Delhi, India. Atmospher Environ. 2017;150:210–219. 8. Liu T, Marlier ME, DeFries RS, et al. Seasonal impact of regional outdoor biomass burning on air pollution in three Indian cities: Delhi, Bengaluru, and Pune. Atmospher Environ. 2018;172:83–92. 9. Pant P, Guttikunda SK, Peltier RE. Exposure to particulate matter in India: a synthesis of findings and future directions. Environ Res. 2016;147:480–496. 10. Brunekreef B, Holgate ST.Air pollution and health. Lancet. 2002;360:1233–1242. 11. Rückerl R, Schneider A, Breitner S, Cyrys J, Peters A. Health effects of particulate air pollution: a review of epidemiological evidence. Inhalat Toxicol. 2011;23: 555–592. 12. Schwartz J, Dockery DW, Neas LM. Is daily mortality associated specifically with fine particles? J Air Waste Manage Assoc. 1996;46:927–939. 13. Samoli E, Analitis A, Touloumi G, et al. Estimating the exposure-response relationships between particulate matter and mortality within the APHEA multicity project. Environ Health Perspect. 2005;113:88–95. 14. Ostro B, Broadwin R, Green S, Feng WY, Lipsett M. Fine particulate air pollution and mortality in nine California counties: results from CALFINE. Environ Health Perspect. 2006;114:29–33. 15. Lewis TC, Robins TG, Dvonch JT, et al. Air pollution-associated changes in lung function among asthmatic children in Detroit. Environ Health Perspect. 2005;113:1068–1075. 16. Xing Y-F, Xu Y-H, Shi M-H, Lian Y-X. The impact of PM 2.5 on the human respiratory system. J Thoracic Dis. 2016;8: E69–E74. 17. Peters A, Dockery DW, Muller JE, Mittleman MA. Increased particulate air pollution and the triggering of myocardial infarction. Circulation. 2001;103: 2810–2815. 18. Leem JH, Kaplan BM, Shim YK, et al. Exposures to air pollutants during pregnancy and preterm delivery. Environ Health Perspect. 2006;114:905. 19. Maisonet M, Correa A, Misra D, Jaakkola JJ. A review of the literature on the effects of ambient air pollution on fetal growth. Environ Res. 2004;95:106–115.
9 2 0. Sharma M, Dikshit O. Final Report on Comprehensive Study on Air Pollution and Green House Gases (GHGs) in Delhi. New Delhi, India: Department of Environment Government of National Capital Territory of Delhi and Delhi Pollution Control Committee; 2016. 21. Hassan IA, Basahi JM, Ismail IM, Habeebullah TM. Spatial distribution and temporal variation in ambient ozone and its associated NOx in the atmosphere of Jeddah City, Saudi Arabia. Aerosol Air Qual Res. 2013;13:1712–1722. 22. World Health Organization (WHO). Report on ambient (outdoor) air pollution in cities database 2014. Geneva, Switzerland: WHO; 2014. 23. World Health Organization (WHO) and Occupational and Environmental Health Team (2006). Air Quality Guidelines for Particulate Matter, Ozone, Nitrogen Dioxide and Sulfur Dioxide: Global Update 2005 (Summary of risk assessment). Geneva, Switzerland: World Health Organization. http://www.who.int/iris/ handle/10665/69477. Accessed May 19, 2018. 24. Smith O. Is Delhi the most polluted city on Earth? Not quite. The Telegraph, 2017. https://www.telegraph.co.uk/travel/destinations/asia/india/articles/delhimost-polluted-city-in-the-world/. Accessed May 19, 2018. 25. World Health Organization (WHO). Ambient air pollution: a global assessment of exposure and burden of disease, 2016. http://apps.who.int/iris/bitstream/han dle/10665/250141/9789241511353-eng.pdf;jsessionid=4D1825A13BA53ECA4 7A406E3C8317D50?sequence=1. Accessed August 2, 2017. 26. Central Pollution Control Board (CPCB). Air quality monitoring, emission inventory & source apportionment studies for Delhi, 2008. http://cpcb.nic.in/ cpcbold/Delhi.pdf. Accessed July 1, 2018. 27. Census-India. Census of India, 2011. New Delhi, India: The Government of India; 2012. http://censusindia.gov.in/. Accessed July 1, 2018. 28. Gorai AK, Tuluri F, Shaw N, Jain KG, Tchounwou PB. Study of quarterly/seasonal association between air pollution exposure and asthma in eastern part of Texas, USA using geospatial approach. Aerosol Air Qual Res. 2015;15:1525–1544. 29. CPCB (2009). National Ambient Air Quality Standards. New Delhi, India: Central Pollution Control Board, Government of India. 30. U.S. Environmental Protection Agency. Guideline for Reporting of Daily Air Quality—Air Quality Index (AQI) (EPA-454/R-99-010). Durham, NC: Office of Air Quality Planning and Standards; 1999.