J Soils Sediments (2016) 16:62–76 DOI 10.1007/s11368-015-1180-9
SOILS, SEC 1 • SOIL ORGANIC MATTER DYNAMICS AND NUTRIENT CYCLING • RESEARCH ARTICLE
Spatio-temporal variations of soil properties in a plot scale: a case study of soil phosphorus forms and related enzymes Anna Piotrowska-Długosz 1 & Joanna Lemanowicz 1 & Jacek Długosz 1 & Ewa Spychaj-Fabisiak 2 & Dariusz Gozdowski 3 & Michał Rybacki 1
Received: 15 December 2014 / Accepted: 9 June 2015 / Published online: 5 July 2015 # The Author(s) 2015. This article is published with open access at Springerlink.com
Abstract Purpose Spatio-temporal variability in soil properties has long been observed on uniformly managed fields. Understanding the spatial characteristics of soil properties would be helpful in recognizing their relationship and the development of site-specific management techniques. The objective of this study was to determine the spatio-temporal variation of P forms and related enzymes and their relationship with some physico-chemical properties in a plot scale. Materials and methods A grid soil sampling (10×10 m) was used to measure the spatial variation of soil properties across a 0.4-ha field. Soil samples were collected at 50 points from the upper 20 cm of luvisols in April and August 2007. The total (PT), available (PA), inorganic (PI), organic (PO) phosphorus concentration, and acid (PAC) and alkaline (PAL) phosphatase activity were analyzed. Additionally, total organic carbon (TOC), soil pHKCl, and clay content were determined. Data were evaluated using classical statistical and geostatistical methods. Results and discussion Both enzyme activities were significantly higher in April than in August, while the PT and PI concentration were significantly lower. The concentrations Responsible editor: Leo Condron * Anna Piotrowska-Długosz
[email protected] 1
Department of Soil Science and Soil Protection, Faculty of Agriculture and Biotechnology, UTP University of Science and Technology, 6 Bernardyńska St, 85-029 Bydgoszcz, Poland
2
Department of Agricultural Chemistry, UTP University of Science and Technology, 5 Seminaryjna St, 85-326 Bydgoszcz, Poland
3
Department of Experimental Design and Bioinformatics, Warsaw University of Life Sciences, 159 Nowoursynowska St, 02-776 Warsaw, Poland
of PO and PA did not significantly differ between sampling dates. The spherical or mixed (spherical/linear) models with the nugget effect were fitted to the calculated semivariograms. The PA and TOC concentrations on both sampling dates as well as PAC activity in April were situated in the strong variability class, the PI concentration in April revealed a weak spatial variability and the other properties were in the moderate variability class. The clay content revealed a pure nugget effect. The range of the influence that was calculated for the properties ranged from 16.5 to 50.0 m. Kriged maps showed that temporal variability was observed in the spatial patterns of the PI and TOC concentrations and PAC activity. Conclusions Results from this study can help us to understand and predict the contribution of internal factors (i.e., soil type) in the total variability of soil properties that can interfere with the influence of soil management practices. The spatiotemporal variability showed that the studied area was temporally unstable and the implication of these findings is that more frequent sampling, at least several times throughout the growing season, must be included in the sampling strategy in order to better understand whether P forms and related enzymes show any permanent spatial patterns in soil all of the time or whether they are more randomized. Keywords Geostatistics . Soil phosphatase activity . Soil phosphorus forms . Spatio-temporal variability
1 Introduction Phosphorus (P) is an essential nutrient that is utilized for energy transport and growth by all organisms (Vitousek et al. 2010). It is involved in many critical biological processes, such as energy metabolism, the synthesis of nucleic acids, and photosynthesis (Vance et al. 2003). Phosphorus also
J Soils Sediments (2016) 16:62–76
interacts with other essential elements such as carbon (C) and nitrogen (N) in regulating many biological processes. Phosphorus exists in soil in either inorganic (PI) or organic (PO) forms. Inorganic phosphorus in the soil mainly occurs as plant available forms of H2PO4− and HPO42− adsorbed to the surface of oxides and hydroxides and to organic matter or bound to calcium (Ca) (Olibone and Rosolem 2010). Organic P forms, which occur in soil mainly as inositol phosphates, phospholipids, and nucleic acids, may constitute 20–80 % of the total P in the surface soil (Dalal 1997; Makarov et al. 1997; Turner and Haygarth 2005) and can be a potential source of P for plants and microorganisms only after hydrolysis (Wang et al. 2011). Extracellular phosphomonoesterases are the group of enzymes that can hydrolyze the ester–phosphate bonds in soil organic P, which releases phosphate into the soil solution for uptake by plants and microorganisms (Nannipieri et al. 2011). There are two major phosphomonoesterases— acid and alkaline phosphatase, which are classified according to their most effective pH. Both phosphatases significantly contribute to the release of PI in the soils and nutrient cycling, and therefore they are enzymes of great agronomic significance (Hui et al. 2013). Soils are usually supplemented with P by using either a mineral fertilizer or animal manure. When P fertilizers are applied at rates that exceed the crop removal rates, the soil P is elevated to levels that are in excess of the soil’s assimilative capacity (Ribaudo et al. 2003). Therefore, excess P that is accumulated in soils is an environmental concern because it can pollute water resources through field runoff and soil leaching (Kaiser et al. 2009). Because of this, a great deal of attention has been focused on the economic effects of deficiency of P, the ecological effects of excessive P, and on optimizing P fertilization. This is the reason that the spatial variability of this nutrient concentration, which can help in management decisions, should be considered in order to develop a more productive and efficient crop management system. Soils are characterized by a continuous variation in both space and time (Geypens et al. 1999). The spatial distribution of the soil properties in agricultural systems is affected by both natural conditions (e.g., soil parent material, climate) and by field management (e.g., crop rotation, tillage, fertilization) (Barton et al. 2004; Atreya et al. 2008). Usually, strong spatial dependence of soil properties can be attributed to internal (natural) factors and weak spatial dependence can be attributed to external factors (management factors) (Cambardella et al. 1994). Thus, there is a need to distinguish between the contributions of external and internal factors in the total variability of soil properties in order to evaluate the influence of soil management practices and ultimately lead to more efficient farming practices (Sun et al. 2003). It is important, therefore, to detect, estimate, and map the spatial pattern of soil properties. The scale of soil variation depends on the specific soil characteristic that is being studied. Some soil
63
properties, such as texture, pH, and porosity, are considered to be rather spatially static, while other features such as soil nitrogen N, soil available forms of P and K, and biological properties are highly spatially variable (Mulla and McBratney 2000; Piotrowska and Długosz 2012). Soil spatial variability can occur across multiple spatial scales, ranging from the micro level (millimeters) to the plot level (meters) and up to the landscape level (kilometers) (Garten et al. 2007; Cobo et al. 2010). Geostatistics has been proven to be useful to soil science to estimate the spatial variability of soil physical and chemical properties (Katsalirou et al. 2010; Roger et al. 2014; Zhang et al. 2014), soil biochemical properties (Aşkin and Kizilkaya 2006; Piotrowska and Długosz 2012), and soil microbial variables and processes (Peigné et al. 2009; Katsalirou et al. 2010). Geostatistics are used to detect, estimate, and map the spatial patterns of regional variables. They are based on modeling and interpreting the semivariograms that relate any dissimilarity between paired data values to the distance between each sample pair (Goovaerts 1998). Semivariogram models provide the necessary information for kriging, a method that is used to interpolate data at non-sampled points (Sebai et al. 2007). Decisions regarding field management are usually undertaken based on the results of spatial variability that is done once on the area. However, soil properties often reveal high temporal, e.g., seasonal variability and variability between years (Magid and Nielsen 1992; Štípek et al. 2004; Zhao et al. 2009). Taking into account the high temporal soil variability, it was hypothesized that soil properties that were studied in the same area differed in spatial distribution over time, which may result in making a proper recommendation for management practices based on the differences. The objectives of the study were to (1) obtain essential information on the variability of the soil P forms concentration and phosphatase activities in an arable field under uniform management and to assess the contribution of random variation in total soil variability, (2) determine whether stability of patterns over two sampling times affects the spatial pattern variability of properties that were studied, (3) examine whether current soil sampling recommendations adequately account for any variability that may be encountered, and (4) examine the relationship between phosphorus forms and related enzymes and some physico-chemical properties on two sampling dates.
2 Material and methods 2.1 Study site and soil sampling The research was carried out on a 0.4-ha study site that was selected from an 80-ha agricultural field located in the village
64
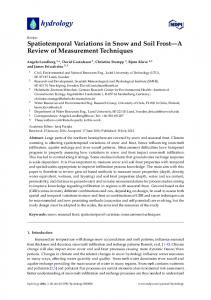
of Orlinek near Mrocza in the Pomerania and Cuiavia region (53° 15 31 N, 17° 32 43 E) in northwest Poland. The area that was selected for the research is partially covered with typical luvisols (IUSS Working Group WRB 2007). The average air temperature and the sum of rainfall during the growing season (from March to October) in 2007 was 12.9 °C and 447 mm, while between 1997 and 2007 was 12.3 °C and 435 mm. The monthly mean values of air temperature and the sum of rainfall in 2007 are presented at Fig. 1. Winter wheat (Triticum aestivum L.) was cultivated after winter rape (Brassica napus L.) as the forecrop. The soil was fertilized with phosphorus [(NH4)3PO4, 200 kg·ha−1, 46 % of P] and potassium [KCl, 200 kg·ha−1, 60 % of K] in autumn 2006. Nitrogen as NH4NO3 (43 % of N) at 300 kg·ha−1 was applied on March 12, 2007 and 250 kg·ha−1 of CAN (ammonium–calcium nitrate, N 27 %, MgO 4 %, CaO 7 %) was applied on April 13, 2007. Farmers in Poland make management decisions regarding the application of fertilizer P, based on the Polish Norm recommendations (PN-R-04023). The PN recommendations for soil P are based on the available P (Egner–Riehm P, PE-R) status of the soil, which has been classified into classes depending on the concentration of P (Table 1). Fifty soil samples were collected at the stage of the winter wheat spreading on April 12, 2007 and directly after the harvest on August 6, 2007. The dates of sample collection in this
J Soils Sediments (2016) 16:62–76 Table 1 The classes of P concentration in soil according to the Polish norm (PN-R-04023) Class of concentration
The estimation of the concentration
The estimation of the concentration
V
Very low
89
study were determined in order to estimate the spatial structure of soil properties that originated from various influence of cultivated plant. Spring sampling was chosen to study whether the rest period of plants (in winter) can not only result in changes in the magnitude of soil properties, but can change their spatial structure as well. In turn, the autumn sampling time is the typical sampling period which determine the magnitude of soil properties and their spatial structure after the plant have been cultivated, which is important in soil management (e.g., fertilization), before the sequent plant is cultivated. Soil samples were taken at regular intervals (10 m) from the 0–20 cm top layer (plow layer) across the traced plot. The grid pattern used in the study was 90 m×40 m. Each composite sample comprised 10 sub-samples that were taken randomly from a circular area with a radius of 2 m from the node point. Field-moist samples were sieved (2-mm mesh) and stored in a plastic box at 4 °C between 2 and 5 days in order to stabilize the microbial activity and then were analyzed for phosphatase activity within 1 week. In order to analyze the physico-chemical properties, the soil samples were air-dried at room temperature and sieved (2-mm mesh). 2.2 Analysis of soil properties
Fig. 1 Distribution of monthly averaged air temperature and monthly sum of rainfall
The physico-chemical properties were assayed according to standard methods and each sample was analyzed in triplicate (Burt 2004). A particle-size analysis was carried out using the Cassagrande’a method as modified by Prószyński (Mocek et al. 1997) and the sand fraction content was determined using the sieving method. Total organic carbon (TOC) and total nitrogen (TN) content was determined using a dry combustion CN analyzer (Vario Max CN), while soil pH (1 M KCl) was measured using the potentiometric method in 1:2.5 soil/solution suspensions. Available P was determined using the method of Egner– Riehm where 0.1 M ammonium lactate (pH=3.7) was used as an extracting solution. After the extraction, P was determined using spectrophotometry after color development with ammonium molybdate and SnCl2 (Egner et al. 1960). Total P was determined as described by Mehta et al. (1954) by treating soil with concentrated HCl and then with 0.5 M NaOH at room
J Soils Sediments (2016) 16:62–76
temperature and at 90 °C. After mixing, the extracts were mineralized with a mixture of concentrated acids: nitric acid (V), perchloric acid (VII), and sulfuric acid (VI) at a ratio of 10:1:4. After mineralization PT was assayed by adding two drops of phenolphthalein, ammonia, 5 N H2SO4, and ammonium molybdate and SnCl2 to the mineralized solution and the optical density was assayed at 660 nm. PI was determined in the same way but without mineralization. The PO concentration was calculated as the difference between the total and the PI concentration. The analyses of enzyme activities were performed on 1 g of fresh, moist, sieved soil samples. To determine the acid (EC 3.1.3.2) and alkaline (EC 3.1.3.1.) phosphatase activities, soil was incubated for 1 h at 37 °C with 4 ml of modified universal buffer (MUB) (pH 6.5 for the acid phosphatase and 11.0 for the alkaline one) and 1 ml of 0.115 M p-nitrophenylphosphate solution (Tabatabai and Bremner 1969). After incubation, 1 ml of 0.5 M CaCl2 and 4 ml of 0.5 M NaOH were added to the samples; this was followed by filtration. The concentration of p-nitrophenyl was determined photometrically at 400 nm. The enzyme activity values were calculated based on the oven-dry (105 °C) weight of soil. 2.3 Statistical and geostatistical analyses The dataset was analyzed independently twice—first in a classical way in order to investigate the general status of the soil P forms and phosphatase activity at two sampling times and their links with the chemical–physical soil properties and then within a geostatistics framework in order to investigate the spatial variation of different P forms and related enzymes. The classical statistical parameters such as the mean, maximum, and minimum, standard deviation (SD), coefficient of variation (CV%), as well as skewness and kurtosis were evaluated using STATISTICA v. 9.0 Software. Normality of the data was determined using the Shapiro–Wilk test. Since the data of all studied properties were normally distributed, we chose not to transform the values before further analyses. In order to evaluate any significant differences between the results that were obtained in April and in August, data were analyzed using the Tukey’s test (p