J. N. Am. Benthol. Soc., 2005, 24(4):832–844 q 2005 by The North American Benthological Society
Spatiotemporal patterns in community structure of macroinvertebrates inhabiting calcareous periphyton mats SHAWN E. LISTON1
AND JOEL
C. TREXLER2
Department of Biological Sciences, Florida International University, Miami, Florida 33199 USA Abstract. Calcareous floating periphyton mats in the southern Everglades provide habitat for a diverse macroinvertebrate community that has not been well characterized. Our study described this community in an oligotrophic marsh, compared it with the macroinvertebrate community associated with adjacent epiphytic algae attached to macrophytes in the water column, and detected spatial patterns in density and community structure. The floating periphyton mat (floating mat) and epiphytic algae in the water column (submerged epiphyton) were sampled at 4 sites (;1 km apart) in northern Shark River Slough, Everglades National Park (ENP), in the early (July) and late (November) wet season. Two perpendicular 90-m transects were established at each site and ;100 samples were taken in a nested design. Sites were located in wet-prairie spikerush-dominated sloughs with similar water depths and emergent macrophyte communities. Floating mats were sampled by taking cores (6-cm diameter) that were sorted under magnification to enumerate infauna retained on a 250-mmmesh sieve and with a maximum dimension .1 mm. Our results showed that floating mats provide habitat for a macroinvertebrate community with higher densities (no. animals/g ash-free dry mass) of Hyalella azteca, Dasyhelea spp., and Cladocera, and lower densities of Chironomidae and Planorbella spp. than communities associated with submerged epiphyton. Densities of the most common taxa increased 33 to 153 from early to late wet season, and community differences between the 2 habitat types became more pronounced. Floating-mat coverage and estimated floating-mat biomass increased 20 to 30% and 30 to 110%, respectively, at most sites in the late wet season. Some intersite variation was observed in individual taxa, but no consistent spatial pattern in any taxon was detected at any scale (from 0.2 m to 3 km). Floating mats and their resident macroinvertebrate communities are important components in the Everglades food web. This community should be included in environmental monitoring programs because degradation and eventual loss of the calcareous periphyton mat is associated with P enrichment in this ecosystem. Key words: epiphyton, eutrophication, Everglades, habitat structure, infauna, microhabitat, power analysis, refuge, spatial autocorrelation, wetland monitoring.
Physical properties such as flow velocity and habitat stability are key factors structuring spatial variation and scaling of freshwater communities (Moss 1998). Freshwater macroinvertebrates frequently exploit microhabitats that provide refuge from physical stressors. Large and highly diverse aquatic macroinvertebrate communities are supported by microhabitats such as inorganic benthic substrates (Clements 1987, Peckarsky 1991, Holomuzki and Messier 1993), submerged woody debris (Benke et al. 1985, Smock et al. 1989, O’Connor 1991), and leaf litter (Cummins and Merritt 1984, Dobson 1994) in streams, and submerged macrophyte beds in lakes (Soszka 1975, Cyr and Downing Present address: US Geological Survey, Florida Integrated Science Center, Water and Restoration Studies, Everglades National Park Field Station, 40001 State Road 9336, Homestead, Florida 33034 USA. E-mail:
[email protected] 2 E-mail address:
[email protected] 1
1988). Freshwater wetlands are characterized by low or no flow and poorly mixed, relatively shallow standing water that is prone to periodic drying (Rader 2001). Emergent or submerged macrophytes and associated algae serve as both structural habitat and a food source for invertebrates in many wetlands, often supporting the highest diversity and abundance of aquatic invertebrates in these systems (Goldsborough and Robinson 1996, Sharitz and Batzer 1999). Compared to other aquatic systems, the Florida Everglades has an unusually high standing stock of periphyton (Goldsborough and Robinson 1996) coupled with a relatively low standing stock of invertebrates and fish (Turner et al. 1999). The southern Everglades has almost no submerged woody debris, but thick floating periphyton mats (floating mats) provide habitat for numerous species of aquatic invertebrates. These floating mats form as calcareous green and blue-green algae that often coat submerged
832
2005]
MACROINVERTEBRATES
IN FLOATING PERIPHYTON MATS
vegetation and bottom sediments and become engorged with gases causing them to break free and float to the surface (Gleason and Spackman 1974). Calcareous floating mats also serve as a refuge from predation and a food source for a diverse macroinvertebrate community (Browder et al. 1994, Geddes and Trexler 2003). Few studies have sought to describe the Everglades invertebrate community (Rader 1999), and sampling methods used in the Everglades often pool animals from several microhabitats. Multiple inverted funnel traps and D-frame sweepnets, the most commonly used methods, fail to provide quantitative estimates of community density (no. animals/m2 or no. animals/g algal or macrophyte substrate) and do not specifically target or isolate the periphyton mat, where structural complexity makes separating infaunal invertebrates from the substrate difficult. Characterizing the floating-mat infaunal community has important management implications for wetlands. For example, eutrophication is a serious threat to the highly oligotrophic Everglades ecosystem. The break-up and disappearance of calcareous floating mats is an early indicator of increased P levels. The implications of this habitat loss on higher trophic levels are not well understood because the resident macroinvertebrate community is poorly described and current sampling methods are ill-suited for producing density estimates. Developing a sampling method to quantify mat infauna and gaining a baseline understanding of the structure of these communities in unimpacted marshes is critical to the development and implementation of water-quality monitoring protocols that incorporate this important microhabitat community. Understanding the spatial scale of community variation is essential when using any arbitrary sampling unit (Pielou 1974), especially for communities residing within complex habitat structures and in heterogeneous or patchy landscapes (Legendre and Legendre 1983, Downing 1991). Our study describes the infaunal community inhabiting floating mats in the Florida Everglades. Our primary goal was to describe spatial and temporal variation in the floating mat infaunal community and compare it to the community in submerged epiphyton adjacent to the mat, and from which the floating mat develops. A nested sampling design was used to detect spatial patchiness that may exist in this
833
community at scales between 20 cm and 3 km. A secondary goal was to test a new method for sampling floating mat infauna. The effectiveness of using a 6-cm coring device to quantify mat infauna was demonstrated with post-hoc power analyses. Methods Site selection and sampling design Northern Shark River Slough, Everglades National Park (ENP), was sampled at 4 sites (;1 km apart) along a longitudinal transect (Fig. 1). All sites were located in oligotrophic wet-prairie sloughs (inundated $300 d/y), dominated by spikerush (Eleocharis spp.). At each site, two 90m transects, 1 parallel and 1 perpendicular to flow, were established. The 2 transects were oriented as an L or T to avoid encroaching sawgrass (Cladium jamaicense) patches, and an Lshaped sampling pattern was repeated within each site at various spatial scales (Fig. 2). Each transect contained five 100-m2 plots spaced 10 m apart (because the transects intersected, 1 plot was included within both transects; n 5 9 plots). A 1-m2 quadrat was established at the 2 outer corners of each plot, with more intensive sampling (5 to 7 quadrats) within the end plots. Three core samples were taken within each quadrat. Core samples were arranged as either a small L (20 cm apart) or large L (50 cm apart), alternating between plots. This design resulted in 93 samples at each L-shaped site (sites A, B, and D), and 102 samples at the T-shaped site (site C). Sampling locations were shifted 10 cm and rotated 1808 within each quadrat to avoid resampling the same location in the 2nd sampling season (see below). The sampling design was developed prior to visiting sites with no knowledge of local heterogeneity or spatial patterns in emergent macrophytes or floating-mat coverage. The only exception was in the orientation of the 2 perpendicular transects, which were adjusted so that they lay entirely within the undisturbed slough to avoid sawgrass stands and airboat trails. Each of the 381 samples was assigned Cartesian coordinates within each site coupled with Universal Transverse Mercator (UTM) coordinates for each site to provide unique (X, Y) coordinates.
834
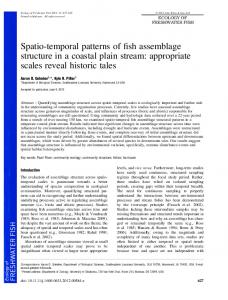
FIG. 1.
S. E. LISTON
AND
J. C. TREXLER
[Volume 24
Location of study sites in northern Shark River Slough, Everglades National Park, South Florida.
Field sampling and sample processing Sampling was conducted during the early (28–31 July) and late (11–12 November) wet season in 2000. A 6-cm-diameter (2.83 3 1023 m2) core was cut from the floating mat at each sampling location. A grab sample of submerged epiphyton was taken from the water column if no floating mat was present at the time of sampling. No sample was taken if there was no floating mat or submerged epiphyton at the specified location. A total of 263 floating-mat and 54 submerged-epiphyton samples were taken in July (no substrate at 49 sampling locations, 15 samples were inadvertently omitted), and a total of 314 floating-mat and 38 submerged-epiphyton samples were taken in November (no substrate at 29 sampling locations). Most floating-mat samples consisted of both periphyton and Utricularia purpurea (purple bladderwort) (July: 46%, November: 62%). Floating-mat samples consisting of periphyton only (July: 32%, November: 30%) or U. purpurea only (July: 16%, November: 4%) were less common. Submergedepiphyton samples also consisted of periphyton only (July: 39%, November: 24%), U. purpurea only (July: 27%, November: 58%), or both periphyton and U. purpurea (July: 24%, November: 11%). A small proportion of samples (#10%)
consisted of some other combination of periphyton, U. purpurea, U. foliosa (leafy bladderwort), and Bacopa caroliniana (water hyssop). Water depth was measured in each quadrat in each sampling season, and % floating-mat cover was estimated using a 1-m2 quadrat partitioned into a 10 3 10 grid. All samples were placed on ice in the field and later frozen until processed. Stem counts of emergent vegetation were taken on 1 September 2000 in one haphazardly thrown 1-m2 throw-trap in each 100-m2 plot (Freeman et al. 1984). Macrophyte densities were recorded only once, midway between the 2 sampling seasons, to reduce physical disturbance at our sites and because these communities do not change significantly during the wet season (R. B. Shamblin, Florida International University, personal communication). Samples were thawed, stained with rose Bengal, and refrigerated for $12 h prior to processing. Each sample was rinsed in a 250-mm sieve and transferred to a Petri dish. Samples were teased apart and all animals .1 mm in length were removed from the substrate under a dissecting microscope, identified to the lowest feasible taxonomic level, and preserved in 70% ethanol. Samples were frozen rather than chemically preserved to estimate ash-free dry mass
2005]
MACROINVERTEBRATES
IN FLOATING PERIPHYTON MATS
835
FIG. 2. Schematic diagram of nested sampling design. A.—Locations of plots within sites. Each site was constructed from nine 100-m2 plots spaced 10 m apart and arranged in an L- (sites A, B, and D) or T-design (site C). B.—Location of quadrats within plots. Dots represent core samples, and end plots were sampled more intensively, repeating the L-pattern. C.—Locations of core samples within quadrats. Three cores were taken from each 1-m2 quadrat. Plots alternated large-L and small-L quadrat designs (see Methods for details).
(AFDM) of the algal substrate. Freezing and thawing greatly reduced the integrity of oligochaetes, rendering them impossible to quantify, so this group was excluded from our analyses. This problem was not observed with other taxa. The remaining plant material from each sample was dried at 708C for $48 h and incinerated at 5008C for 3 h. Utricularia spp. and B. caroliniana in samples were included in mass measurements. Data analysis Environmental data (water depth and % floating-mat cover) were analyzed using 2-way anal-
ysis of variance (ANOVA) (site 3 season). Floating-mat mass/m2 was estimated for each sample by dividing the sample dry mass by its estimated surface area (surface area of the core 3 % floating-mat cover in the respective quadrat). Floating-mat mass/m2 was analyzed using 2way ANOVA (site 3 season). The raw data for floating-mat samples were counts of macroinvertebrates/28.3 cm2 of floating mat (surface area density). However, marked variation in the mass of floating mat/ unit area was observed among our samples, and the submerged-epiphyton samples were consistently much less dense than the floating-mat samples. To account for this heterogeneity and
836
S. E. LISTON
AND
J. C. TREXLER
[Volume 24
TABLE 1. Means of physical and environmental variables from the 4 study sites. Means with the same superscripts across rows do not differ significantly between sites (p . 0.05). DM 5 dry mass. Sites Physical factors
A
B
C
D
Water depth (cm) July November
45.3a 61.1a
52.6b 66.4a
53.4b 63.9a
53.9b 61.0a
Floating-mat cover (%) July November
31.0a 63.7a
79.8b 91.6a
52.6a 74.1a
41.5a 71.5a
Estimated floating-mat mass (g DM/m2) July 47.3a November 87.9a
151.5b 157.5a
72.2a 119.7a
38.8a 104.8a
Emergent macrophytes (no./m2) Eleocharis spp. Panicum hemitomon Total stem density
143.0b 2.6a 155.3b
91.1a 0.7a 102.6ab
89.4a 3.6a 114.1ab
90.2 5.4
89.2 2.2
79.6 9.8
76.9a 5.5a 95.5a
Emergent macrophytes (% relative abundance) Eleocharis spp. 79.5 Panicum hemitomon 10.2
allow comparisons of the 2 microhabitats, the invertebrate counts were adjusted by the mass of their substrate to yield density/unit substrate mass (mass density). Analysis was done on both density estimates. No discrepancies were found between the 2 density measures; therefore, only mass densities are reported (no. invertebrates/ g AFDM of substrate). Post-hoc power analyses were conducted on our floating-mat data (2-way factorial ANOVA: site 3 season, a 5 0.05, n 5 53) using the most common taxa (those present in $5% of samples) to determine the total number of samples necessary to detect expected effects. Power analysis required equal sample sizes for all cells, so some data sets were randomly subsampled to achieve n 5 53 (the n of our smallest cell). Larger data sets (n . 53) were randomly subsampled several times and only subtle differences in withinand between-cell variances and no differences in the resulting power curves were found. A plot was created to show effect size (f 5 standard deviation within cells divided by standard deviation between cells) as a function of sample size (n) based on 80% power. Our observed effect sizes for each taxon were used to evaluate our sampling method and to aid development of sampling protocols encompassing the entire
macroinvertebrate community or for specific taxa. Multivariate techniques were used to describe patterns between emergent macrophyte and invertebrate communities. These analyses were followed by univariate tests for the most common taxa to determine the origin of patterns. Standardized Bray–Curtis dissimilarity matrices were constructed using densities of the common taxa, and analysis of similarities (ANOSIM) was used to compare patterns (Clarke 1993, Clarke and Warwick 1994). We used similarity percentage breakdowns (SIMPER) to determine the most influential taxa in the dissimilarities and ANOVA to further show variation in individual taxa. Nonmetric multidimensional scaling (NMDS) was used to visualize our Bray–Curtis dissimilarity matrix and to illustrate latent patterns in species composition data. All analyses were repeated using relative abundances of taxa, but these results are reported only when they differed from patterns in analysis of density. Relative abundances were y0.25-transformed to mix the relative contributions from both common and rare species for multivariate analyses, as recommended by Clarke and Warwick (1994). Hierarchical ANOVA (site, plot[site], quadrat[plot{site}]) on individual taxa in each season
2005]
MACROINVERTEBRATES
837
IN FLOATING PERIPHYTON MATS
TABLE 2. Relative abundance (RA), incidence (I), and total number (n) of individual macroinvertebrates collected from floating periphyton mats and submerged epiphyton in the Florida Everglades in late July and early November 2000 (sites and sampling seasons were pooled). Subscripts on insect taxa indicate adult (A), larval (L), and pupal (P) life stages. – indicates taxon not collected in the microhabitat. Floating periphyton Taxon Nematoda Mollusca Gastropoda Littoridinops monroensis Physella spp. Planorbella spp. Arthropoda Cladocera Copepoda Ostracoda Malacostraca Mysidacea Taphromysis louisianae Amphipoda Hyalella azteca Decapoda Palaemonetes paludosus EphemeropteraL Odonata AnisopteraL Zygoptera CoenagrionidaeL TrichopteraL HeteropteraAa Belostoma spp.A Pelocoris femoratusA LepidopteraL ColeopteraA ColeopteraL DipteraP Ceratopogonidae Dasyhelea spp.L Bezzia spp.L ChironomidaeL StratiomyiidaeL TabanidaeL Unidentified Total macroinvertebrates
Submerged epiphyton
RA
I
n
RA
I
n
20.3
87.8
2524
20.7
88.9
575
,0.1
1.0
7
–
–
0
3.4 0.4
37.0 8.5
592 59
0.5 0.7
14.1 21.7
20 23
4.0 0.5 0.5
37.3 9.5 9.7
443 65 74
1.2 0.2 0.8
17.4 4.4 14.4
25 5 27
,0.1
0.2
1
–
0
5.9
47.6
837
1.5
26.1
60
,0.1 0.1
0.2 2.1
1 13
– 0.2
– 3.3
0 4
0.1
1.7
10
,0.1
1.1
1
0.3 ,0.1 0.2 ,0.1 0.2 ,0.1 0.3 0.1 0.9
7.3 0.5 6.4 0.7 7.1 0.5 7.1 0.9 17.9
49 3 42 4 44 3 44 5 122
0.2 – 0.1 – – – ,0.1 – 0.6
6.5 – 1.1 – – – 1.1 – 18.5
7 0 1 0 0 0 1 0 19
25.5 0.7 36.3 0.1 ,0.1 ,0.1
90.1 10.9 96.4 2.4 0.5 0.3
3613 87 4757 18 3 2 13,422
7.8 0.8 64.6 – – –
73.9 20.7 97.8 – – –
285 22 2256 0 0 0 3332
–
a Heteroptera includes all members of the suborder with the exception of members of the family Corixidae, and the genera Belostoma, Lethocerus, Pelocoris, and Gerris
838
S. E. LISTON
AND
J. C. TREXLER
[Volume 24
semivariogram model were used as parameters in a model of spatial autocorrelation using SAS PROC MIXED (SAS Institute, Cary, North Carolina). The model was evaluated using an analysis of deviance with the log-likelihood ratio of each model. The likelihood ratio statistics of models with and without spatial parameters were compared to x2(1) to evaluate the significance of the spatial parameter (Littell et al. 1996). Unless otherwise noted, a loge(y 1 1) transformation of water depth and all densities (no. invertebrates/g AFDM, no. emergent stems/ m2), an arcsine(y0.5) transformation of proportions (% floating-mat cover, relative abundances), and a y0.5 transformation of the count data were used to fulfill the assumptions of our analyses. All densities are reported as geometric means (antilogs of the arithmetic mean of our loge(y 1 1)-transformed data set; Bland and Altman 1996) to put means back on the scale of the original data. Proportions are reported as arithmetic means of untransformed data. Results Physical variation among study sites
FIG. 3. Estimated sample size (n) necessary to detect effect size (f) at 80% power based on differences between sites (A) and between seasons (B). Arrows indicate effect size observed in most commonly encountered taxa (heavy arrows indicate cases where p # 0.05). AM 5 Hyalella azteca, BE 5 Bezzia spp., CD 5 Cladocera, CH 5 Chironomidae, CL 5 Coleoptera (adult), CN 5 Coenagrionidae, CP 5 Copepoda, DA 5 Dasyhelea spp., HE 5 Heteroptera, NE 5 Nematoda, OS 5 Ostracoda, PE 5 Pelocoris femoratus, PH 5 Physella spp., PL 5 Planorbella spp., PU 5 Diptera pupae, TOT 5 total invertebrates.
was used to see where the variance was partitioned. Analysis of semivariance was conducted for each site in each season with both the horizontal (E–W) and vertical (N–S) transects. An isotropic semivariogram fit with a spherical model (modified quadratic function reaching an asymptote or sill) was created for each common taxon. The sill (C0 1 C) and range (A0) of the
Water depth, % floating-mat cover, and floating-mat mass varied more often between sampling seasons than among sites within a season (Table 1). Mean water depth did not differ among sites B, C, and D in July (Tukey’s test, p ¯ 5 53.4 cm), but site A was 15% shal. 0.05, X lower than the other sites (Tukey’s test, p , ¯ 5 45.5 cm). Percent floating-mat cover 0.001, X was 91% higher and estimated floating-mat mass/m2 was 123% higher at site B than at all other sites in July (Tukey’s test, % cover: p # 0.004, mass: p , 0.001). Water depth increased at all sites from July to November (F3,243 5 18.451, p , 0.001, range of increase 5 13.3– 34.5%), and both % floating-mat cover and estimated floating-mat mass/m2 increased at all sites except site B (Tukey’s test, % cover: p # 0.028, range of increase 5 40.9–105.5%, mass: p # 0.024, range of increase 5 28.0–111.4%). Wa¯ 5 63.2 cm), % floating-mat cover, ter depth (X and estimated floating-mat mass/m2 did not differ consistently among sites in November. Multivariate analysis of emergent macrophyte densities showed significant differences in the macrophyte community among sites (Global R
2005]
MACROINVERTEBRATES
IN FLOATING PERIPHYTON MATS
839
FIG. 4. Nonmetric Multidimensional scaling plot of macroinvertebrate communities in floating-mat and submerged-epiphyton microhabitats in the early and late wet season (stress 5 0.14).
5 0.151, p 5 0.008). Emergent macrophyte communities were dominated by Eleocharis spp. and Panicum hemitomon (maidencane). Stem densities of P. hemitomon (F3,32 5 1.441, p 5 0.249) did not differ among sites. Stem densities of Eleocharis spp. and total stem densities were 1.73 and 1.53 higher, respectively, at site B than at all other sites (Tukey’s test, Eleocharis spp.: p # 0.034, total: p # 0.025). The relative abundances of Eleocharis spp. and P. hemitomon did not differ among sites (Eleocharis spp.: F3,32 5 1.648, p 5 ¯ 5 86.0%; P. hemitomon: F3,32 5 1.813, p 0.198, X ¯ 5 6%). 5 0.165, X Evaluation of sampling method Twenty-six aquatic invertebrate taxa were identified (Table 2). A small number of terrestrial taxa (1 Heteroptera, 2 Homoptera, 18 adult Diptera, and 4 Arachnida) were not included in our analyses. The mean number of macroinvertebrates/floating-mat core was 18.7 in July (range 5 0–84, SD 5 14.0) and 27.2 in November (range 5 1–132, SD 5 14.7). Power analyses indicated that ;45 samples were necessary to
detect differences in density of most taxa and total density among sites (Fig. 3A) and between seasons (Fig. 3B). This power analysis was supported by the observation that taxa that did show significant variations in univariate analyses (where n 5 53) had recommended sample sizes ,53, whereas taxa that did not vary significantly had recommended sample sizes .53 (Fig. 3A, B). Comparison of floating-mat and submergedepiphyton microhabitats Community composition varied between floating-mat and submerged-epiphyton substrates in both seasons (Global R 5 0.250, p 5 0.001; Fig. 4). The 5 most influential taxa in the dissimilarities were Dasyhelea spp., Nematoda, Chironomidae, H. azteca, and Cladocera. Cladocera and Dasyhelea spp. densities were 12.73 and 2.13 higher, respectively, in the floating mat than in submerged epiphyton in July, whereas Chironomidae density was 1.73 higher in submerged epiphyton than in the floating mat in July (Fig. 5A). Hyalella azteca, Dasyhelea spp., and
840
S. E. LISTON
AND
J. C. TREXLER
[Volume 24
spp., and total invertebrate densities were 2.83, 3.33, 4.43, and 1.53 higher, respectively, in submerged epiphyton than in the floating mat in November (Fig. 5B). Nematoda density did not differ between microhabitats. Community analysis of relative abundances of taxa showed a similar separation of floating-mat and submerged-epiphyton microhabitats (Global R 5 0.140, p 5 0.001). Dasyhelea spp., H. azteca, Nematoda, Cladocera, and Physella spp. were primarily responsible for the variation in relative abundance. Patterns in relative abundances of individual taxa were similar to density patterns except for Planorbella spp. Spatial and temporal patterns of floating-mat infaunal communities
FIG. 5. Mean (11 SE) densities of invertebrate taxa with significant microhabitat preference in July (A) and November (B). * indicates significant difference (p # 0.05) for a pair of bars. Taxon abbreviations as in Fig. 3.
Physella spp. densities were 4.73, 6.03, and 6.03 higher, respectively, in the floating mat than in submerged epiphyton in November, whereas Chironomidae, Ostracoda, Planorbella
The invertebrate community in floating mats varied significantly among sites and sampling seasons (sites: Global R 5 0.121, p 5 0.001, seasons: Global R 5 0.282, p 5 0.001). All pairwise comparisons of community composition among sites were significant (Tukey’s test, p 5 0.001). SIMPER indicated that site and seasonal differences in community structure were caused primarily by H. azteca, Nematoda, Dasyhelea spp., Physella spp., Cladocera, and Chironomidae. ANOVAs also detected site and season differences in these taxa, except for Nematoda. Only Dasyhelea spp., Chironomidae, and total invertebrate density (driven primarily by Chironomidae) showed significant variation among sites in July, and H. azteca, Cladocera, Dasyhelea spp., and Physella spp. densities were higher or lower at one site relative to the others in November (Table 3). All significant seasonal differences represented an increase in taxon densities and
TABLE 3. Mean density (no./g ash-free dry mass periphyton) of floating-mat infauna across 4 sites in July and November. Means with the same superscripts across rows do not differ between sites. Only taxa and taxon/sampling season combinations with significant variation (p , 0.05) are shown. Site Taxon Physella spp. Cladocera Hyalella azteca Dasyhelea spp. Chironomidae Total macroinvertebrates
Season
A
B
C
November November November July November July July
1.07a 0.70a 1.97a 13.64ab 22.22ab 24.08a 62.69a
4.24b 1.86a 4.83b 25.05a 32.45a 21.87a 79.32a
2.16ad 5.63b 6.19b 10.72b 17.34b 32.15a 76.09a
D 2.71bcd 1.51a 6.04b 2.10c 16.83b 10.03b 31.14b
2005]
MACROINVERTEBRATES
841
IN FLOATING PERIPHYTON MATS
TABLE 4. Magnitudes of mean density (no./g ash-free dry mass) increases at each site (A, B, C, D) from July to November in floating-mat and submerged-epiphyton microhabitats (e.g., 2.0 5 23 or 100% increase). Submerged epiphyton was not sampled at site B in November. Only taxa with significant seasonal variation in at least one microhabitat (p , 0.05) are shown. – indicates no seasonal variation. Floating mat
Submerged epiphyton
Taxon
A
B
C
D
A
C
D
Physella spp. Cladocera Hyalella azteca Dasyhelea spp. Chironomidae Total
11.7 – 10.0 – – 1.5
15.1 4.0 11.0 – – 1.4
5.6 10.4 10.3 – – 1.4
7.1 – 9.9 8.0 3.7 3.8
– – – – 3.2 2.6
– – – – – 3.2
– – – – – –
total density between July and November. Hyalella azteca, Physella spp., and total density increased at all sites, whereas Chironomidae, Cladocera, and Dasyhelea spp. increased at only 1 or 2 sites (Table 4). Analysis of relative abundances revealed the same site and seasonal patterns as were observed with densities. Hierarchical ANOVA indicated that the greatest differences for most taxa for which spatial patterns were detected were at the smallest or intermediate spatial scale (1-m2 quadrat or 100m2 plot). The largest spatial scale explained #8.4% of the density variation that was observed for any taxon (Table 5). Coefficients of determination (CD) increased with decreasing spatial scale, but even the largest CDs showed only relatively weak effects (maximum R2 ø 0.3). No consistent relationship between spatial variation and season was observed for any taxon. Analysis of semivariance revealed no consistent significant intersite spatial pattern. It detected only 10 significant spatial patterns from the 256 data sets tested (16 taxa 3 4 sites 3 2 seasons 3 2 transects). Given a 5 0.05, ;12 of the 256 tests would have been expected to be significant by chance alone (type I error). No taxon showed spatial patterns more often than others, and no site or season displayed a consistent pattern. Discussion Sampling efficacy Cores proved to be an effective method for enumerating large ($1 mm) floating-mat infauna. No sampling method currently used in Ev-
erglades marshes specifically targets or even incorporates periphyton infauna, so comparing our results to previous estimates of invertebrate standing stocks is difficult. Total invertebrate densities were often higher in submerged epiphyton (a community that is incorporated in sweep-net sampling, a common macroinvertebrate sampling method in wetlands) than in floating-mat samples, but floating-mat infauna were often quite dense (particularly in the late wet season). Floating-mat infauna are probably underrepresented in sweep-net samples because many taxa burrow or are otherwise physically bound within the mat and can only be removed manually and under magnification. Our data suggest that underrepresentation of macroinvertebrates in the floating mats in estimates of total invertebrate standing stock may cause significant underestimation of densities of many relatively large taxa (e.g., Dasyhelea and H. azteca) and underestimation of total invertebrate standing stock. Our analysis also emphasizes the benefits of incorporating quantitative techniques (number or mass of individuals/unit surface area or mass of substrate) into macroinvertebrate analyses. Such techniques facilitate comparisons between microhabitats, across the wetland landscape, and with other freshwater systems. Community variation between microhabitats The communities inhabiting floating mats and those associated with the submerged epiphyton showed marked differences. The submerged epiphyton community was dominated by 3 taxonomic groups (chironomids, Dasyhelea,
842
S. E. LISTON
AND
J. C. TREXLER
[Volume 24
TABLE 5. Mean density, number of samples (n), and R2 values for hierarchical ANOVA for the most commonly encountered floating-mat taxa at 3 spatial scales in each sampling season. Only taxa that showed significant effects are shown. Subscripts on insect taxa indicate adult (A), larval (L), and pupal (P) life stages. AFDM 5 periphyton ash-free dry mass. R2
Taxon Nematoda Physella spp. Planorbella spp. Cladocera Copepoda Ostracoda Hyalella azteca CoenagrionidaeL HeteropteraAa Pelocoris femoratusA ColeopteraA DipteraP Dasyhelea spp.L Bezzia spp.L ChironomidaeL Total macroinvertebrates
Season July November July November July November July November July November July November July November July November July November July November July November July November July November July November July November July November
Density (no./g AFDM)
n
9.54 14.39 0.28 2.46 0.24 0.08 0.57 2.06 0.06 2.46 0.18 0.17 0.45 4.51 0.04 0.20 0.05 0.13 0.08 0.13 0.05 0.18 0.35 0.35 11.27 21.97 0.17 0.27 20.91 30.91 61.74 109.28
244 314 260 314 260 314 260 314 244 314 244 314 260 314 260 314 260 314 260 314 260 314 260 314 260 314 260 314 260 314 260 314
Site
100-m2 plot(site)
1-m2 quadrat(plot[site])
– – – 0.075 – – – 0.084 – 0.025 – 0.027 – – – – – – – – – – – – 0.076 0.055 – – 0.056 – – –
0.151 0.147 – – – – 0.231 0.123 – – – – – – 0.187 0.159 – – 0.140 – – – 0.146 – – – – – 0.229 0.151 0.155 0.158
– – – 0.340 – – – – – – – – – 0.292 – – – – – – – – – – – – 0.330 – – – – –
a Heteroptera includes all members of the suborder with the exception of members of the family Corixidae, and the genera Belostoma, Lethocerus, Pelocoris, and Gerris
and nematodes), with no other group contributing more than 1.5% of the total density. Chironomids were the most abundant taxonomic group in both microhabitats, but they made up a much greater % of the total invertebrate density in the submerged epiphyton (64%) than in the floating mat (36%). The floating-mat community was characterized by higher densities of Dasyhelea, H. azteca, cladocerans, and Physella than in the submerged epiphyton, which had higher densities of chironomids, Planorbella, and
ostracods. Total invertebrate density was higher in the submerged epiphyton than in floating mats, primarily because of high chironomid density. Spatial variation in macroinvertebrate communities was generally only subtle, whereas variation between microhabitats was more obvious, particularly late in the wet season, when the physical structure of the floating mats was more developed. As the wet season progressed and water levels rose from July to November,
2005]
MACROINVERTEBRATES
IN FLOATING PERIPHYTON MATS
the extent of the floating mat (measured both as % cover and biomass) increased at 3 of our 4 sites, and densities of all common taxa (as well as total density) increased in both microhabitats. The density of fish and aquatic invertebrates that patrol the outer perimeters of the floating mat and prey on the infauna identified in our study also increased from early to late wet season (Trexler et al. 2001). Importance of the floating mats as microhabitat Precipitation of calcite by filamentous bluegreen algae within the floating mat creates a highly structured calcite matrix (Browder et al. 1994, Donar et al. 2004), resulting in a degree of habitat complexity that may be more important as a refuge for some macroinvertebrates than previously thought (Geddes and Trexler 2003). No submerged epiphyton samples were taken where floating mats were present, but floating mats often occurred immediately adjacent to our submerged-epiphyton sampling locations, and the communities were not completely isolated from each other. The community composition of submerged epiphyton underneath floating mats remains undescribed. Factors such as colonization or dispersal from the adjacent floating mat and decreased UV radiation because of shading (Hampton 2004) may significantly affect the community in the submerged-epiphyton microhabitat. Complex microhabitats with much structure are often difficult to sample and can be overlooked or underrepresented in sampling. The extensive floating mats in the Florida Everglades make up $50% of the total primary producer standing stock (E. Gaiser, Florida International University, personal communication), yet they are often thick and highly calcified, making resident communities difficult to access. Understanding community structure of the floating-mat infaunal community is especially important in this system, where the mats respond rapidly to nutrient enrichment, breaking up and disappearing with high P levels (McCormick et al. 1998). Further ecological analysis of this macroinvertebrate community is likely to reveal important foodweb impacts from nutrient enrichment, an environmental stressor whose effects are presently understood mostly through the study of algal communities (McCormick et al. 2004).
843
Acknowledgements We thank W. DeLoach, R. B. Shamblin, and X. Pagan for help collecting field samples and R. Urgelles for help with taxonomic identifications. Special thanks go to J. Richards for initially encouraging this study. The manuscript was greatly improved by thoughtful comments from 2 anonymous referees. Financial support for this research was provided by the Tropical Biology Program at Florida International University and STAR-GRO Fellowship U-915916 from the US Environmental Protection Agency. This research was based on work supported by the National Science Foundation grant no. 9910514 (Florida Coastal Everglades LTER). This paper is contribution no. 99 of the Florida International University Tropical Biology Program and no. 266 of the Southeast Environmental Research Center at Florida International University. Literature Cited BENKE, A. C., R. L. I. HENRY, D. M. GILLESPIE, AND R. J. HUNTER. 1985. Importance of snag habitat for animal production in southeastern streams. Fisheries 10(5):8–13. BLAND, J. M., AND D. G. ALTMAN. 1996. Statistics notes: transformations, means, and confidence intervals. British Medical Journal 312:1079. BROWDER, J. A., P. J. GLEASON, AND D. R. SWIFT. 1994. Periphyton in the Everglades: spatial variation, environmental correlates, and ecological implications. Pages 379–416 in S. M. Davis and J. C. Ogden (editors). Everglades: the ecosystem and its restoration. St. Lucie Press, Boca Raton, Florida. CLARKE, K. R. 1993. Non-parametric multivariate analyses of change in community structure. Australian Journal of Ecology 18:117–143. CLARKE, K. R., AND R. M. WARWICK. 1994. Change in marine communities: an approach to statistical analyses and interpretation. Natural Environmental Research Council, Plymouth Marine Laboratory, Plymouth, UK. CLEMENTS, W. H. 1987. The effect of rock surface area on distribution and abundance of stream insects. Journal of Freshwater Ecology 4:83–91. CUMMINS, K. W., AND R. W. MERRITT. 1984. Ecology and distribution of aquatic insects. Pages 59–65 in R. W. Merritt and K. W. Cummins (editors). An introduction to the aquatic insects of North America. 2nd edition. Kendall/Hunt Publishing Company, Dubuque, Iowa. CYR, H., AND J. A. DOWNING. 1988. Empirical relationships of phytomacrofaunal abundance to plant biomass and macrophyte bed characteristics. Ca-
844
S. E. LISTON
AND
nadian Journal of Fisheries and Aquatic Sciences 45:976–984. DOBSON, M. 1994. Microhabitat as a determinant of diversity: stream invertebrates colonizing leaf packs. Freshwater Biology 32:565–572. DONAR, C. M., K. W. CONDON, M. GANTAR, AND E. E. GAISER. 2004. A new technique for examining the physical structure of Everglades floating periphyton mat. Nova Hedwigia 78:107–119. DOWNING, J. A. 1991. The effect of habitat structure on the spatial distribution of freshwater invertebrate populations. Pages 87–106 in S. S. Bell, E. D. McCoy, and H. R. Mushinsky (editors). Habitat structure: the physical arrangement of objects in space. Chapman and Hall, New York. FREEMAN, B. J., H. S. GREENING, AND J. D. OLIVER. 1984. Comparison of three methods for sampling fishes and macroinvertebrates in a vegetated freshwater wetland. Journal of Freshwater Ecology 2:603–609. GEDDES, P., AND J. C. TREXLER. 2003. Uncoupling of omnivore-mediated positive and negative effects on periphyton mats. Oecologia (Berlin) 136:585– 595. GLEASON, P. J., AND W. SPACKMAN. 1974. Calcareous periphyton and water chemistry in the Everglades. Pages 146–181 in P. J. Gleason (editor). Environments of South Florida: present and past. Miami Geological Society, Miami, Florida. GOLDSBOROUGH, L. G., AND G. G. C. ROBINSON. 1996. Pattern in wetlands. Pages 78–117 in R. J. Stevenson, M. L. Bothwell, and R. L. Lowe (editors). Algal ecology, freshwater benthic ecosystems. Academic Press, New York. HAMPTON, S. E. 2004. Habitat overlap of enemies: temporal patterns and the role of spatial complexity. Oecologia (Berlin) 138:475–484. HOLOMUZKI, J. R., AND S. H. MESSIER. 1993. Habitat selection by the stream mayfly Paraleptophlebia guttata. Journal of the North American Benthological Society 12:126–135. LEGENDRE, L., AND P. LEGENDRE. 1983. Numerical ecology. Elsevier Science, New York. LITTELL, R. C., G. A. MILLIKEN, W. W. STROUP, AND R. D. WOLFINGER. 1996. SAS system for mixed models. SAS Institute, Cary, North Carolina. MCCORMICK, P. V., R. B. E. SHUFORD, J. G. BACKUS, AND W. C. KENNEDY. 1998. Spatial and seasonal patterns of periphyton biomass and productivity in the northern Everglades, Florida, USA. Hydrobiologia 362:185–208. MCCORMICK, P. V., R. B. E. SHUFORD, AND P. S. RAWLIK. 2004. Changes in macroinvertebrate community structure and function along a phospho-
J. C. TREXLER
[Volume 24
rus gradient in the Florida Everglades. Hydrobiologia 529:113–132. MOSS, B. 1998. Ecology of fresh waters. 3rd edition. Blackwell Science, Oxford, UK. O’CONNOR, N. A. 1991. The effects of habitat complexity on the macroinvertebrates colonising wood substrates in a lowland stream. Oecologia (Berlin) 85:504–512. PECKARSKY, B. L. 1991. Habitat selection by streamdwelling predatory stoneflies. Canadian Journal of Fisheries and Aquatic Sciences 48:1069–1076. PIELOU, E. C. 1974. Populations and community ecology: principles and methods. Gordon and Breach Science Publishers, New York. RADER, R. B. 1999. The Florida Everglades: natural variability, invertebrate diversity, and foodweb stability. Pages 25–54 in D. P. Batzer, R. B. Rader, and S. A. Wissinger (editors). Invertebrates in freshwater wetlands of North America: ecology and management. John Wiley and Sons, New York. RADER, R. B. 2001. An introduction to wetland bioassessment and management. Pages 1–9 in R. B. Rader, D. P. Batzer, and S. A. Wissinger (editors). Bioassessment and management of North American freshwater wetlands. John Wiley and Sons, New York. SHARITZ, R. R., AND D. P. BATZER. 1999. An introduction to freshwater wetlands in North America and their invertebrates. Pages 1–24 in D. P. Batzer and S. A. Wissinger (editors). Invertebrates in freshwater wetlands of North America: ecology and management. John Wiley and Sons, New York. SMOCK, L. A., G. M. METZLER, AND J. E. GLADDEN. 1989. Role of debris dams in the structure and functioning of low-gradient headwater streams. Ecology 70:764–775. SOSZKA, G. J. 1975. The invertebrates on submerged macrophytes in three Masurian Lakes. Ekologia Polska 23:371–391. TREXLER, J. C., W. F. LOFTUS, C. F. JORDAN, J. CHICK, K. L. KANDL, T. C. MCELROY, AND O. L. BASS. 2001. Ecological scale and its implications for freshwater fishes in the Florida Everglades. Pages 153–181 in J. W. Porter and K. G. Porter (editors). The Everglades, Florida Bay, and coral reefs of the Florida Keys: an ecosystem sourcebook. CRC Press, Boca Raton, Florida. TURNER, A. M., J. C. TREXLER, C. F. JORDAN, S. J. SLACK, P. GEDDES, J. H. CHICK, AND W. F. LOFTUS. 1999. Targeting ecosystem features for conservation: standing crops in the Florida Everglades. Conservation Biology 13:898–911. Received: 8 July 2004 Accepted: 18 July 2005