density of host-seeking Ixodes scapularis Say nymphal stage ticks infected with Borrelia burgdorferi. Although many .... a MySQL database management system.
SAMPLING, DISTRIBUTION, DISPERSAL
Spatiotemporal Patterns of Host-Seeking Ixodes scapularis Nymphs (Acari: Ixodidae) in the United States M. A. DIUK-WASSER,1 A. G. GATEWOOD,1 M. R. CORTINAS,2 S. YAREMYCH-HAMER,3 J. TSAO,3 U. KITRON,2 G. HICKLING,3 J. S. BROWNSTEIN,4 E. WALKER,3 J. PIESMAN,5 AND D. FISH1
J. Med. Entomol. 43(2): 166Ð176 (2006)
ABSTRACT The risk of Lyme disease for humans in the eastern United States is dependent on the density of host-seeking Ixodes scapularis Say nymphal stage ticks infected with Borrelia burgdorferi. Although many local and regional studies have estimated Lyme disease risk using these parameters, this is the Þrst large-scale study using a standardized methodology. Density of host-seeking I. scapularis nymphs was measured by drag sampling of closed canopy deciduous forest habitats in 95 locations spaced among 2⬚ quadrants covering the entire United States east of the 100th meridian. Sampling was done in Þve standardized transects at each site and repeated three to six times during the summer of 2004. The total number of adults and nymphs of the seven tick species collected was 17,972, with 1,405 nymphal I. scapularis collected in 31 of the 95 sites. Peak global spatial autocorrelation values were found at the smallest lag distance (300 km) and decreased signiÞcantly after 1,000 km. Local autocorrelation statistics identiÞed two signiÞcant high-density clusters around endemic areas in the northeast and upper Midwest and a low-density cluster in sites south of the 39th parallel, where only 21 nymphs were collected. Peak nymphal host-seeking density occurred earlier in the southern than in the most northern sites. Spatiotemporal density patterns will be combined with Borrelia prevalence data as part of a 4-yr survey to generate a nationwide spatial risk model for I. scapularis-borne Borrelia, which will improve targeting of disease prevention efforts. KEY WORDS Ixodes scapularis nymphs, Borrelia burgdorferi, spatial clustering, phenology, risk mapping
THE BLACKLEGGED TICK, Ixodes scapularis Say is the principal vector for Borrelia burgdorferi, the causative agent of Lyme disease in North America. The number of Lyme disease cases rose from 17,029 cases in 2001 to 23,763 in 2002, a 40% increase (CDC 2004a), with a slight reduction in 2003 (21,273 cases) (CDC 2004b). Efforts to reduce the risk of Lyme disease are more cost effective when targeted toward areas and times of the year associated with a high frequency of contact between humans and host-seeking I. scapularis, particularly those infected with B. burgdorferi. The nymphal stage of I. scapularis is the only stage with a signiÞcant role as a vector for B. burgdorferi in North America (Stafford et al. 1998, Falco et al. 1999, Piesman 2002). Because of their small size, nymphs often escape detection long enough to transmit B. burgdorferi (Piesman 1987, Falco et al. 1996) and nymphal 1 Department of Epidemiology and Public Health, Yale School of Medicine, 60 College St., New Haven, CT 06520 Ð 8034. 2 College of Veterinary Medicine, University of Illinois, 2001 S. Lincoln Ave., Urbana, IL 61802. 3 Fisheries and Wildlife Department, Wildlife Disease Ecology and Conservation Medicine, Michigan State University, 13 Natural Resources Bldg., East Lansing, MI 48824. 4 ChildrenÕs Hospital Boston, Harvard Medical School, 300 Longwood Ave, Boston, MA 02115. 5 Entomology and Ecology Activity, Bacterial Zoonoses Branch, DVBIDÐNCIDÐCDC, P.O. Box 2087, Fort Collins, CO 80522.
host-seeking reaches its peak in spring and early summer, which coincides with increased human outdoor activity (Fish 1993). Drag sampling provides the most sensitive measure of potential contact between ticks and humans (Falco and Fish 1992, Schulze et al. 1997, Daniels et al. 2000). Therefore, mapping the spatial and temporal distribution of host-seeking nymphs collected by drag sampling provides an accurate estimate of human contact with potentially infected nymphs. Combined with tick infection prevalence data, an entomological risk index (ERI) (Mather et al. 1996a) can be calculated from nymphal density estimates. ERI constitutes an accurate and sensitive measure of risk to humans that, when mapped at a national scale, can provide an invaluable tool for targeting prevention efforts (Fish and Howard 1999). The construction of an accurate map showing the spatial distribution and relative abundance of I. scapularis in the United States has been limited by passive and nonstandardized collection methods (Dennis et al. 1998). Consequently, many of the cited reports of I. scapularis collections in areas previously free of Lyme disease (reviewed in Ginsberg 1993) may represent either new invasions by I. scapularis or overlooked populations. The only previous national mapping efforts have been based on a county-level map of the distribution of I. scapularis and I. pacificus based on
0022-2585/06/0166Ð0176$04.00/0 䉷 2006 Entomological Society of America
March 2006
DIUK-WASSER ET AL.: NYMPHAL I. scapularis HOST-SEEKING PATTERNS
indirect measurements of presence or abundance, including questionnaires to acarologists, health ofÞcials, and Lyme disease researchers, literature surveys, and review of the 1907Ð1995 National Tick Collection data (Dennis et al. 1998). To generate this map, counties were classiÞed as having either established populations (at least six ticks or ⬎1 life stage identiÞed), reported occurrence (at least one tick of any life stage identiÞed) or absent populations (no positive collection data). Fish and Howard (1999) improved this map by using a neighborhood analysis procedure that smoothed absent data and minimized reporting gaps. They also combined it with indirect measures of infection prevalence in ticks and human exposure to produce the National Lyme Disease Risk Map, created for the Centers for Disease Control and Prevention (CDC) Advisory Committee for Immunization Practices. The recommendations for vaccination against Lyme disease were based entirely upon the geographic distribution of Lyme disease risk delineated in this map. Using data from Dennis et al. (1998), Brownstein et al. (2003) developed a spatially predictive logistic model for I. scapularis in the United States using ground-observed environmental data to predict the probability of established I. scapularis populations. Standardized efforts to measure risk have been conducted at the state level, where human risk for Lyme disease has been quantiÞed based on vector distribution (Drew et al. 1988, Novak et al. 1991, Schulze et al. 1991, Kitron et al. 1992, Daniels et al. 1993, Bartholomew et al. 1995, Pinger et al. 1996, Riehle and Paskewitz 1996, Walker et al. 1998, Guerra et al. 2001) and human case reports (Glavanakov et al. 2001). In studies including both tick surveys and human case surveillance and/or canine serosurveys, these two measurements have been found to be correlated (Rand et al. 1991, White et al. 1991, Daniels et al. 1993, Nicholson and Mather 1996, Kitron and Kazmierczak 1997, Stafford et al. 1998, Guerra et al. 2001), although this has not always been the case (Mather et al. 1996b, Daniels et al. 1998, Brownstein et al. 2005). Inconsistencies between both types of measurements could be because of frequent misdiagnosis of Lyme disease (Barbour and Fish 1993, Steere et al. 1993) or differences in human behavior that change the probability of human exposure to infected ticks (Brownstein et al. 2005). The problem of risk mapping for Lyme disease is also complicated by the fact that the distribution of I. scapularis is expanding (Madhav et al. 2004). Areas of new invasion are quickly followed by human case reports (Lastavica et al. 1989, White et al. 1991). Here, we present the Þrst year results of a multiyear project to produce a spatial risk model for I. scapularisborne Borrelia throughout the known range of I. scapularis in the United States. Patterns of spatial clustering and host-seeking phenology of I. scapularis nymphs are presented. Future project objectives include combining these results with data on B. burgdorferi infection prevalence and genotype to estimate risk. This project promises to provide a reliable national risk map that can be used as a guide to geographically prioritize prevention efforts. It will pro-
167
vide an improved delineation of risk over the Fish and Howard (1999) National Lyme Disease Risk Map, because it will include both host-seeking nymphal tick density and infection prevalence. Materials and Methods Study Area. The study area encompassed the portion of the United States east of the 100th meridian, which includes the known distribution of I. scapularis. Ninety-Þve sites were sampled throughout the study area. To distribute the sites uniformly, a grid composed of 95 2⬚ (⬇160 by 160 km) quadrants (Fig. 1) was overlaid on a map of the United States and one site within each of the quadrants was randomly selected for sampling. All data sets used in the analysis were projected to an equidistant conic projection with 34 and 40⬚ N as standard parallels to increase the accuracy of the distance measurements for the spatial analyses. The sampling sites were areas of closed canopy deciduous forest within state parks, state forests, or other public access natural areas. Public areas were identiÞed from the Census 2000 Tiger line Þles. To select which parks to sample, the following procedure was followed. First, the area of deciduous or mixed deciduous forest within each park was calculated from the National Land Cover Characterization database produced by the United States Geological Survey. This is a 21-class land cover classiÞcation scheme based on Landsat Thematic Mapper satellite data acquired from the early to mid-1990s, including both leaf-on and leaf-off scenes (http://landcover.usgs.gov/ natllandcover.asp). The 30-m resolution of this imagery allowed for calculation of the area of deciduous forest cover even in small state parks. Within each quadrant, all parks were ranked according to total forested area, and a site was randomly selected from among the top 20%. Where suitability models for I. scapularis establishment were available, they were considered for site selection. Site selection was restricted to areas assigned a probability of containing habitat suitable for I. scapularis establishment of ⬎50% according to the Brownstein et al. (2003) model in the Northeast and the Guerra et al. (2001) model in Wisconsin and Illinois. Sampling Protocol. Sampling was done between 19 May and 27 August 2005. Each site was scheduled to be sampled four to six times over the summer, although this was not always possible (see Results). Nymphal densities were estimated at each site by dragging a 1-m2 cloth over a Þxed distance (Daniels and Fish 1990). Maps of the parks were used to select Þve areas for sampling (Fig. 2). From the start of a trail in each area, a random number was drawn to determine the number of steps to be walked to the start of a transect. The geographic coordinates of the transect start relative to the World Geodetic System 1984 datum were recorded using a handheld Global Positioning System (GPS) receiver (eTrex, Garmin International Inc., Olathe, KS) with a position accuracy between 3 and 5 m. Another random number was drawn to determine the transect orientation (angle)
168
JOURNAL OF MEDICAL ENTOMOLOGY
Vol. 43, no. 2
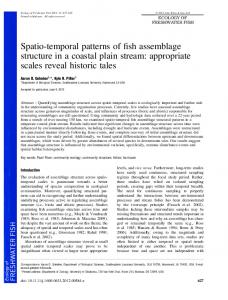
Fig. 1. Density per 1,000 m2 (log scale) of the most abundant species of ticks (nymphs and adults pooled) collected in each of the 95 study sites. The grid used to select the sampling sites is displayed in the background as well as the 100th meridian, western limit of the study area.
relative to the trail. Two parallel 100-m transects were dragged in each of Þve locations, for a total sample area of 1,000 m2 per site per visit. The cloth was inspected every 20 m, and all nymphs and adults from each transect were put into bar-coded vials with 70% ethanol. Sampling was performed on rain-free days, avoiding early morning and midday hours to minimize the potentially confounding effects of heavy dew and extreme heat on sampling efÞciency. Ticks from each transect/date were identiÞed to species and stage and sorted into separate bar-coded vials. Temperature, relative humidity, and atmospheric pressure were recorded upon arrival and departure from each sampling site using a digital weather meter (Kestrel 4000, Nielsen-Kellerman, Boothwyn, PA). Time was recorded at the beginning and end of each transect. Saturation deÞcit, an integrated measure of the drying power of the atmosphere, was calculated according to Randolph and Storey (1999). Data Storage and Manipulation. Data were stored in a MySQL database management system. The bar code on each tube was linked in the database to all other data related to that collection (e.g., environmental data and geographic location). For analysis, the online database was exported to ArcGIS 9 Desktop, an inte-
grated collection of geographic information system (GIS) software products (ESRI Inc., Redlands, CA). ArcInfo was used to display and manipulate the data and ArcToolbox spatial statistics tools for spatial analysis. Further statistical analyses were performed using Stata/SE 8.0 (Stata Co., College Station, TX). Statistical Analysis. MoranÕs I (Cliff and Ord 1973, 1981) was used to measure whether I. scapularis density was spatially clustered. This index measures spatial autocorrelation, that is, the degree of interdependence between values of a variable at different geographic scales. As distance increases, the value of MoranÕs I is expected to decrease, because increasing distance diminishes correlation. MoranÕs I statistic was calculated as follows:
冘 冉冘 冊冉冘
N I共d兲 ⫽
ij
ij
wij 共d兲共xi ⫺ x 兲共xj ⫺ x 兲
wij 共d兲
i
共xi ⫺ x 兲2
冊
i⫽j
[1]
where N is the total number of sampling sites; xi and xj are the ln(I. scapularis mean density per site ⫹ 0.5) in sampling sites i and j, respectively; x is the sample mean for all x values; d is the Þxed distance interval;
March 2006
DIUK-WASSER ET AL.: NYMPHAL I. scapularis HOST-SEEKING PATTERNS
169
Fig. 2. Illustration of sampling protocol within each sampling site. Five trails were identiÞed in the Þve largest areas of deciduous forest in the park. In each trail two parallel 100-m transects were dragged for ticks and the start of each transect was recorded with a GPS. Both the number of steps to the start of the transect and the angle were determined using a random number generator.
and wij is a weight based on the inverse of the distance between sites. The logarithmic transformation reduced skewness and kurtosis of the tick distribution although normality was not achieved. MoranÕs I ranges from ⫺1 to 1 and equals 0 when there is no spatial autocorrelation. Positive values indicate that variation in tick densities is dependent on the distances between sites; sites with high tick density are clustered in space as are those with low tick densities, with higher values indicating a stronger relationship. A spatial correlogram, a series of MoranÕs I measurements evaluated at increasing distances between sampling sites, was used to determine the distance at which spatial effects are maximized. The distance intervals were set at 300 km to ensure that all Þrst neighbors were included in the Þrst lag. MoranÕs I does not identify the speciÞc locations of pockets of clustering. Local indicators of spatial autocorrelation (LISA) (Anselin 1995) provide a way to identify patterns at a local scale. Local spatial clusters are deÞned by Anselin (1995) as sets of continuous locations for which the LISA is signiÞcant. The Gi*
LISA (Getis and Ord 1992, Ord and Getis 1995) was used to identify the locations of clusters of sites with high and low I. scapularis nymphal density. Gi* was calculated for all sampling sites as follows:
冘 n
G*i 共d兲 ⫽
wij 共d兲xj
j⫽1
冘
for all j
n
[2]
xj
j⫽1
where i is the focal sampling site, xj is the ln(I. scapularis mean density per site ⫹ 0.5) in sampling site j (including the focal sampling site xi), d is the Þxed distance interval, and wij is a weight that is 1 when sites are within distance d of the focal point and 0 otherwise. The null hypothesis states that the sum of values at all j sites within radius d of i is equal to that expected by chance given all the values in the entire study area. Gi* was calculated for the same distance classes as
170
JOURNAL OF MEDICAL ENTOMOLOGY
Table 1. Numbers of adults and nymphs of all tick species collected during the study Species
Adults
Nymphs
Total
I. scapularis Dermacentor variabilis (Say) Amblyomma americanum (L.) Amblyomma maculatum Koch Haemaphysalis leporispalustris (Packard) Ixodes dentatus Marx Ixodes muris Bishopp & Smith Total for all species:
135 492 1,580 4 3
1,405 9 14,341 1 0
1,540 501 15,921 5 3
1 1 2,216
0 0 15,756
1 1 17,972
MoranÕs I. To determine whether clustering was signiÞcant, Gi was redeÞned as a standard variable, for which the expected value in the absence of clustering is 0. However, signiÞcance of the Gi* (d) about the selected focus site is not clear-cut, especially when global autocorrelation is signiÞcant and the variable distribution is not normal. Thus, we used this statistic only as an exploratory tool. Nymphal I. scapularis Host-Seeking Phenology. The seasonal pattern of host-seeking nymphal density is expected to Þt a polynomial function, with an increase during late spring, a peak in early June, and a decrease during midsummer (Fish 1993). However, in those sites where collections started at the time of peak density, or soon after, a negative linear function may result in a better Þt. For those sites visited four or more times, with Þve samples per visit and a total of ⬎20 nymphs collected, the Þt to linear and quadratic regressions were compared, and the function that resulted in a better Þt was plotted. Higher polynomials were not considered appropriate given the small sample size. Twenty nymphs were arbitrarily deÞned as the minimum number to detect phenological patterns based on examination of the plots. Results Total Tick Collection. The total number of adults and nymphs of all seven tick species collected was 17,972 (Table 1); the total area drag-sampled was 431,000 m2 in 38 states. The relative proportions of the different species varied spatially, with I. scapularis dominating in the Northeast and upper Midwest, A. americanum dominating in the south, and D. variabilis being widely distributed (Fig. 1). A cautionary point is that sampling was done solely in deciduous forests, excluding grassy meadows, old ÞeldÐforest ecotones, and artiÞcial habitations, where D. variabilis would have been the dominant species found (Sonenshine 1993), thus biasing the sampling toward the other two species. Analyses of tick species other than I. scapularis will be reported elsewhere. Nymphal I. scapularis Density. In total, 1,405 I. scapularis nymphs were collected in 31 of the 95 sites studied. For comparison with other studies, sites were classiÞed into terciles, based on nymphal I. scapularis density: low density, when fewer than 0.7 nymph per 1,000 m2 was collected; intermediate density, when between 0.7 and 8.2 nymphs per 1,000 m2 were col-
Vol. 43, no. 2
lected; and high density, when between 8.2 and 48 (Fig. 4). The average density of nymphs in positive sites was 9.9 nymphs per 1,000 m2. Highest densities were observed in the northeast and mid-Atlantic regions (18.2 per 1,000 m2), with the highest values in Westchester County, New York, and southern Maine; and in the upper Midwest (11.9 per 1,000 m2), especially in Wisconsin and Minnesota (Fig. 4). Only 21 I. scapularis nymphs were collected in the 16 states south of the 39th parallel despite 223,400 m2 of drag sampling (0.09 per 1,000 m2) (see location of this parallel in Fig. 4): seven nymphs in Virginia, one in South Carolina, one in Georgia, one in Alabama, Þve in Oklahoma, and six in Missouri. MoranÕs I values indicated signiÞcant spatial clustering of nymphal I. scapularis density at all distances examined in the correlogram (Fig. 3). Peak MoranÕs I values were found at the smallest lag distance (300 km) and declined to almost 0 at 1,000 km, which implies that there was little association between tick density at sites located ⬎1,000 km away. The local spatial statistic Gi* allowed for examination of the actual location and approximate scale of both the highand low-density clusters, at successively large distances (Fig. 4). Gi* values at the 300-km distance class identiÞed two signiÞcant positive clusters that closely traced the empirical density values. Only one negative site in eastern Pennsylvania showed signiÞcantly positive Gi* values, and all positive I. scapularis sites, except the “southern” sites and a site in north central Iowa, showed positive Gi* values. A signiÞcant lowdensity cluster was identiÞed in the southern part of the study area when larger distances were used to calculate Gi* (900 and 1,200 km). At these larger lag distances, nonsigniÞcant low-density sites were either located between high-density sites in the north and the low-density cluster in the south or near the map border, where they did not reach signiÞcance because of the smaller number of neighbors. The mean number of nymphal ticks collected per site in positive sites (n⫽ 31) was signiÞcantly and negatively correlated with mean temperature (Spear-
Fig. 3. Spatial correlogram showing the dependence of MoranÕs I, the spatial autocorrelation coefÞcient, on the distance between sampling sites, grouped into 300-km categories. Spatial autocorrelation exceeds zero signiÞcantly for all lags.
March 2006
DIUK-WASSER ET AL.: NYMPHAL I. scapularis HOST-SEEKING PATTERNS
171
Fig. 4. Mean density of host-seeking I. scapularis nymphs per 1,000 m2 dragged in each site. Density categories are no ticks (circle with cross), low (0Ð0.7 nymph per 1,000 m2), moderate (0.7Ð8.2 nymphs per 1,000 m2), and high (8.2Ð48 nymphs per 1,000 m2). The four subÞgures show clustering patterns of nymphal I. scapularis density based on the Getis-Ord Gi* statistic at different distances (d). Quadrants were colored according to the Gi* value for the sampling site within them. Red quadrants (Gi* higher than 1.96) represent signiÞcant high-density clusters, green quadrants (Gi* lower than ⫺1.96) represent signiÞcant negative clusters, yellow areas (Gi* between 0 and 1.96) are high-density clusters that are not statistically signiÞcant, and light blue areas (Gi* between ⫺1.96 and 0) are low-density clusters that are not statistically signiÞcant.
manÕs rho ⫽ ⫺0.64, P ⬍ 0.001) and saturation deÞcit (SpearmanÕs rho ⫽ ⫺0.72, P ⬍ 0.001) at the site and positively correlated with latitude (SpearmanÕs rho ⫽ 0.53, P ⬍ 0.01). It was not correlated with either mean relative humidity or time of collection. Nymphal I. scapularis Phenology. Most sites were sampled three or more times during the season, except six sites visited twice and one site visited once, because of rainy weather. The phenology of nymphal I. scapularis in those sites with four or more visits and a total of ⬎20 nymphs collected (n ⫽ 12) is shown in Fig. 5A for the northeast and in Fig. 5B for the upper Midwest. Nymphal density showed a better Þt (higher R2) to a quadratic than a linear regression at four of the most northern sites (Paul Bunyan, Foot Hills State forests in the upper Midwest, Crescent Beach, and Verona Beach State Parks in the northeast). Data from all other sites showed a better Þt to a linear regression, likely because only the declining part of the phenological curve was captured in these sites. Peak nymphal density (deÞned as the maximum density
recorded) occurred between 4 June and 19 July 2004 in the four “northern” sites and before 22 June in the “southern” sites. Discussion Two statistically signiÞcant clusters of high-density host-seeking nymphal I. scapularis were identiÞed along coastal areas in the northeastern United States and in an upper Midwest area, including Wisconsin and Minnesota. These are known I. scapularis endemic areas, but previous studies did not use a standardized sampling protocol and spatial analytical tools to quantitatively assess the locations and extents of high-risk areas based on host-seeking nymphs. In addition, our study includes the southern states, where host-seeking I. scapularis nymphs are known to be difÞcult to collect (Piesman 2002). Mapping of statistically signiÞcant low-density host-seeking nymphal clusters in the south deÞned transitional areas between northern and southern clusters that require further resolution.
172
JOURNAL OF MEDICAL ENTOMOLOGY
Vol. 43, no. 2
Fig. 5A. Density of I. scapularis nymphs per 1,000 m2 (y-axis) collected in each visit (date in x-axis) from northeast sampling sites. The best Þtting curve (linear or quadratic) is shown for each collection. R2 values are shown for those curves that had a signiÞcant Þt (P ⬍ 0.05).
The observed patterns of spatial dependence can provide clues to the processes underlying the current distribution of host-seeking nymphal I. scapularis. In the northeast and upper Midwest, generally monotonic decline of MoranÕs I with distance indicates clinal variation. The range of I. scapularis is known to be expanding (Spielman et al. 1985, Dennis et al. 1998). SigniÞcant high-density clusters were identiÞed around the two areas from which the earliest northern collections of I. scapularis were made in the 1970s, one in coastal New England and the other in northwestern Wisconsin (Spielman et al. 1985). The decrease in density away from these areas and the highest correlation between sites at the smallest spatial distance (300 km) are consistent with expansion from focal areas. Kitron and Kazmierczak (1997) found that the distance of peak spatial autocorrelation for tick endemicity was 160 km in Wisconsin, and Glavanakov et al. (2001) found that spatial autocorrelation of incidence rates in New York state were signiÞcant and positive up to 120 km. The minimum separation between our sampling sites did not allow for detection of spatial patterns at distances smaller than 300 km. Increasing the density of sampling sites scheduled in future years of this project will allow for detection of Þner spatial structure and a more clear delineation of the boundaries of these clusters.
I. scapularis nymphs were rarely collected south of the 39th parallel (Fig. 4) (21 nymphal I. scapularis collected in 223,400 km of drag sampling versus 1,384 nymphs collected in 207,600 km of drag sampling north of this latitude). Because of the uniform pattern of zero or very low nymphal collections in most sites, low-density clusters were only detected when larger distances were used in the calculation of Gi*. Although I. scapularis populations are present in the southern states, nearly all of the collections reported in previous studies of host-seeking ticks were of adults (Dennis et al. 1998). Questing nymphal I. scapularis are difÞcult to collect by drag sampling in the south (Piesman 2002) and are very rarely found on people (Felz et al. 1996). Patterns of I. scapularis density in the northeast were generally consistent with those found in previous studies. The absence of I. scapularis in the Pennsylvania samples was likely because of the highly fragmented distribution of ticks in that state (Dennis et al. 1998), the lack of sampling sites located in the southeastern fringe classiÞed as “intermediate risk” by Daniels et al. (1993), and the relatively high altitude (between 378 and 680 m) of the three randomly selected sites. High (between 8.2 and 48 nymphs per 1,000 m2) nymphal densities were collected in Westchester County, in southern New York state, an
March 2006
DIUK-WASSER ET AL.: NYMPHAL I. scapularis HOST-SEEKING PATTERNS
173
Fig. 5B. Density of I. scapularis nymphs per 1,000 m2 (y-axis) collected in each visit (date in x-axis) from upper Midwest sampling sites. The best Þtting curve (linear or quadratic) is shown for each collection. R2 values are shown for those curves that had a signiÞcant Þt (P ⬍ 0.05).
area where Lyme disease has been endemic since 1982 (Williams et al. 1986). The two northern sites in New York showed low (fewer than 0.7 nymphs per 1,000 m2) and high densities of nymphs, whereas the more westerly site was negative, matching previously reported patterns of a decline in risk from east to west in New York state (White et al. 1991, Daniels et al. 1993, Dennis et al. 1998, Glavanakov et al. 2001). In Maine, nymphal densities were high in Crescent Beach State Park, which is in a known endemic coastal area (Holman et al. 2004). Nymphs were absent in the northern site in Maine, which is consistent with the absence of tick submissions reported by Rand et al. (1991), but not with its classiÞcation as “established” in Penobscot County by Dennis et al. (1998). The high density site in Maryland was located in the upper eastern coastal plains, where I. scapularis is well established (Amerasinghe et al. 1992, Glass et al. 1994, Dennis et al. 1998). Moderate (between 0.7 and 8.2 nymphs per 1,000 m2) nymphal densities were observed in the inland site sampled in Worcester County, Massachusetts (80 km from the coast). This is consistent with the classiÞcation as “reported” by Dennis et al. (1998) and as intermediate risk by Daniels et al. (1993). Intermedi-
ate tick densities were also found in the site in ChesterÞeld County, Virginia (60 km from the coast). Little is known about the occurrence of I. scapularis away from coastal areas in Virginia (Sonenshine et al. 1995). Future intensive sampling may help clarify the pattern and extent of I. scapularis inland expansion in these areas. In the upper Midwest cluster, all four sites in Wisconsin were positive for I. scapularis. This was in accordance with previous studies (Guerra et al. 2002), which found positive sites in western and southern Wisconsin and in some counties in the east, including Sheboygan County, where the most eastern site was located. Ticks were collected in all Þve Minnesota sites. I. scapularis had been recognized in Beltrami, Carlton, and Cass counties (Sanders and Guilfoile 2000) as well as Sherburne County (D. Neitzel, personal communication), but the collection from Kandiyohi County was the Þrst (D. Neitzel, personal communication). The only collections of I. scapularis in Michigan were in Menominee County, consistent with the presence of a focus of Lyme disease there (Walker et al. 1994, 1998). Both sites in Illinois were positive, in accordance with previous reports: one in Putnam County (Cortinas et al. 2002) and the other in
174
JOURNAL OF MEDICAL ENTOMOLOGY
Clark County (Illinois Department of Public Health 2005). I. scapularis were collected in Jasper and Newton counties in northwestern Indiana, consistent with reports of an established population in this area (Pinger et al. 1991, 1996). The seasonal host-seeking phenology must be considered in the calculation of risk; risk is null when no nymphs are host seeking, irrespective of the actual density of nymphs in a site, and increases with hostseeking tick density in endemic areas (Mather et al. 1996a). Variability in host-seeking phenology related to geography, climate, or altitude has been described previously for I. pacificus (Eisen et al. 2003) and for I. ricinus (Randolph et al. 2000; Jouda et al. 2004a,b). The extensive range of this study allowed for the detection of geographic differences in nymphal I. scapularis host-seeking phenology. The four most northern sites sampled showed a later start in nymphal host seeking, which permitted the capture of the full seasonal curve. A quadratic Þt best represented the expected change in host-seeking phenology in these sites and allowed a more accurate identiÞcation of the time of peak nymphal activity and more accurate density estimation. In contrast, a decreasing linear trend was observed in the rest of the sites, where our sampling missed the early rise in host-seeking nymphal activity. Mean number of I. scapularis over the Þve transects and several sampling dates was used as an estimate of density at each site. Averaging over Þve transects accounted in part for the variability within each site. In terms of seasonal variation, the density estimate is expected to be more accurate in those sites where the full phenological curve was captured, although it may not be as accurate for those with declining densities, where the full curve was not captured. Peak nymphal activity in the northeast is in early June (Fish 1993). Because most collections started in early June and highest nymphal densities were recorded then, it can be assumed that the complete right side of the curve was captured. Including the left part of the curve is expected to produce the same mean density value, so bias may not be signiÞcant. In the future, however, sampling will be started earlier in the season in an effort to capture the full phenological curve and estimate density by integrating values over the entire season. The good Þt to a quadratic curve for Verona Beach State Park density data (visited six times) and acceptable Þt for Foot Hills State Forest (visited Þve times) suggest that Þve or six visits produce a fairly accurate density estimate. A preliminary estimate of I. scapularis host-seeking nymphal density was generated for its known range in the United States during the Þrst year of this project. Given the low number of sampling points that were distributed over an extensive geographic area, there were necessarily “gaps” in the model. In future years, we will sample additional areas to improve the resolution of the clusters by more clearly deÞning the levels of risk within the known clusters and more accurately deÞning the boundary areas of the clusters, into which the range of I. scapularis might potentially expand.
Vol. 43, no. 2 Acknowledgments
We gratefully acknowledge the Þeld assistants who made this project possible: Charles Abadam, Theresa Boccia, Andrea Bombard, Nathan Burkett, Tony Cappa, Nick Carl, Joseph Goddard, Katherine Hanson, Jennifer Howard, Melissa Johnson, Ryan Kirkpatrick, Laura Leighton, Charles Lubelczyk, Tonya Mixson, Christina North, Ben Petersburg, Paula Poney, Kimberly Powers, Krsna Rangarajan, Thien Sam, Trisha Schales, Sarah Schwerdt, Kara Tadin and Amanda Tucker. Thanks also to their advisors: Sandra Allen, Greg Dasch, Tom Daniels, J. Carl Fox, Jerome Goddard, Patrick Guilfoile, Malcolm Hunter, Gary Mullen, David Neitzel, Peter Rand, Aravinda da Silva, Daniel Sonenshine, Otto Strey, and Peter Teal. Special thanks to Tim Andreadis for tick identiÞcation, Carlos Diuk for database support, Ray Poupedis and Kirby Stafford for technical assistance, and Russell Barbour for arranging collection permits. We also acknowledge Ben Beard, Klara Hanincova, and Laura Krueger for helpful comments. This project was funded by CDC-Division of Vector-Borne Infectious Diseases Cooperative Agreement No. CI00171-01.
References Cited Amerasinghe, F. P., N. L. Breisch, A. F. Azad, W. F. Gimpel, M. Greco, K. Neidhardt, B. Pagac, J. Piesman, J. Sandt, T. W. Scott, et al. 1992. Distribution, density, and Lymedisease spirochete infection in Ixodes dammini (Acari: Ixodidae) on white-tailed deer in Maryland. J. Med. Entomol. 29: 54 Ð 61. Anselin, L. 1995. Local Indicators of spatial associationÑ Lisa. Geogr. Anal. 27: 93Ð115. Barbour, A. G., and D. Fish. 1993. The biological and social phenomenon of Lyme disease. Science (Wash. DC) 260: 1610 Ð1616. Bartholomew, D. M., W. A. Rowley, M. G. Novak, and K. B. Platt. 1995. Ixodes scapularis and other ticks (Acari: Ixodidae) associated with Lyme disease in Iowa. J. Vector Ecol. 20: 1Ð 6. Brownstein, J. S., T. R. Holford, and D. Fish. 2003. A climate-based model predicts the spatial distribution of the Lyme disease vector Ixodes scapularis in the United States. Environ. Health Perspect. 111: 1152Ð1157. Brownstein, J. S., D. K. Skelly, T. R. Holford, and D. Fish. 2005. Forest fragmentation predicts local scale heterogeneity of Lyme disease risk. Oecologia 146: 469 Ð 475. [CDC] Centers for Disease Control and Prevention. 2004a. Lyme disease ÐUnited States 2001, 2002. Morb. Mortal. Wkly. Rep. 53: 365Ð369. [CDC] Centers for Disease Control and Prevention. 2004b. Reported cases of notiÞable diseases, by geographic division and area ÐUnited States, 2003. Morb. Mortal. Wkly. Rep. 53: 693. Cliff, A. D., and J. K. Ord. 1973. Spatial autocorrelation. Pion Press, London, United Kingdom. Cliff, A. D., and J. K. Ord. 1981. Spatial processes: models and applications. Pion Press, London, United Kingdom. Cortinas, M. R., M. A. Guerra, C. J. Jones, and U. Kitron. 2002. Detection, characterization, and prediction of tickborne disease foci. Int. J. Med. Microbiol. 291: 11Ð20. Daniels, T. J., and D. Fish. 1990. Spatial distribution and dispersal of unfed larval Ixodes dammini (Acari Ixodidae) in southern New York. Environ. Entomol. 19: 1029 Ð1033. Daniels, T. J., D. Fish, J. F. Levine, M. A. Greco, A. T. Eaton, P. J. Padgett, and D. A. Lapointe. 1993. Canine exposure to Borrelia burgdorferi and prevalence of Ixodes dammini (Acari, Ixodidae) on deer as a measure of Lyme disease
March 2006
DIUK-WASSER ET AL.: NYMPHAL I. scapularis HOST-SEEKING PATTERNS
risk in the northeastern United States. J. Med. Entomol. 30: 171Ð178. Daniels, T. J., T. M. Boccia, S. Varde, J. Marcus, J. H. Le, D. J. Bucher, R. C. Falco, and I. Schwartz. 1998. Geographic risk for Lyme disease and human granulocytic ehrlichiosis in southern New York State. Appl. Environ. Microbiol. 64: 4663Ð 4669. Daniels, T. J., R. C. Falco, and D. Fish. 2000. Estimating population size and drag sampling efÞciency for the blacklegged tick (Acari: Ixodidae). J. Med. Entomol. 37: 357Ð363. Dennis, D. T., T. S. Nekomoto, J. C. Victor, W. S. Paul, and J. Piesman. 1998. Reported distribution of Ixodes scapularis and in Ixodes paciÞcus (Acari: Ixodidae) in the United States. J. Med. Entomol. 35: 629 Ð 638. Drew, M. L., K. I. Loken, R. F. Bey, and R. D. Swiggum. 1988. Ixodes dammini Ð occurrence and prevalence of Infection with Borrelia spp. in Minnesota. J. Wildl. Dis. 24: 708 Ð710. Eisen, R. J., L. Eisen, M. B. Castro, and R. S. Lane. 2003. Environmentally related variability in risk of exposure to Lyme disease spirochetes in northern California: effect of climatic conditions and habitat type. Environ. Entomol. 32: 1010 Ð1018. Falco, R. C., and D. Fish. 1992. A comparison of methods for sampling the deer tick, Ixodes dammini, in a Lyme disease endemic area. Exp. & Appl. Acarology 14: 165Ð173. Falco, R. C., D. Fish, and J. Piesman. 1996. Duration of tick bites in a Lyme disease-endemic area. Am. J. Epidemiol. 143: 187Ð182. Falco, R. C., D. F. McKenna, T. J. Daniels, R. B. Nadelman, J. Nowakowski, D. Fish, and G. P. Wormser. 1999. Temporal relation between Ixodes scapularis abundance and risk for Lyme disease associated with erythema migrans. Am. J. Epidemiol. 149: 771Ð776. Felz, M. W., L. A. Durden, and J. H. Oliver. 1996. Ticks parasitizing humans in Georgia and South Carolina. J. Parasitol. 82: 505Ð508. Fish, D. 1993. Population ecology of Ixodes dammini. In H. S. Ginsberg [ed.], Ecology and environmental management of Lyme disease. Rutgers University Press, New Brunswick, NJ. Fish, D, and C. Howard. 1999. Methods used for creating a national Lyme disease risk map. Morb. Mortal. Wkly. Rep. 48: 21Ð24. Getis, A., and J. K. Ord. 1992. The analysis of spatial association by use of distance statistics. Geogr. Anal. 24: 189 Ð 206. Ginsberg, H. S. 1993. Transmission risk of Lyme disease and implications for tick management. Am. J. Epidemiol. 138: 65Ð73. Glass, G. E., F. P. Amerasinghe, J. M. Morgan, and T. W. Scott. 1994. Predicting Ixodes scapularis abundance on whitetailed deer using geographic information systems. Am. J. Trop. Med. Hyg. 51: 538 Ð544. Glavanakov, S., D. J. White, T. Caraco, A. Lapenis, G. R. Robinson, B. K. Szymanski, and W. A. Maniatty. 2001. Lyme disease in New York state: spatial pattern at a regional scale. Am. J. Trop. Med. Hyg. 65: 538 Ð545. Guerra, M. A., E. D. Walker, and U. Kitron. 2001. Canine surveillance system for Lyme borreliosis in Wisconsin and northern Illinois: geographic distribution and risk factor analysis. Am. J. Trop. Med. Hyg. 65: 546 Ð552. Guerra, M., E. Walker, C. Jones, S. Paskewitz, M. R. Cortinas, A. Stancil, L. Beck, M. Bobo, and U. Kitron. 2002. Predicting the risk of Lyme disease: Habitat suitability for Ixodes scapularis in the north central United States. Emerg. Infect. Dis. 8: 289 Ð297.
175
Holman, M. S., D. A. Caporale, J. Goldberg, E. Lacombe, C. Lubelczyk, P. W. Rand, and R. P. Smith. 2004. Anaplasma phagocytophilum, Babesia microti, and Borrelia burgdorferi in Ixodes scapularis, southern coastal Maine. Emerg. Infect. Dis. 10: 744 Ð746. Illinois Department of Public Health. 2005. Known geographic distribution of Ixodes scapularis by county in Illinois 2005. (http://www.idph.state.il.us/envhealth/ tick_dist.htm). Jouda, F., J. L. Perret, and L. Gern. 2004a. Density of questing Ixodes ricinus nymphs and adults infected by Borrelia burgdorferi sensu lato in Switzerland: spatio-temporal pattern at a regional scale. Vector Borne Zoonotic Dis. 4: 23Ð32. Jouda, F., J. L. Perret, and L. Gern. 2004b. Ixodes ricinus density, and distribution and prevalence of Borrelia burgdorferi sensu lato infection along an altitudinal gradient. J. Med. Entomol. 41: 162Ð169. Kitron, U., and J. J. Kazmierczak. 1997. Spatial analysis of the distribution of Lyme disease in Wisconsin. Am. J. Epidemiol. 145: 558 Ð566. Kitron, U., C. J. Jones, J. K. Bouseman, J. A. Nelson, and D. L. Baumgartner. 1992. Spatial analysis of the distribution of Ixodes-dammini (Acari, Ixodidae) on Whitetailed deer in Ogle County, Illinois. J. Med. Entomol. 29: 259 Ð266. Lastavica, C. C., M. L. Wilson, V. P. Berardi, A. Spielman, and R. D. Deblinger. 1989. Rapid emergence of a focal epidemic of Lyme disease in coastal Massachusetts. N. Engl. J. Med. 320: 133Ð137. Madhav, N. K., J. S. Brownstein, J. I. Tsao, and D. Fish. 2004. A dispersal model for the range expansion of blacklegged tick (Acari: Ixodidae). J. Med. Entomol. 41: 842Ð 852. Mather, T. N., M. C. Nicholson, E. F. Donnelly, and B. T. Matyas. 1996a. Entomologic index for human risk of Lyme disease. Am. J. Epidemiol. 144: 1066 Ð1069. Mather, T. N., M. C. Nicholson, R. J. Hu, and N. J. Miller. 1996b. Entomological correlates of Babesia microti prevalence in an area where Ixodes scapularis (Acari: Ixodidae) is endemic. J. Med. Entomol. 33: 866 Ð 870. Nicholson, M. C., and T. N. Mather. 1996. Methods for evaluating Lyme disease risks using geographic information systems and geospatial analysis. J. Med. Entomol. 33: 711Ð 720. Novak, M. G., W. A. Rowley, K. B. Platt, D. M. Bartholomew, and M. D. Senne. 1991. Ixodes dammini (Acari, Ixodidae) and Borrelia burgdorferi in Iowa. J. Iowa Acad. Sci. 98: 99 Ð101. Ord, J. K., and A. Getis. 1995. Local spatial autocorrelation statistics Ð distributional issues and an application. Geogr. Anal. 27: 286 Ð306. Piesman, J., T. N. Mather, R. J. Sinsky, and A. Spielman. 1987. Duration of tick attachment and Borrelia burgdorferi transmission. J. Clin. Microbiol. 25: 557Ð558. Piesman, J. 2002. Ecology of Borrelia burgdorferi sensu lato in North America. In J. S. Gray, O. Kahl, R. S. Lane, and G. Stanek [ed.], Lyme borreliosis. Biology, epidemiology and control. CABI, New York. Pinger, R. R., J. Holycross, J. Ryder, and M. Mummert. 1991. Collections of adult Ixodes dammini in Indiana, 1987Ð 1990, and the Isolation of Borreli burgdorferi. J. Med. Entomol. 28: 745Ð749. Pinger, R. R., L. Timmons, and K. Karris. 1996. Spread of Ixodes scapularis (Acari: Ixodidae) in Indiana: collections of adults in 1991Ð1994 and description of a Borrelia burgdorferi-infected population. J. Med. Entomol. 33: 852Ð 855.
176
JOURNAL OF MEDICAL ENTOMOLOGY
Rand, P. W., R. P. Smith, and E. H. Lacombe. 1991. Canine seroprevalence and the distribution of Ixodes-dammini in an area of emerging Lyme disease. Am. J. Public Health 81: 1331Ð1334. Randolph, S. E., and K. Storey. 1999. Impact of microclimate on immature tick-rodent host interactions (Acari: Ixodidae): implications for parasite transmission. J. Med. Entomol. 36: 741Ð748. Randolph, S. E., R. M. Green, M. F. Peacey, and D. J. Rogers. 2000. Seasonal synchrony: the key to tick-borne encephalitis foci identiÞed by satellite data. Parasitology 121: 15Ð23. Riehle, M., and S. M. Paskewitz. 1996. Ixodes scapularis (Acari: Ixodidae): status and changes in prevalence and distribution in Wisconsin between 1981 and 1994 measured by deer surveillance. J. Med. Entomol. 33: 933Ð938. Sanders, K. D., and P. G. Guilfoile. 2000. New records of the blacklegged tick, Ixodes scapularis (Acari: Ixodidae) in Minnesota. J. Vector Ecol. 25: 155Ð157. Schulze, T. L., R. C. Taylor, G. C. Taylor, and E. M. Bosler. 1991. Lyme disease Ð a proposed ecological index to assess areas of risk in the northeastern United States. Am. J. Public Health 81: 714 Ð718. Schulze, T. L., R. A. Jordan, and R. W. Hung. 1997. Biases associated with several sampling methods used to estimate abundance of Ixodes scapularis and Amblyomma americanum (Acari: Ixodidae). J. Med. Entomol. 34: 615Ð 623. Sonenshine, D. E. 1993. Biology of ticks. Oxford University Press, New York. Sonenshine, D. E., R. E. Ratzlaff, J. Troyer, S. Demmerle, E. R. Demmerle, W. E. Austin, S. Tan, B. A. Annis, and S. Jenkins. 1995. Borrelia burgdorferi in eastern Virginia Ð comparison between a coastal and inland locality. Am. J. Trop. Med. Hyg. 53:123Ð133.
Vol. 43, no. 2
Spielman, A., M. L. Wilson, J. F. Levine, and J. Piesman. 1985. Ecology of Ixodes-dammini-borne human babesiosis and Lyme disease. Annu. Rev. Entomol. 30: 439 Ð 460. Stafford, K. C., M. L. Cartter, L. A. Magnarelli, S. H. Ertel, and P. A. Mshar. 1998. Temporal correlations between tick abundance and prevalence of ticks infected with Borrelia burgdorferi and increasing incidence of Lyme disease. J. Clin. Microbiol. 36: 1240 Ð1244. Steere, A. C., E. Taylor, G. L. Mchugh, and E. L. Logigian. 1993. The overdiagnosis of Lyme disease. J. Am. Med. Assoc. 269: 1812Ð1816. Walker, E. D., T. W. Smith, J. Dewitt, D. C. Beaudo, and R. G. Mclean. 1994. Prevalence of Borrelia burgdorferi in host-seeking ticks (Acari, Ixodidae) from a Lyme disease endemic area in northern Michigan. J. Med. Entomol. 31: 524 Ð528. Walker, E. D., M. G. Stobierski, M. L. Poplar, T. W. Smith, A. J. Murphy, P. C. Smith, S. M. Schmitt, T. M. Cooley, and C. M. Kramer. 1998. Geographic distribution of ticks (Acari: Ixodidae) in Michigan, with emphasis on Ixodes scapularis and Borrelia burgdorferi. J. Med. Entomol. 35: 872Ð 882. White, D. J., H. G. Chang, J. L. Benach, E. M. Bosler, S. C. Meldrum, R. G. Means, J. G. Debbie, G. S. Birkhead, and D. L. Morse. 1991. The geographic spread and temporal increase of the Lyme disease epidemic. J. Am. Med. Assoc. 266: 1230 Ð1236. Williams, C. L., A. S. Curran, A. C. Lee, and V. O. Sousa. 1986. Lyme disease Ð epidemiologic characteristics of an outbreak in Westchester County, New York. Am. J. Public Health. 76: 62Ð 65. Received 4 July 2005; accepted 17 November 2005.