Rosca,Radu.Balan}@scr.siemens.com. Abstract. This paper shows that the performance of a Gaussian Mixture. Model using a Universal Background Model ...
Speaker Verification Using Orthogonal GMM with Fusion of Threshold, Identification Front-end, and UBM Ningping Fan, Justinian Rosca, and Radu Balan Real-time Vision and Modeling, Siemens Corporate Research Inc. 755 College Road East, Princeton, NJ, USA {NingPing.Fan,Justinian.Rosca,Radu.Balan}@scr.siemens.com
Abstract This paper shows that the performance of a Gaussian Mixture Model using a Universal Background Model (GMM-UBM) speaker verification (SV) system can be further improved by combining it with threshold and speaker identification (SI) “front-ends.” The paper formulates performance in terms of false rejection rate and false acceptance rate of the overall SV system. We show analytically that an SI-based front-end can significantly decrease the false acceptance rate and only results in a slight increase in the false rejection rate. Experimentally we use a subset of NIST 2001 speaker recognition corpus with 10 registered speakers of 20 utterances against 10 imposters of 960 utterances. The results show significant reduction in the false acceptance rate, from 3.5% down to 1.0% (i.e. 71% error reduction) while maintaining the same zero false rejection rate.
identifications for test voices from unregistered speakers that have no corresponding voice models in the system database. This paper is organized as follows. The section 2 first formulates the performance indexes of proposed system, and then the section 3 analyzes those equations for the speaker verification task. The section 4 presents the results from NIST 2001 speaker recognition corpus experiments. The section 5 draws conclusions.
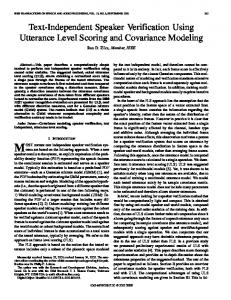
1. Introduction The state of the art GMM-UBM speaker verification system can be further improved. One way is to use discriminative kernels like the score-space kernel, which has reported to achieve 34% error reduction [1]. This paper focuses on another method to combine different verification techniques like the threshold and the identification front-end, and we have achieved 71% error reduction in experimentation. Three speaker verification methods are shown in figure 1: (a) the threshold-based method, where the decision of rejection or acceptance is based on a threshold associated for each speaker GMM model which was chosen so that the false rejection rate (FR) and the false acceptance rate (FA) satisfy certain criterion, such as FR equals FA, or FA < 90%, etc. (b) the UBM-based method, in which a universal background model (UBM) [2] is created from all the registered speakers, and is used to against the individual models for binary classification. (c) the SI-based method, where the similarity score is calculated exhaustively for each speaker model in the database. The best matched model in agreement with the claimed identity can lead to accept decision. Here we used similarity to generalize the matching score, which can be the logarithm-likelihood in the GMM model [3] or the inverse of the distance measure in the VQ model [4]. This paper studies several approaches to combine these three different methods into a more robust decision system. We will show performance improvement in detail when the method (c) is used as a first stage process cascaded before the method (a) or (b). For that reason, method (c) is called the identification frontend. Then the method (a) and (b) are further employed either alone or combined together as follows to provide the best performance. If both (a) and (b) accept results in a final accept decision, and if either (a) or (b) reject results in a final reject decision. The same mechanism can also be used to enhance the speaker identification system, in which the verification threshold or an universal background model can be used to eliminate false
Figure 1 – Illustrations of speaker recognition systems; (a) the individual threshold-based speaker verification system; (b) the UBM-based speaker verification system; (c) the speaker identification (SI)-based speaker verification system.
2. Performance Formulation For the simplicity, the following analysis assumes the combination of methods (c) and (a), but same analysis can also be applied to the combination of methods (c) and (b) if the loglikelihood scores were replaced with the log-likelihood ratios. Let a speaker recognition system have N M registered speaker models. Given N I testing voices from registered speakers, and N O testing voices from imposters, there can be
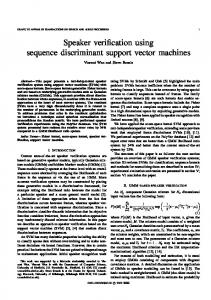
N M * ( N I + N O ) possible matching scores s ( M ) between a testing voice and a model M , as illustrated in figure 2. Let N CA be the total number of correct acceptances among N I registered speakers’ testing voices. Let N CR be the total number of correct rejections among N O imposters’ testing voices. Let N CI be the total number of correct identifications
among N I registered speakers’ testing voices. The performance indexes of a combined SV system of (c) and (a): the false rejection rate R FR , the false acceptance rate R FA , and the speaker identification rate R ID can be calculated as follows.
the model with the maximum score, agrees with the claimed identity model, the score is then compared with a threshold for further rejection of imposters who do not have a model in the system. Its false rejection rate R FR , I (T ) and false acceptance rate R FA, I (T ) for a threshold T are given as follows:
RFR , I (T ) = 1 −
NCI NCA NI NI
= 1 − RID ⋅ P( s( M ) ≥ T | v ∈ M )
RFA, I (T ) = 1 −
N CI ( N M − 1) NO N M + N I ( N M − 1)
−
( N I − NCI )( N M − 2) N O N M + N I ( N M − 1)
N O ( N M − 1) N O N M + N I ( N M − 1) N P( sˆ < T | v ∉ M ) − O N O N M + N I ( N M − 1)
(6) NI → ∞
− Figure 2 - All possible matching scores of a speaker recognition system for NM voice models, NI testing voices from registered speakers and NO testing voices from imposters.
(7) NI → ∞
where sˆ = max s ( M ) ∀M R FR R FA = 1 −
N = 1 − CA NI
NI → ∞
(1)
N CR N O N M + N I ( N M − 1)
NI + NO → ∞
(2)
N CI NI
where (6) is due to that only correctly identified voice from registered users using the identification-based front-end can be further correctly accepted using the threshold-based SV system. The equation (7) can be explained as follows. The first term is due to the fact that the correct identification of a voice from registered users will also reject it from the rest N M − 1 wrong
(3)
models, and the total number of events of correct identification of voices from registered users is N CI ( N M − 1) . The second
where the denominators are the total number of events that will happen and numerators are the true events. For example, the voice from imposters should all be rejected, thus the total number of events is N O N M . The voice from registered users should only be rejected for incorrect models, thus the total number of events is N I ( N M − 1) , as in (2). For threshold-based speaker verification system, the score is only calculated between a testing voice and a claimed identity voice model, and then compared with a threshold for acceptance or rejection. Its false rejection rate R FR ,T (T ) and false
term is due to the fact that even an incorrect identification of a voice from registered users will also correctly reject it from the rest N M − 2 wrong models, and the total number of events of
R ID =
NI → ∞
acceptance rate R FA,T (T ) for a give threshold T are determined by the corresponding conditional probabilities as follows:
N RFR ,T (T ) = 1 − CA NI
(4)
= 1 − P( s( M ) ≥ T | v ∈ M )
R FA ,T (T ) = 1 −
NO NM
NI → ∞
these events is N O ( N M − 1) . The fourth term is due to the fact that the threshold-based verification as in (5) is only for the imposters and thus the total number of events is the total number of imposters times the probability of correct rejection.
3. Performance Analysis To compare the two verification systems, we can compute and compare the performance indexes (4) versus (6) and (5) versus (7). One can derive that (7) is a monotonic decreasing function with respect to N M , as the partial derivative of
RFA, I (T ) with respect to N M is always less than zero, and
N CR + N I ( N M − 1)
= 1 − P ( s (M ) < T | v ∉ M )
incorrect identification of voices from registered users is ( N I − N CI )( N M − 2) . The third term is due to the fact that the identification process will always correctly reject a voice from imposters for N M − 1 wrong models, and the total number of
(5) N I + NO → ∞
For a combined speaker verification system that uses the identification front-end, the scores of a testing voice for all the voice models are calculated. If only the identification output or
furthermore the RFA, I (T ) will approach zero as N M approaches infinity. Assuming a uniform posterior distribution of the identification results:
∂RFA, I (T ) ∂N M
=− −
4. Experiments
( N CI + N I ) N I (1 − RID )
(NO N M + N I ( N M − 1) )2
( NCI + N I ) NCI (1 − P(sˆ < T | v ∉ M ))
RFA,I (T ) = 1 −
(NO N M + N I ( N M − 1))2
(8) 1
(10)
In other words, the identification front-end can drastically decrease the false acceptance rate but with a small increase of false rejection rate. The latter can be compensated up to the identification rate limit, i.e. 1 − RID , by lowering T so that P( s ( M ) > T | v ∈ M ) → 1 . If P0 = P ( s ( M ) ≥ T | v ∈ M ) ,
P1 = P ( s ( M ) < T | v ∉ M ) , P2 = P ( sˆ( M ) < T | v ∉ M ) , the figure 3 top plot assumes constant probabilities, while in the bottom one, P2 is decreasing proportionally with N M , and constant others. In any case, (10) is indeed true.
Figure 3 – Theoretic speaker verification performance indexes plots: (a) P0=0.9, P1=0.91, P2=0.85, RID=0.98, NO=100, NI=20; (b) P0=0.9, P1=0.91, P2=0.85/NM, RID=0.98, NO=100, NI=20.
Speech signals from 20 different identities (10 male and 10 female) are taken from NIST 2001 speaker recognition corpus in “devtest-training” section. 10 of them are used as registered users, and 10 are used as imposters. The wave files are cut into several pieces each 10 ~ 20 sec length, 16 bit and 8 KHz. For the 10 registered users, 2 pieces are used for testing, 4 ~ 8 pieces are used for orthogonal GMM [5] individual model training, and rest 2 ~ 3 pieces are grouped together for UBM training. For 10 imposters, all the pieces are used for testing, and each piece will test all the 10 registered users. All the speech signals are converted into feature vectors of MFCC coefficients [6]. 10 individual models and one UBM are created from the training feature vectors, corresponding to registered speakers, with id listed in the first row of table 1. Each testing utterance from both registered speakers and imposters is then used to compare with each model to generate a normalized logarithm likelihood score, as shown in table 1. Table 1 – Normalized log-likelihood scores of a GMM system with 10 registered models with id listed in the first row and 980 testing voices of 20 from registered users and 960 from imposters. Threshold values are underlined. id 1 1 1 1 1 1 1 1 1 1 1 2 2 2 2 2 2 2 2 2 2 2 3 3 3 3 3 3 3 3 3 3 4 4 5 5 6 6
4 -1.19 -1.08 -1.24 -1.27 -1.25 -1.15 -1.11 -1.15 -1.09 -1.13 -1.22 -1.57 -1.57 -1.59 -1.49 -1.3 -1.47 -1.48 -1.26 -1.3 -1.55 -1.63 -1.18 -1.17 -1.18 -1.24 -1.28 -1.41 -1.13 -1.32 -1.2 -1.17 -1.06 -1.02 -1.38 -1.25 -1.26 -1.18
5 -1.2 -1.12 -1.25 -1.34 -1.27 -1.19 -1.15 -1.16 -1.13 -1.19 -1.2 -1.62 -1.6 -1.65 -1.51 -1.25 -1.41 -1.47 -1.33 -1.34 -1.51 -1.6 -1.23 -1.21 -1.16 -1.26 -1.26 -1.39 -1.17 -1.28 -1.21 -1.2 -1.26 -1.15 -1.23 -1.19 -1.3 -1.2
6 -1.31 -1.15 -1.31 -1.35 -1.37 -1.2 -1.21 -1.22 -1.13 -1.13 -1.29 -1.55 -1.56 -1.59 -1.53 -1.33 -1.47 -1.47 -1.3 -1.34 -1.55 -1.62 -1.25 -1.25 -1.36 -1.42 -1.4 -1.47 -1.16 -1.46 -1.38 -1.36 -1.26 -1.23 -1.55 -1.3 -1.09 -1.02
9 -1.25 -1.08 -1.32 -1.36 -1.31 -1.19 -1.16 -1.21 -1.15 -1.19 -1.26 -1.77 -1.8 -1.81 -1.72 -1.43 -1.66 -1.69 -1.3 -1.45 -1.69 -1.8 -1.26 -1.24 -1.38 -1.46 -1.47 -1.49 -1.18 -1.49 -1.38 -1.39 -1.29 -1.22 -1.51 -1.38 -1.25 -1.15
10 -1.2 -1.05 -1.25 -1.32 -1.26 -1.16 -1.14 -1.15 -1.1 -1.1 -1.22 -1.72 -1.7 -1.76 -1.65 -1.32 -1.48 -1.56 -1.36 -1.37 -1.57 -1.66 -1.22 -1.22 -1.25 -1.32 -1.34 -1.42 -1.15 -1.32 -1.23 -1.25 -1.24 -1.14 -1.39 -1.32 -1.21 -1.1
12 -1.41 -1.2 -1.49 -1.37 -1.43 -1.29 -1.31 -1.3 -1.21 -1.16 -1.41 -1.48 -1.74 -1.51 -1.43 -1.38 -1.61 -1.49 -1.28 -1.43 -1.69 -1.84 -1.24 -1.24 -1.33 -1.4 -1.42 -1.49 -1.13 -1.49 -1.38 -1.37 -1.24 -1.26 -1.64 -1.39 -1.37 -1.34
14 -1.52 -1.36 -1.59 -1.46 -1.55 -1.45 -1.44 -1.43 -1.38 -1.3 -1.53 -1.54 -1.63 -1.6 -1.45 -1.3 -1.62 -1.54 -1.24 -1.34 -1.7 -1.79 -1.27 -1.25 -1.33 -1.39 -1.45 -1.5 -1.19 -1.48 -1.38 -1.37 -1.3 -1.32 -1.67 -1.48 -1.45 -1.45
15 -1.57 -1.39 -1.69 -1.57 -1.63 -1.46 -1.46 -1.49 -1.38 -1.34 -1.58 -1.57 -1.86 -1.62 -1.54 -1.5 -1.82 -1.68 -1.41 -1.6 -1.9 -2.01 -1.42 -1.45 -1.53 -1.57 -1.62 -1.66 -1.37 -1.65 -1.58 -1.57 -1.4 -1.44 -1.78 -1.47 -1.48 -1.45
16 -1.46 -1.28 -1.52 -1.44 -1.48 -1.36 -1.36 -1.36 -1.31 -1.26 -1.45 -1.43 -1.55 -1.46 -1.38 -1.33 -1.53 -1.45 -1.29 -1.35 -1.6 -1.69 -1.26 -1.24 -1.31 -1.39 -1.42 -1.49 -1.16 -1.47 -1.38 -1.37 -1.31 -1.29 -1.61 -1.41 -1.42 -1.39
17 -1.52 -1.32 -1.59 -1.46 -1.53 -1.43 -1.42 -1.46 -1.37 -1.3 -1.54 -1.56 -1.6 -1.55 -1.44 -1.31 -1.67 -1.55 -1.23 -1.37 -1.72 -1.81 -1.24 -1.22 -1.33 -1.4 -1.43 -1.46 -1.16 -1.5 -1.4 -1.35 -1.3 -1.34 -1.64 -1.48 -1.45 -1.43
UBM -1.18 -1.03 -1.24 -1.24 -1.22 -1.12 -1.11 -1.11 -1.07 -1.07 -1.19 -1.42 -1.38 -1.41 -1.31 -1.22 -1.38 -1.35 -1.17 -1.24 -1.5 -1.56 -1.15 -1.13 -1.15 -1.24 -1.27 -1.38 -1.07 -1.29 -1.18 -1.17 -1.13 -1.09 -1.35 -1.2 -1.12 -1.08
7 7 7 7 7 7 7 8 8 8 8 8 8 8 9 9 10 10 11 11 11 11 11 11 12 12 13 13 13 13 13 14 14 15 15 16 16 17 17 18 18 18 18 18 18 18 19 19 19 19 19 19 19 19 20 20 20 20 20 20
-1.14 -1.1 -1.13 -1.12 -1.16 -1.17 -1.06 -1.4 -1.47 -1.45 -1.27 -1.33 -1.45 -1.35 -1.26 -1.16 -1.32 -1.35 -1.3 -1.26 -1.33 -1.26 -1.35 -1.35 -1.48 -1.22 -1.66 -1.57 -1.43 -1.49 -1.57 -1.45 -1.39 -1.43 -1.39 -1.32 -1.44 -1.6 -1.74 -1.33 -1.47 -1.38 -1.31 -1.28 -1.47 -1.41 -1.43 -1.43 -1.58 -1.4 -1.68 -1.28 -1.32 -1.32 -1.35 -1.46 -1.47 -1.46 -1.43 -1.45
-1.14 -1.09 -1.16 -1.15 -1.2 -1.18 -1.06 -1.59 -1.63 -1.64 -1.43 -1.52 -1.6 -1.54 -1.24 -1.11 -1.31 -1.31 -1.21 -1.21 -1.26 -1.18 -1.26 -1.26 -1.63 -1.35 -1.74 -1.72 -1.51 -1.53 -1.65 -1.49 -1.49 -1.52 -1.51 -1.36 -1.5 -1.8 -1.95 -1.4 -1.59 -1.41 -1.33 -1.27 -1.56 -1.46 -1.67 -1.66 -1.9 -1.61 -1.96 -1.49 -1.52 -1.54 -1.38 -1.5 -1.46 -1.51 -1.47 -1.45
-1.25 -1.22 -1.3 -1.29 -1.33 -1.26 -1.16 -1.5 -1.58 -1.59 -1.38 -1.49 -1.6 -1.47 -1.13 -1.03 -1.39 -1.44 -1.48 -1.45 -1.5 -1.46 -1.5 -1.49 -1.5 -1.27 -1.68 -1.66 -1.48 -1.54 -1.64 -1.49 -1.42 -1.44 -1.41 -1.36 -1.48 -1.67 -1.85 -1.3 -1.51 -1.35 -1.25 -1.24 -1.44 -1.36 -1.43 -1.43 -1.65 -1.41 -1.75 -1.26 -1.3 -1.36 -1.39 -1.49 -1.48 -1.48 -1.47 -1.43
-1.25 -1.21 -1.28 -1.26 -1.31 -1.29 -1.17 -1.62 -1.7 -1.73 -1.45 -1.51 -1.74 -1.57 -0.99 -0.65 -1.39 -1.39 -1.49 -1.48 -1.53 -1.47 -1.58 -1.57 -1.63 -1.35 -1.89 -1.73 -1.57 -1.68 -1.77 -1.7 -1.59 -1.59 -1.53 -1.59 -1.69 -1.84 -1.98 -1.43 -1.66 -1.57 -1.46 -1.43 -1.6 -1.56 -1.55 -1.56 -1.76 -1.53 -1.8 -1.4 -1.45 -1.46 -1.56 -1.71 -1.67 -1.69 -1.69 -1.64
-1.18 -1.14 -1.2 -1.17 -1.23 -1.22 -1.11 -1.71 -1.77 -1.78 -1.58 -1.65 -1.76 -1.7 -1.15 -0.96 -1.11 -1.16 -1.28 -1.24 -1.34 -1.26 -1.32 -1.34 -1.68 -1.32 -1.87 -1.85 -1.61 -1.63 -1.78 -1.59 -1.59 -1.58 -1.58 -1.52 -1.63 -1.87 -2.02 -1.49 -1.69 -1.52 -1.38 -1.37 -1.63 -1.56 -1.73 -1.68 -1.95 -1.61 -2.04 -1.51 -1.53 -1.52 -1.47 -1.66 -1.59 -1.63 -1.59 -1.58
-1.31 -1.25 -1.33 -1.34 -1.39 -1.3 -1.18 -1.27 -1.31 -1.31 -1.22 -1.3 -1.37 -1.26 -1.36 -1.16 -1.54 -1.58 -1.53 -1.48 -1.58 -1.53 -1.59 -1.57 -1.29 -0.98 -1.6 -1.49 -1.4 -1.47 -1.49 -1.4 -1.29 -1.35 -1.31 -1.19 -1.34 -1.54 -1.77 -1.17 -1.42 -1.27 -1.22 -1.24 -1.34 -1.26 -1.22 -1.2 -1.59 -1.2 -1.59 -1.07 -1.07 -1.17 -1.25 -1.36 -1.36 -1.34 -1.29 -1.35
-1.29 -1.25 -1.32 -1.36 -1.42 -1.33 -1.13 -1.29 -1.38 -1.34 -1.19 -1.21 -1.34 -1.24 -1.47 -1.33 -1.65 -1.67 -1.58 -1.5 -1.58 -1.53 -1.56 -1.52 -1.47 -1.22 -1.55 -1.42 -1.32 -1.4 -1.44 -1.22 -1.18 -1.34 -1.32 -1.17 -1.31 -1.5 -1.61 -1.17 -1.37 -1.29 -1.26 -1.25 -1.33 -1.28 -1.32 -1.33 -1.45 -1.32 -1.48 -1.23 -1.27 -1.29 -1.24 -1.33 -1.36 -1.31 -1.27 -1.38
-1.4 -1.33 -1.44 -1.45 -1.47 -1.38 -1.25 -1.33 -1.38 -1.34 -1.33 -1.44 -1.45 -1.3 -1.51 -1.34 -1.78 -1.77 -1.7 -1.66 -1.74 -1.69 -1.74 -1.74 -1.54 -1.34 -1.58 -1.49 -1.38 -1.41 -1.47 -1.49 -1.4 -1.26 -1.22 -1.16 -1.3 -1.59 -1.89 -1.12 -1.37 -1.22 -1.18 -1.19 -1.34 -1.2 -1.38 -1.39 -1.79 -1.42 -1.84 -1.24 -1.24 -1.43 -1.21 -1.32 -1.33 -1.3 -1.29 -1.34
-1.3 -1.26 -1.33 -1.35 -1.4 -1.32 -1.17 -1.28 -1.33 -1.3 -1.19 -1.27 -1.32 -1.25 -1.44 -1.24 -1.56 -1.59 -1.54 -1.47 -1.54 -1.49 -1.55 -1.53 -1.46 -1.23 -1.51 -1.49 -1.38 -1.41 -1.45 -1.37 -1.33 -1.33 -1.32 -1 -1.11 -1.49 -1.69 -1.2 -1.36 -1.23 -1.2 -1.2 -1.36 -1.26 -1.35 -1.4 -1.6 -1.34 -1.64 -1.22 -1.25 -1.33 -1.19 -1.26 -1.26 -1.26 -1.24 -1.25
-1.3 -1.26 -1.34 -1.34 -1.4 -1.31 -1.16 -1.23 -1.31 -1.29 -1.14 -1.16 -1.3 -1.2 -1.48 -1.34 -1.6 -1.61 -1.54 -1.48 -1.58 -1.51 -1.57 -1.57 -1.39 -1.2 -1.51 -1.38 -1.34 -1.43 -1.43 -1.38 -1.28 -1.34 -1.31 -1.2 -1.31 -1.36 -1.43 -1.11 -1.29 -1.31 -1.24 -1.23 -1.23 -1.23 -1.23 -1.24 -1.33 -1.25 -1.37 -1.16 -1.21 -1.22 -1.21 -1.34 -1.4 -1.3 -1.25 -1.43
-1.15 -1.11 -1.17 -1.14 -1.2 -1.17 -1.06 -1.21 -1.29 -1.26 -1.14 -1.16 -1.27 -1.2 -1.08 -0.86 -1.2 -1.24 -1.32 -1.27 -1.34 -1.28 -1.34 -1.33 -1.3 -0.98 -1.42 -1.35 -1.26 -1.31 -1.34 -1.27 -1.2 -1.29 -1.24 -1.05 -1.16 -1.36 -1.47 -1.08 -1.25 -1.2 -1.14 -1.11 -1.21 -1.19 -1.14 -1.17 -1.27 -1.14 -1.35 -1.06 -1.1 -1.13 -1.13 -1.21 -1.26 -1.18 -1.16 -1.23
The minimum score of each testing voice compared with its own model is selected as the threshold for a testing voice to be accepted or rejected by that identity voice model, as underlined in the table 1. Thus all the testing voice from registered users will be correctly accepted for each voice model. The corresponding verification results for the threshold-based, UBM
based, and various combinations with the identification-based front-ends speaker verification systems are shown in table 2. Table 2 - Results of various algorithms for the previous data Method Individual Threshold: Identification+Threshold UBM Identification+UBM Identification+Threshold+UBM
FR 1-20/20 = 0 1-20/20 = 0 1-20/20 = 0 1-20/20 = 0 1-20/20 = 0
FA 1-808/960 = 0.158 1-836/960 = 0.129 1-926/960 = 0.035 1-939/960 = 0.022 1-950/960 = 0.010
5. Conclusions An approach combining the power of three different speaker verification methods has been proposed. We show analytically that the combined solution is better than the standalone solution. Experimentation using a subset of standard NIST speaker recognition corpus also provides strong evidence to support that conclusion.
Because the proposed method is based on decision fusion, the same analysis can also be applied to the more advanced score-space kernel based systems. However we expect only a moderate enhancement because the complimentary characteristics will less effective when the classifier approaching its limit.
6. References [1] V. Wan and S. Renals, “Speaker verification using sequence discriminant support vector machine”, IEEE trans on Speech and Audio Processing, 13-2, pp 203-210, Mar. 2005. [2] A. D. Reynolds, T. F. Quatieri and R. B. Dunn, “Speaker verification using adapted Gaussian mixture models,” Digital Signal Processing, vol. 10, No 1, pp. 19-41, Jan. 2000. [3] A. D. Reynolds and C. R. Rose, “Robust text-independent speaker identification using Gaussian mixture speaker models”, IEEE Transactions on Speech and Audio Processing, 3(1): pp. 72-83, 1995. [4] N. Fan and J. Rosca; “Enhanced VQ-based algorithms for speech independent speaker identification”, Proc. AVBPA03, pp. 470-477, Guildford, UK, Jun. 2003. [5] L. Liu and J. He; “On the use of orthogonal GMM in speaker recognition”, Proc. ICASSP99, pp. 845-848, Phoenix, USA, Mar. 1999. [6] S. Kim, Yonsei, T. Eriksson, H-G Kang, and D. H. Youn, “A pitch synchronous feature extraction method for speaker recognition” Proc. ICASSP04, pp. 405-408, Montreal, Canada, May 2004. [7] W. Lim and N. S. Kim, “Bayesian approach to textindependent speaker verification”, International Conference on Speech Processing, Aug. 2001. [8] S. Z. Li, D. Zhang, C. Ma, H. Y. Shum, and E. Chang, “Learning to boost GMM based speaker verification”, Proc. Eurospeech03, pp. 1677-1680, Geneva, Switzerland, 2003.