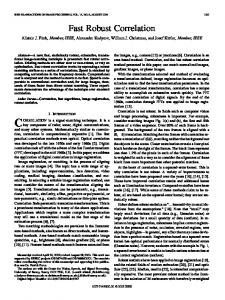
1. THE AFFINE INVARIANT PSEUDOMETRIC. In conventional correlation, the bulges are dependent on the signal power and DC bias. This can cause errors in.
SPECIAL PURPOSE CORRELATION FUNCTIONS FOR IMPROVED SIGNAL DETECTION AND PARAMETER ESTIMATION Douglas Nelson Dept. of Defense, 9800 Savage Rd., Ft. Meade, Md.
ABSTRACT This paper is a compilation of several correlation functions which were developed by the author and have been used for the past several years in signal analysis applications The affine invariant pseudometric is a corrlation function nromalized to be independent of power, DC bias and phase rotation and was developed to track radar video sync pulses. I t has recently been successfully used to track glottal pulses in voiced speech. The cross-power spectrum represents a significant improvement over standard power-spectral methods for recovering weak stationary tones in noise. The harmonic rejecting correlation function is a variant of the Wigner transform which resolves fundamentals from harmonic and subharmonic features produced by periodic waveforms. Each of these algorithms has been tested and used on a variety of data. Mast importantly, for each of the methods described here, closed form solutions are derived, which enable easy implementations.
and, in a slight abuse of notation, the un-normalized mean of F (1) on the interval I is FI = I F ( t ) d t , (1.3) I
The un-normalized cross-correlation function of F and G
is (1.4)
C I ( F , G , z ) = h(t)G(l+r)dr. I
and the Euclidean distance between F and G is (1.5)
d,(F,G) = I I F ( t ) -G(t)12dt I
- -
= j I F ( t ) 1 2 + IG ( t ) l 2 - F ( r ) G ( 1 ) - F ( r ) G ( r ) d t I
=
PI(F)+ P I ( G ) - 2 R e ( C I ( F , G , 0 ) ) .
We can now define the pseudometric invariant under a general affine transformation of G as r ( F , G ) = minA,,dI(F,AG+B) (1.6) = minA,,I[F(t) -AG(r) -B] [ F ( t ) - A G ( t ) -B]dr,
1. THE AFFINE INVARIANT PSEUDOMETRIC In conventional correlation, the bulges are dependent on the signal power and DC bias. This can cause errors in detecting signals with fluctuating power. To overcome this problem, the approach of this paper is to construct a Euclidean pseudometric which is invariant under all complex affine transformations. This pseudometric properly extends the notion of Euclidean distance and is easily computed using standard fast convolution methods. The fact that it is invariant under affine transformations means that signal detection is truly independent of received signal power and DC bias. Detection is not a constant false alarm rate (CFAR) process since there is still a dependence on the received power, which is not estimated. We assume a continuous signal G ( t ) parameterized by time, and a matched filter F ( t ) which is the ideal waveform of the signal component of interest. We assume also that the function F has as its support region, the interval I = [re t l ] and equals zero outside of its support interval. We define the length of the interval I to be LI = r, - t o * (1.1)
I
where A = reie and B = pe" are arbitrary complex numbers. Since d,(F,AG +B) is continuous in r , e , p and cp,and A and B are bounded below, dI (F, G ) exists. The quantity gI is a pseudometric, which is, in particular, non-negative. The expression (1.6) assumes the value zero if and only if G is equal to an affine transformation of F on the interval I except on a set of measure zero. In order to obtain a closed form representation for the pseudometric 4, we need only set the partial derivatives of dI (F, AG + B ) with respect to r, p, 0 and cp equal to zero and solve the resulting system of equations. These partial derivatives are given by . -
[ F ( r ) - A G ( t ) - E ] + A G ( ? ) [ F ( r )- A G ( r ) - E ] &
2=;.4G(?) $=-cG(t)
(1.7)
[ F ( r ) -AG(?) 8 1 m [ F ( r )- A G ( t ) - E ] &
~ = - 'P~ I[ F ( r ~ - A G ( f ) - E l + ~ [ F ( r ) - A G ( f ) - E ] d r aP
(1.9)
g=-p[F(r) -AG(r) -E]
(1.10)
acp
+ z [ F ( r ) -AG(r) - E ] d t
I
By setting the partial derivatives to zero, we obtain
The un-normalized power of F (1) on the interval I is (1 PI(0= !IF ( 0 I 2dt,
.a
I
0 = A G ( t ) [ F ( 1 ) -AG ( t ) - B ] dt
I
(1.11)
IV-73
U.S. Governmentwork not protected by U.S. Copyright
=
waveform. In this process, the filter F can be modified to have complex mean equal to zero by subtracting the filter mean from the OrigiMl signal. If we assume th3t the filter F has zero mean then the minimum value of Q (F,G ) is given by formula (1.15a), which reduces to
A(CI(F,G,O) -AP,(G) -8Gl).
From (1.9) and (l.lO), we obtain
I
0 = B F ( t ) - A G ( f ) -Bdt
(1.12)
I
=
B(F,-AG,-BL,).
(1.16)
Combining (1.6), (l.ll), and (1.12), we obtain d f ( F , G ) = m i n A , B I F ( f )[ F ( t ) - A G ( t ) - B ] d t I
= minA,B { P , (F)-ZC,
(1.13)
(F,G, 0) -BF,}
We now solve (1.11) and (1.12) for A and B . Clearly, there are four cases since A and B can assume the value zero or can be non-zero. In the non-degenerate case where A and B are not zero, FIG,- CI (F,G, 0)LI A =
(1.14a)
pIl '- P, (aL,
and E =
If A
GIG, (F,G, 0) -FIP, = 0,and B
-.
LI B =0
(1.15a)
+ 0, we have the degenerate condition (1.15b)
B = FI
If
(G 1)
Iq2- P , (aL,
and A # 0, we have the degenerate condition (1.14~)
Finally, we can have the degenerate case in which and B = 0. Combining (1.13), (1.14), and (1.15), we obtain the following representations for the affine invariant pseudometric A =0
which is the preferred form of the pseudometric for implementation. Assume that (1.17) F(1) = F ( f ) + K and G(t) = F(1) +K. (1.18) where ( 1 ) is mean zero on the interval I and _C ( 1 ) is the representative of the affine class for which the Euclidean distance to ~ ( r ) is minimized. The Euclidean distance between F and G is equal to the Euclidean distance between and G, therefore, representations (1.15b) and (1.1%) are invalid and the general form of the pseudometric represented by equations (1.15) is given by (1.15a). Equations (1.15a) and (1.16) have all of the properties of pseudometric unless G ( 1 ) is constant on the interval I. In this case the denominator vanishes and the expression blows up. If G (1) is not constant, the denominator is positive, and the pseudometric is non-negative, with the value zero occurring only if F and G differ by an affine transformation. To implement the pseudometric, the ideal waveform F is estimated, and 17 computed by subtracting the mean of the function F from F. To be precise, for an arbitrary function F. (1.19) F ( f ) = F ( t ) -meanl(F)' where I is the interval of support of F. The un-normalized power of I; is calculated once. The cross-correlation of F and G is calculated using fast convolution, and the two terms in the denominator of (1.16) are computed using fast convolution or recursively using and G[r+e,r+L+e]
Case3: A Z O andB
= 0
= G[r,r+Ll +GLr+L,r+L+e] - G [ i , r + e ] .
(1.2')
2. THE CROSS-POWER SPECTRUM (CPS) The Cross-Power Spectral (CPS) estimation algorithm is essentially channelized FM frequency estimation based on a time varying Fourier transform. The Fourier transform of the signal over the observation interval is given by
-
f (a)= IX (1) e-"'df
(1.15d)
I
The value of the pseudometric $ ( F , G ) is the minimum of the expressions (1.15). Clearly, the value of (1.15d) is bounded below by the value of (1.15b), so (1.15d) does not apply. The most common correlation operation is a process of comparing a fixed nearly matched filter with an incoming
(2.1)
We introduce a time dependency by partitioning time into contiguous non-overlapping intervals I,, each of length L . We can then define a time dependent Fourier transform sequence as
2. (a)= J X 1"
IV-74
( t ) e-'"'dr
(2.2)
averages of short term power spectra. For each o the sequence (2.2) represents a signal which has been heterodyned by a complex phaser e'@', lowpass filtered by an FIR filter with frequency response S ~ ~ C ~ ( and W L sampled ) once in each interval I,. It is this property which is exploited by the CPS algorithm. The CPS estimator can now be defined by
1
I
1
i 1
Typical 128-pointpower spectral average of tone in noise I
I
n=l
By contrast, the normal power spectral average is given by P (0) =
El N2- L ( 0 )Z n ( 0 ).
128-point cross-powerspectral average of tone in noise
(2.4)
n=l
For stationary tones, the expected value of the magnitudes of (2.3) and (2.4) are the same. The difference between the two functions is that the terms in (2.3) are all complex. If we assume that x ( t ) is a stationary tone in white Gaussian noise of the form X ( t ) = e'"'+N(t),
the expected value of the argument of the n" term in expression (2.3) is dependent only on o' and not n . The argument of g (o)now has a convenient interpretation. We note that the Fourier transform A n (1) is the crosscorrelation of the signal X, ( r ) restricted to the interval I,, with a cosine wave with initial phase zero on that interval. The expected value of the argument of each term of (2.3) is the average phase advance of the function ei(cP'-cP)'over the interval I,, . Therefore, the CPS is precisely a channelized FM detector. In practice, the CPS is implemented using an FFT.In this case, the Fourier basis consists of complex phasers of the form bn=e
3. THE "HARMONIC" REJECTING CORRELATION FUNCTION In the analysis of radar signals, bulges at multiples of the fundamental Pulse Repetition Interval (PRI) are frequently referred to by the term 'time harmonics'. Since these bulges occur at multiples of the periods of signals, they should properly be called subharmonics. In this section, we develop a complex valued correlation function which detects only fundamental periodicity and rejects both time and frequency harmonics. The argument of this function is exactly the function normally refered to as the 'PRI phase' of the signal. In addition, this correlation process admits a CPS type interpopulation for accurate recovery of signal periodicity. We start by defining the correlation integrals which are the main result of this section. If F and x are two signals , the harmonic rejecting correlation functions are given by
,
which have an integer number of complete cycles in the interval of integration. By the preceding comments, if 1On---'I < E1* (2.7)
where the last term is a bias term which is dependent on the noise, and the argument function assumes values in the interval (-n,x ) .The equation (2.8) is the CPS interpolation formula. The standard implementation of the CPS algorithm is to compute 2 (2.9) g = (@(at)). where $ is a vector consisting of the CPS coefficients calculated by applying (2.3) to the FFT coefficients. The approximate frequenc of the signal is recovered from the magnitude vector IGr. the interpolation formula is then applied to improve the frequency estimate. The CPS algorithm has been tested extensively on a variety of data, The performance is much better than conventional spectral detection / estimation methods based on
It is clear that the formulae in (3.1) are integrals along hyperbolae on the Wigner distribution surfaces. To derive the properties of the correlation functions, assume that F and x are periodic with minimum period p satisfying X(r) = X ( r + p ) . (3.2) and F(t) = F(t+p).
The functions (3.1) vanish in the limit for all values of equal to non-unity integer multiples of p. To be precise, (3.3) limn,,C,,(F,X,np,IL) = O , ( n = 2 , 3 , 4 ,...) , and lim,,,A,,(F,X,np,IL)
7
= O , ( n = 2 , 3 , 4 ,...) ,
where L is the length of the interval of integration lL. The proof of (3.3) follows immediately from the periodicity of F and X.. The factor e2nit'r effectively winds the integrand around the origin. If 7 = np and n > 1 then the expected complex mean of the integrand is zero, and (3.3) follows. To make this precise, we can rewrite the equations
IV-75
the average phase advance of the signal x alone over intervals of length L, and the resulting frequency interpolation provides an accurate estimate of the periodicity of x alone, even if there is a slight error in the estimate of the period of
(3.1), for example, as Ch (F, X,np, I) =
c
n-1
.
1
-
F ( t +j p ) X (t + j p + np) e2*i(r+jp)’”Pdt
(3.4)
“PI”j=o n-1
F
= 1 j C F ( r ) X ( f ) e 2 ~ i ( r + j p ) / ndt, p np’” j = 0
where the original interval of integration was assumed to have length L equal to a multiple of np, and IL is the new interval of length L / n p resulting from reparameterization. In this form, the integrand is identically zero, and the result is obvious. The PRI phase of a pulse train, with period is p , is given by
Sum of 4 Pulse Trains in Time Domain
A
A
P, A. A ! -J,
I
where T,,is the Time-Of-Arrival (TOA) of the nrh pulse and I P is the remainder after division by p . With this definition, we see that the argument of (3.1) is equivalent to the PRI phase. For perfectly basebanded signals, the argument of (3.1) measures the timing offsetbetween the two signals. The two signals are in time sync if the argument of their crosscorrelation integral (3.1) is zero. For simplicity, we assume that the length of the interval I is an integral multiple of z and that the signals F and x have periods approximately equal to p . These periods may be unequal and imprecisely known. With this, we note that a CPS-type interpolation may be performed to resolve slight differences in the periods of F and x. To do this, we compute the expression
I n
Ah (xj, 7, r)
.
II!j, b, A
b.
h
,\.A,?.
.A
4.
-II
I
AA A
A
Harmonic Rejecting Autocorrelation(Ticks Show Fundamentals)
j= 1
-
h
Normal Automrr. of 4 Pulse Trains (Ticks Show Fundamentals)
where xj( t ) = x ( t +jL), and L is the length of the interval I. The argument of (3.6) measures the sum of the average relative carrier phase advance and the average relative PRI phase advance of the two signals over an interval of length L. The interpolation to reestimate the period of x is precisely the same as that for the CPS algorithm previously discussed. If we now consider the autocorrealtion function defined by (3.1), we do not have to perform the delay-conjugate-multiply to recover the interpolated frequency. In this case, we need only consider =
d.
Spectrum of 4 Pulse Trains (Ticks Show Fundamental Freqs.)
(3.5)
dh (x,‘61)
I
I
I
(3.7)
j= 1
If we assume that the signal x has been perfectly basebanded, the argument of d,, is the average advance of the signal phase over an interval of length 2. If z = p then arg (Ah(X,‘Lr)) = 0.
Finally, we could crosscorrelate two functions F and X , fixing the interval over which F is defined, to produce j= 1
For basebanded signals, the argument of (3.8) represents
CONCLUSIONS All of the algorithms presented in this paper have proven to be quite effective signals analysis tools. In particular, the CPS algorithm has been successfully used to recover tones in severe noise environments. To the best of the author’s knowledge, this is the only method which has been successful in blind recovery of carrier frequencies of complex QAM modem signals, and is currently the method of choice for that application. The interpolation methods used with the CPS and HRCF algorithms provide means for accurate estimations of periodicity / frequency of stable signals even in severe noise and interference conditions. REFERENCES 111 Harris, J. D. and Nelson, D. J. “Glottal Pulse Alignment in Voiced Speech for Pitch Determination”, Preprint. [2] Nelson, D. J., “Cross-Correlation and the Affine Invariant Pseudometric’’ Intemal Technical Report, 1983. [31 Nelson, D. J., “Special Purpose Correlation Functions”, Intemal Technical Report, 1988. [4] Ng, S. S.,”A Technique for Spectral Component Location Within a FFT Resolution Ce1l”JEEE Transactions on Acoustics, Speech and Signal Processing,Vol. 3,38.8,1984. 151 Oppenheim, A. V. and Schafer, R. W., pfocesslng,Prentice Hall,1975. [61 Orr,R., and Morris, J., “Use of Gabor Representation for Wigner Distribution Crossterm Suppression”, IEEE Transactions on Acoustics, Speech and Signal Processing, V-29, 1992.
IV-76