Running head: SPECIFIC AND OVERLAPPING COGNITIVE VULNERABILITY TO DEPRESSION
Accepted for publication in “Journal of Affective Disorders”. Note: This is an uncorrected version of an author’s manuscript accepted for publication. Copyediting, typesetting, and review of the resulting proofs will be undertaken on this manuscript before final publication. During production and pre-press, errors may be discovered that could affect the content.
Specificity and overlap of attention and memory biases in depression
Igor Marchetti 1, 2, *, Jonas Everaert 1, 3, Justin Dainer-Best 2, Tom Loeys 1, Christopher G. Beevers 2, & Ernst H.W. Koster 1
1
2
Ghent University, Ghent, Belgium
The University of Texas at Austin, Austin, TX, United States of America 3
Yale University, New Haven, CT, United States of America
*Corresponding author: Igor Marchetti Ghent University Department of Experimental-Clinical and Health Psychology Henri Dunantlaan 2 9000 Ghent Belgium Phone: 0032(0)92649447 Fax: 0032(0)92646489 E-mail:
[email protected]
Running head: SPECIFIC AND OVERLAPPING COGNITIVE VULNERABILITY TO DEPRESSION
Abstract Background: Attentional and memory biases are viewed as crucial cognitive processes underlying symptoms of depression. However, it is still unclear whether these two biases are uniquely related to depression or whether they show substantial overlap. Methods: We investigated the degree of specificity and overlap of attentional and memory biases for depressotypic stimuli in relation to depression and anxiety by means of meta-analytic commonality analysis. By including four published studies, we considered a pool of 463 healthy and subclinically depressed individuals, different experimental paradigms, and different psychological measures. Results: Memory bias is reliably and strongly related to depression and, specifically, to symptoms of negative mood, worthlessness, feelings of failure, and pessimism. Memory bias for negative information was minimally related to anxiety. Moreover, neither attentional bias nor the overlap between attentional and memory biases were significantly related to depression. Limitations: Limitations include crosssectional nature of the study. Conclusions: Our study showed that, across different paradigms and psychological measures, memory bias (and not attentional bias) represents a primary mechanism in depression.
Keywords: attentional bias, memory bias, depression, anxiety, depressive symptoms, commonality analysis, meta-analysis
2
Running head: SPECIFIC AND OVERLAPPING COGNITIVE VULNERABILITY TO DEPRESSION
Introduction Depression is a common mental disorder with substantial individual and societal burden (Cuijpers, Beekman, & Reynolds, 2012; Gustavsson et al., 2011), including reduced wellbeing, impaired global functioning, and increased mortality (Lépine & Briley, 2011). These issues are not limited to depressed patients, but are often present to a lesser extent in individuals with mild depressive symptoms who do not meet full criteria for major depression (Cuijpers et al., 2014). In fact, studies show that subclinical depression is not only highly prevalent (Cuijpers, de Graaf, & van Dorsselaer, 2004), but also characterized by significant psychosocial disability (Judd et al., 2000) and higher risk of future major depression (Cuijpers & Smit, 2004). Therefore, investigating the structure of the depressotypic characteristics during the subclinical phase is of paramount importance to understand depression and, potentially, prevent the development of its clinical form (Munoz, Beardslee, & Leykin, 2012; Munoz & Bunge, 2016). In an attempt to gain insight into the network of depressotypic characteristics, an extensive body of research has focused on emotional biases in basic cognitive processes, also known as cognitive biases (Gotlib & Joormann, 2010). Cognitive biases refer to a tendency to process emotional information so as to favor certain types of emotional valence or meaning (Mathews & MacLeod, 2005). In the context of depression, these biases primarily include increased processing of negative information at the expense of neutral and positive information (Gotlib & Joormann, 2010; Winer & Salem, 2016). That is, whereas asymptomatic individuals show a preference for positive stimuli (Pool, Brosch, Delplanque, & Sander, 2016), subclinically depressed individuals have been shown to allocate more attention to negative stimuli (Koster, De Raedt, Goeleven, Franck, & Crombez, 2005) and recall more negative memories (Hertel, 1998). Importantly, research shows that attention and memory biases predict the course of depressive symptoms over time (Disner, Shumake, & Beevers,
3
Running head: SPECIFIC AND OVERLAPPING COGNITIVE VULNERABILITY TO DEPRESSION
2017; Everaert, Duyck, & Koster, 2015; Goldstein, Hayden, & Klein, 2015; Johnson, Joormann, & Gotlib, 2007; Osinsky, Losch, Hennig, Alexander, & MacLeod, 2012). Therefore, cognitive biases can be considered as risk factors for symptoms of depression (Kraemer, Stice, Kazdin, Offord, & Kupfer, 2001). One important limitation that characterizes most previous research is that basic processes, such as attention and memory biases, were considered in isolation. Typically, studies have examined the association of depressive symptoms with one single bias at a time (Gotlib & Joormann, 2010; Mathews & MacLeod, 2005). On the contrary, investigators are increasingly arguing that cognitive biases function in concert to detrimentally impact emotional well-being and lead to full-blown depression (Beck & Bredemeier, 2016; Everaert, Koster, & Derakshan, 2012). As such, studies need to examine multiple cognitive biases in order to scrutinize their unique as well as common association with depressive symptoms. By doing so, it would be possible to cast new light on how biased information-processing mechanisms, either individually or in combination, influence depressive symptoms. Research on the interplay among attentional bias, memory bias, and depressive symptoms in subclinical samples has so far yielded interesting but mixed findings. On the one hand, studies show that across different methods attentional and memory biases are correlated with depressive symptoms with variable magnitude, ranging from negligible to moderate (De Voogd, Wiers, Prins, & Salemink, 2014; Everaert, Duyck, & Koster, 2014; Everaert, Tierens, Uzieblo, & Koster, 2013; Platt, Murphy, & Lau, 2015; Reid, Salmon, & Lovibond, 2006; Sanchez, Everaert, De Putter, Mueller, & Koster, 2015). On the other hand, although previous research provided some indications that attentional bias may predict subsequent memory bias (Ellis, Beevers, & Wells, 2011; Koster, De Raedt, Leyman, & De Lissnyder, 2010), a finegrained examination of how these two cognitive biases are simultaneously related to depression severity has yet to be conducted.
4
Running head: SPECIFIC AND OVERLAPPING COGNITIVE VULNERABILITY TO DEPRESSION
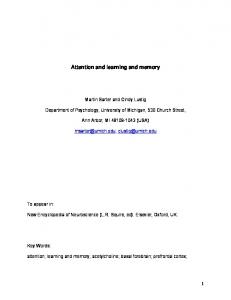
For all these reasons, it is timely to examine the unique and common contributions (i.e., the association structure) of these biases that are putatively important to the severity of depression (Cumming, 2012; Everaert et al., 2012; Kraemer et al., 2001). Several scenarios are possible. For example, if attentional bias and memory bias are highly correlated (i.e., multicollinearity), then most of the variance explained in depressive symptoms by one bias would interchangeably be explained by the other bias (i.e., overlap or the area represented as ‘C’ in Figure 1). Alternatively, if the association between these two biases is weak or modest then one would expect that different biases mostly have unique associations with depressive symptoms (specificity or the areas represented as ‘U1’ and ‘U2’ in Figure 1). It is worth mentioning that by closely investigating the association structure, it is possible to detect effects that would otherwise go undetected with standard analytic approaches (i.e., zero-order correlations and regression beta weights), such as suppression (Friedman & Wall, 2005; Kraha, Turner, Nimon, Zientek, & Henson, 2012). Therefore, the first goal of this study is to quantify the association structure (i.e., unique and common partitions) of attentional bias and memory bias with respect to subclinical depression. Attentional bias and memory bias are likely to play an important role in disorders other than depression. In fact, not only is depression often comorbid with anxiety (Borsboom, Cramer, Schmittmann, Epskamp, & Waldorp, 2011; Crawford & Henry, 2003), but also these two phenomena share partially similar underlying processes, such as negative affectivity (Mineka, Watson, & Clark, 1998). In keeping with this, the Research Domain Criteria of the National Institute of Mental Health (RDoC; Insel et al., 2010) frames attentional bias and memory bias as components of the psychobiological systems responsible for negative affect and characterizing both depression and anxiety (Negative Valence Systems; Sanislow et al., 2010). Therefore, our second goal is to quantify the degree of specificity and overlap of
5
Running head: SPECIFIC AND OVERLAPPING COGNITIVE VULNERABILITY TO DEPRESSION
attentional bias and memory bias for negative stimuli in relation to anxiety symptoms, as compared to depressive symptoms. Third, recent research stresses the heterogeneity of the depressive syndrome (Fried & Nesse, 2015), by showing that individual depressive symptoms vary on their genetic (Myung et al., 2012) or etiological (Fried, Nesse, Zivin, Guille, & Sen, 2014) background and their impact on psychosocial functioning (Fried & Nesse, 2014). Moreover, Marchetti, Loeys, Alloy, and Koster (2016) showed that major cognitive risk factors for depression (e.g., dysfunctional attitudes, rumination, and hopelessness) are differently related to depressive symptoms. Hence, in order to explore the scenario by which cognitive biases may be distinctively associated with individual depressive symptoms, we investigate the association structure of attentional and memory bias with each single depressive symptom. By doing so, we are able to detect links between biases and symptoms that would otherwise be unexplained when dealing with total scores. With these three goals in mind, we analyzed four previously collected datasets, consisting of both student and community samples. In order to fully capture the depressive spectrum, we made sure that our samples showed substantial variability in depressive and anxiety symptoms (Haslam, Holland, & Kuppens, 2012). In all four datasets, standard paradigms for attentional bias (e.g., spatial cueing task, dot-probe task, and eye movements for emotional words) and memory bias (i.e., retrieval of emotional sentences and retrieval of emotional self-attributed adjectives) were used, along with measures of depressive symptoms and anxiety symptoms. Importantly, the attentional and memory biases were considered with respect to depression-congruent material, such as stimuli featuring themes of sadness, loss, self-worthlessness, etc. (Peckham, McHugh, & Otto, 2010). Next, we analyzed the association structure (i.e., specificity and overlap) for each single study, with attentional and memory bias entered as predictors and either depression severity or anxiety severity serving as outcome.
6
Running head: SPECIFIC AND OVERLAPPING COGNITIVE VULNERABILITY TO DEPRESSION
Then, in line with recent statistical guidelines promoting meta-analytic thinking (Cumming, 2012), we ran a fixed-effect meta-analytic commonality analysis for every tested model so as to obtain method/sample-independent results. Finally, we investigated the association structure of cognitive biases with each single depressive symptom. Methods The present research presents data from four independent studies: Study #1 (Everaert et al., 2013), Study #2 (Everaert et al., 2014), Study #3 (Everaert et al., 2017), and Study #4 (Pearson, McGeary, Maddox, & Beevers, 2016). Participants. Study #1 included 64 undergraduate students (mean age: 19.79 ± 4.52, range: 17 – 48, 88.52% female). Study #2 included 70 undergraduate students (mean age: 20.31 ± 2.73, range: 17 – 33, 87.32% female; from the original 71 participants, 1 was excluded due to missing data on the memory bias task). Study #3 included 109 undergraduates (mean age: 21.65, 84.82% female; from the original 112 participants, 3 participants were excluded due to missing data on the memory bias task). Students in these three studies were from Ghent University (Belgium). In Study #4, 220 individuals from the community of Austin, TX (US) were recruited (mean age: 25.05 ± 4.3, range: 18 – 35, 58.18% female; 61.36% were Caucasian, 20% Asian, 4.55% African American, 8.09% multiracial, and 6% did not endorse race) and were assessed with Mini-International Neuropsychiatric Interview (Sheehan et al., 1998) to determine the absence of any current Axis I disorders. Materials Questionnaires. To measure depressive symptoms, the following instruments were used: the Beck Depression Inventory 2nd Edition (BDI-II; Beck, Steer, & Brown, 1996) in Studies #1, #2, and #3 (α = .86, .92, .93); and the Center for Epidemiologic Studies Depression Scale (CESD; Radloff, 1977) in Study #4 (α = .86). Individual levels of anxiety symptoms were
7
Running head: SPECIFIC AND OVERLAPPING COGNITIVE VULNERABILITY TO DEPRESSION
measured with the State-Trait Anxiety Inventory – Trait (STAI-T; Spielberger, Gorsuch, Lushene, Vagg, & Jacobs, 1983) in Study #1 and #2 (α = .92, .93), the Anxiety subscale of the Depression Anxiety and Stress Scales – 42 items (DASS-Anx; Lovibond & Lovibond, 1995) in Study #3 (α = .90), and the Anxious Arousal subscale of the Mood and Anxiety Symptom Questionnaire (MASQ-AA; Wardenaar et al., 2010, administered to 101 individuals only) in Study #4. Note that in each of the four studies, additional measures, unrelated to the current study’s goals, were administered. Attentional bias. In Study #1, attentional bias was operationalized using a modified spatial cueing task (Koster et al., 2010). On each trial, a black placeholder was presented to the left and right of a fixation cross. Then, a positive, negative, or neutral cue word appeared for 1500 ms in the space previously held by one of the placeholders. Upon stimulus offset, a dot appeared either in the same or opposite location of the cue word (i.e., valid vs. invalid trials, respectively). Participants were required to indicate the position of the dot by pressing the appropriate key on a keyboard as quickly and accurately as possible. A cue validity (CV) index was computed as the reaction time (RT) difference between invalid and valid trials. Attentional bias was operationalized as the difference between CV of negative trials and CV of neutral trials (diffCVneg). Higher scores represent more attention for negative relative to neutral words. Twenty negative, twenty neutral, and twenty positive words were used. Fifteen practice trails and two test blocks (each consisting of 120 trials) were administered to each participant (for further methodological details, see Everaert et al., 2013). In Studies #2 and #3, attentional bias was operationalized as selective attention in the context of a Scrambled Sentences Test (SST; Wenzlaff & Bates, 1998). Specifically, eyemovements were recorded while participants were unscrambling emotional sentences (i.e., “born I loser am winner a”) into positive or negative meanings (i.e., “I am a born winner” vs. “I am a born loser”). Each scrambled sentence contained six words that were shown for a
8
Running head: SPECIFIC AND OVERLAPPING COGNITIVE VULNERABILITY TO DEPRESSION
maximum of 8 s, and participants were required to report the first sentence that comes to mind by using five of the six displayed words. Note that each emotional scrambled sentences presented one positive and one negative word. Attentional bias was operationalized as the ratio between the number of fixations on negative words and the total number of fixations on emotional (negative and positive) words (Fixneg). A total of 60 (Study #2) or 28 (Study #3) emotional scrambled sentences were administered to each participant (for further methodological details, see (Everaert et al., 2014, 2017). In Study #4, attentional bias was measured with the emotional dot-probe task. After the offset of the initial fixation cross, a pair of stimuli depicting emotional (sad or happy) or neutral facial expression was shown for 1000 ms. Next, a target (either the letter “O” or “Q”) replaced one of the two stimuli and the participant was required to classify the letter either as “O” or “Q”. Twelve sad, 12 happy, and 24 neutral facial expressions were shown four times in two different blocks, for a total of 192 trials (for further methodological details, see (Pearson et al., 2016)). In the context of the dot-probe task, attentional bias for negative information was operationalized as an attentional bias score (ABS; Gotlib, Krasnoperova, Yue, & Joormann, 2004), in accordance to the following formula: 1 𝐴𝐵𝑆 = ([𝑅𝑡𝐿𝑠 − 𝑅𝑡𝑅𝑠] + [𝐿𝑡𝑅𝑠 − 𝐿𝑡𝐿𝑠]) 2 where R indicates right position, L indicates left position, t indicates target, and s indicates sad word stimulus. Positive values for ABS reflect a bias toward negative stimuli, whereas negative ABS values indicate a bias away from negative stimuli. It worth mentioning that similar results were obtained when attentional bias was operationalized as trial-level bias scores (TL-BS; Zvielli, Bernstein, & Koster, 2015), such as mean TL-BS toward negative information, mean TL-BS away from negative information, and TL-BS variability. Memory bias. In Studies #1, #2, and #3, upon completion of the SST and a subsequent filler task, participants were requested to accurately recall the sentences they had unscrambled 9
Running head: SPECIFIC AND OVERLAPPING COGNITIVE VULNERABILITY TO DEPRESSION
previously (i.e., incidental free recall test). Memory bias was operationalized as the ratio between the number of (correctly remembered) negative sentences and the number of all (correctly remembered) emotional sentences (SSTneg-recall). In Study #4, the self-referent encoding task (SRET; Derry & Kuiper, 1981) was administered. During this task participants were shown 52 interpersonally oriented adjectives (26 positive and 26 negative). Participants were required to decide as quickly as possible whether they endorsed each adjective as self-referential. After completion of the SRET, participants were requested to accurately recall the adjectives they had seen previously. Here, MB was operationalized as ratio between negative endorsed adjectives recalled and all the endorsed adjectives recalled (SRETneg-recall). Additional notes. In Studies #1, #2, and #3, the same material (i.e., emotional words) was used in the experimental paradigms capturing attentional and memory biases. In Study #4, different material was used (i.e., emotional faces in the dot probe task and emotional words [adjectives] in the SRET). Statistical Analysis We reported mean, standard deviation, range, and Pearson’s correlations among the set of variables considered throughout the four studies included. Then, in order to investigate the association structure between attentional bias and memory bias and in accounting for the criterion variable (i.e., depressive symptoms and anxiety symptoms), we ran a series of commonality analyses. Commonality analysis is a variance partitioning technique adopted to decompose model fit (R2) into non-overlapping uniquely and commonly explained partitions (Kraha et al., 2012; Marchetti et al., 2016; Prunier, Colyn, Legendre, Nimon, & Flamand, 2015; Ray-Mukherjee et al., 2014). When dealing with two predictors, commonality analysis yields three partitions (Figure 1), namely two partitions reflecting the amount of variance uniquely explained by either
10
Running head: SPECIFIC AND OVERLAPPING COGNITIVE VULNERABILITY TO DEPRESSION
attentional bias (U1) or memory bias (U2) and a third partition reflecting the amount of variance that can be explained interchangeably by either attentional or memory bias (C). The unique partition can be taken as indicating the degree of specificity of one predictor after controlling for the other ones, and it mathematically equates to squared semi-partial correlation. The common partition is to be taken as reflecting the degree of overlap of the two predictors in accounting for the criterion variable. Importantly, unlike unique partitions, the common partition may assume both positive and negative values, with negative values suggesting the possible presence of suppressor predictor variables (Kraha et al., 2012). In line with guidelines calling for bootstrapping (Nimon, Oswald, & Roberts, 2012; Prunier et al., 2015; Zientek & Thompson, 2006), we adopted percentile-based 95% twotailed bootstrap confidence intervals (10,000 bootstrap samples). At the level of each single partition, bootstrap estimation was used to quantify the precision of each partition rather than to accomplish null-hypothesis significance testing. The reason for this caveat is that, unlike common partitions, unique partitions are always positive; therefore, bootstrap confidence intervals containing zero are not possible. Moreover, all the partitions are quantified as R2 and they can be conventiently viewed as effect sizes (e.g., < 1% negligible, > 1% small, > 9% moderate, and > 25% large; Cohen, 1988). For all these reasons, we primarily referred to and commented on the practical significance of the reported effects (Durlak, 2009). All the commonality analyses were conducted in R 3.2.2, using the yhat 2.0 package (Nimon et al., 2012). Finally, in accordance with current statistical guidelines promoting meta-analytic thinking (Cumming, 2012), we integrated commonality analysis with meta-analysis. In this way, we could obtain a meta-analytic synthesis for each model across the four samples. Assuming that there is one true population effect, which underlies all the studies included in the analysis, we performed a fixed-effect meta-analysis. The population effect is estimated
11
Running head: SPECIFIC AND OVERLAPPING COGNITIVE VULNERABILITY TO DEPRESSION
using a weighted mean, where the weight assigned to each study is the inverse of that study’s variance. In each bootstrap sample, such fixed-effect can be estimated, and a 95% confidence interval for the common effect can be obtained. Moreover, when comparing the same partitions across two different models (i.e., unique component of memory bias for depressive symptoms vs. for anxiety symptoms), we calculated the difference in unique and common meta-analytic effects between outcomes in every bootstrap sample, and similarly obtained a 95% confidence interval for the difference. In sum, across the four included studies, we ran two meta-analytic commonality analyses with attentional bias and memory bias accounting for depression total score, and anxiety total score. Then, in order to account for any possible link between biases and individual depressive symptoms, we ran a meta-analytic commonality analysis with the two cognitive biases accounting for each of the twenty one depressive symptoms as listed by the BDI-II in Studies #1, #2, and #3. It is worth stressing that given the impossibility to match the single items of the measure for depression in Study #4 (CESD) one-to-one onto the BDI-II items, Study #4 was not included in the meta-analytic synthesis, but analyzed with a standard (i.e., non-meta-analytic) commonality analysis. Given the difference in the analytic method (i.e., inverse-variance weighting VS. no-weighting), we primarily commented on the first tertile of the most explained symptoms across the two analyses. Results Descriptive and Correlation Analysis Means, standard deviations, ranges, and Pearson’s correlations among attentional bias, memory bias, depression total score, and anxiety total score across the four included studies are reported in Table 1. Association structure of cognitive biases with depression severity
12
Running head: SPECIFIC AND OVERLAPPING COGNITIVE VULNERABILITY TO DEPRESSION
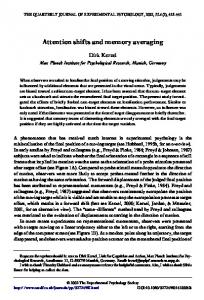
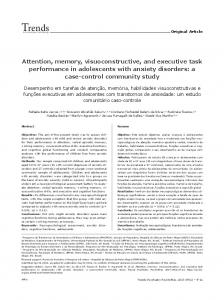
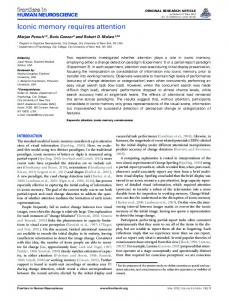
Table 2 and Figure 2 show the results of the commonality analysis with 95%-bootstrap CIs for both models across the four studies and the fixed-effect estimator. At the meta-analytic level, the unique component of memory bias was the only partition to meaningfully explain the depression total score (16.43% [11.19%; 23.62%], moderate effect). Neither the unique component of attentional bias nor the overlap between attentional and memory biases emerged as meaningful predictors of depression (1.07% [0.32%; 3.66%], small effect; -0.24% [-1.49%; 1.07%], negligible effect respectively). Association structure of cognitive biases with anxiety severity and comparison with the depressotypic association structure With respect to anxiety severity, at a meta-analytic level, the unique component of memory bias accounted for a limited amount of variance (4.97% [2.50%; 10.62%], small effect), whereas both the unique component of attentional bias and the overlap between attentional and memory bias did not show any association with anxiety severity (1.35% [0.39%; 5.59%], small effect; 0.03% [-0.80%; 1.16%], negligible effect respectively). Finally, at the meta-analytic level the unique component of memory bias explained significantly more variance for depression severity than for anxiety severity (11.46% [4.98%; 17.56%]), whereas neither attentional bias nor the overlap between attentional and memory bias were statistically different across the two models (-0.28% [-4.01%; 1.94%]; and -0.28% [-1.7%; 1.06%]; respectively) (Figure 3). Association structure of cognitive biases with depressive symptoms. The meta-analytic commonality analysis on the twenty-one depressive symptoms, as listed by BDI-II (Studies #1, #2, #3), revealed that the unique component of memory bias primarily explained sadness, pessimism, indecision, self-aversion, feelings of failure, suicidality, and worthlessness. All the other depressive symptoms were accounted for to a limited degree (see Figure 4 and Table S1). Importantly, the commonality analysis at the level
13
Running head: SPECIFIC AND OVERLAPPING COGNITIVE VULNERABILITY TO DEPRESSION
of each single depressive symptom, as measured by the CESD in Study #4, conveyed converging results with the previous analysis (see Figure 4 and Table S2), in that feelings of failure, sadness, depressed mood, hopelessness, worthlessness, lack of joy of life, lack of happiness, and loneliness were the symptoms explained by the unique component of memory bias. In general, the unique component of attentional bias and the common partition between attentional and memory bias were not associated in a meaningful way to any depressive symptom. Discussion Recent years have witnessed an upsurge of interest in the interplay between attention and memory biases as risk factors for depression. Yet a fine-grained examination of their degree of association with subclinical depression has never been conducted. To fill this gap, the present study aimed to quantify the magnitude of specificity and overlap of attentional and memory biases with depression and anxiety severity. This study further aimed to explore the specificity and overlap of these two biases with respect to each single depressive symptom reported on common self-report measures of depression. Finally, in order to obtain more generalizable and reliable estimates, we ran a fixed-effect meta-analysis that allowed us to synthetize information derived from different paradigms and different psychological measures. The major findings of our study are as follows. First, at a meta-analytic level, the magnitude of the association of the unique contribution of memory bias to depressive symptoms was substantial (~16%, moderate effect), whereas the magnitude of the same partition to anxiety symptoms was minimal (~5%, small effect). Importantly, these two estimates were significantly different. This result is particularly interesting considering the strong correlation between anxiety and depression (weighted r = 0.64, n = 344), as it suggests
14
Running head: SPECIFIC AND OVERLAPPING COGNITIVE VULNERABILITY TO DEPRESSION
that enhanced recall of depression-congruent material (e.g., sadness-, loss-, and worthlessnessrelated stimuli) is a specific marker of subclinical depression, but not for subclinical anxiety. In keeping with previous evidence showing the robust association of memory bias with clinical depression (Ellwart, Rinck, & Becker, 2003; Matt, Vazquez, & Campbell, 1992), our study indicates that preferential recall of depressotypic information is already present in individuals who are at-risk to develop a major depression. It is worth stressing that this result held across different samples, different tasks, different stimulus type, and different measures of symptoms of depression and anxiety. In addition, previous studies show that enhanced recall of threatening material characterizes anxiety (Mitte, 2008), while our study complements this evidence by showing that memory bias for depressotypic stimuli is hardly present in individuals with anxiety symptoms. Second, the unique component of memory bias was specifically related to a subgroup of cognitive-emotional symptoms, largely mapping on depressed mood, feelings of failure, worthlessness, and pessimism, along with suicidality, indecision, and feelings of loneliness. The strong association between memory bias and depressed mood is interesting, especially considering that low mood is the depressive symptom contributing the most to concurrent global impairment (Fried & Nesse, 2014). Moreover, the link between memory bias, worthlessness, and pessimism intriguingly suggests that enhanced retrieval for depressioncongruent material might potentially function as a mechanism underlying two main hubs of depression, namely the negative view of the self and of the future (Disner, Beevers, Haigh, & Beck, 2011; Roepke & Seligman, 2016). Altogether, these findings confirm that memory bias is strongly related to important elements of the depressotypic network that are likely to impact current and, perhaps, future mental well-being. Contrariwise, memory bias was completely unrelated to physiological-somatic symptoms of depression that are crucial for psychosocial functioning, such as concentration problems and fatigue (Fried & Nesse, 2014).
15
Running head: SPECIFIC AND OVERLAPPING COGNITIVE VULNERABILITY TO DEPRESSION
Interestingly, the differential association of memory bias with depressive symptoms mirrors the view recently proposed (Beck & Bredemeier, 2016). According to the authors, in response to a perceived loss, two parallel and relatively independent processes are initiated, namely the cognitive path and the physiological path. While the former is characterized by negative thoughts that allegedly cause the cognitive-emotional symptoms (e.g., sadness, worthlessness, suicidal ideation, etc.), the latter entails both autonomic and immune responses that lead to sickness-behaviors symptoms (e.g., fatigue, anhedonia, anorexia, etc.). In sum, memory bias seems to be mostly related to the cognitive dimension of depression, rather than mapping onto its physiological-somatic component (Fried & Nesse, 2014). Third, the unique component of attentional bias for depressotypic material did not emerge as a meaningful predictor in accounting for depression severity or any depressive symptom. Although this null finding could be due to methodological limitations that characterize the current paradigms for attentional bias (Cisler, Bacon, & Williams, 2009), our study is in line with previous evidence showing that the association between attentional bias and depression is not robust (Lichtenstein-Vidne et al., 2017; Mogg & Bradley, 2005). Moreover, our investigation documented a negligible direct association between attentional bias and anxiety severity, although this result could depend on the way this bias was operationalized. That is, we specifically focused on biased attention for depression-congruent material (Peckham et al., 2010), and not threatening stimuli that have been shown to be particularly salient for anxious individuals (Bar-Haim, Lamy, Pergamin, BakermansKranenburg, & van IJzendoorn, 2007). In sum, these findings may indicate that the role of biased attention toward depressive material as a direct correlate of subclinical depression and anxiety is limited. It is crucial to stress, however, that as a basic process attention is involved in many cognitive processes that are essential for mental functioning. For instance, evidence from cognitive science shows that
16
Running head: SPECIFIC AND OVERLAPPING COGNITIVE VULNERABILITY TO DEPRESSION
attention is fundamental for memory recall (Chun & Turk-Browne, 2007) and, more broadly, for many higher-order functions, such as appraisal and decision making (Chun, Golomb, & Turk-Browne, 2011). Therefore, it is possible that attention plays a major role in depression, though not at the level of depressive symptoms, but rather as a distal mechanism. This idea of attention as a distal mechanism of depression will be discussed further below. Fourth, the overlap between attentional and memory bias did not substantially account for any of the considered outcomes, as sporadically documented in studies with clinical and non-clinical samples (Gotlib, Kasch, et al., 2004; Vrijsen, van Oostrom, Isaac, Becker, & Speckens, 2014). Although unexpected, this finding does not invalidate the theoretical models invoking the involvement of multiple biases in depression (Everaert et al., 2012), but it rather spurs a more fine-grained specification of their possible interplay. The absence of any direct association between depressive symptoms and attentional bias, neither as a unique nor an overlapping partition, suggests that biased attention might exert its influence on depression mostly via indirect pathways (Kraemer et al., 2001; Mathieu & Taylor, 2006). In keeping with this idea, a recent cross-sectional study showed that attentional bias can account for concurrent depressive symptoms via multiple mediation of interpretation bias, ruminative thinking, and emotion regulation strategies (Everaert et al., 2017). Therefore, although we did not find evidence of an overlap between the two considered biases in subclinical samples, other types of interplay between these biases are possible and worth exploring. Despite these novel and intriguing findings, our study is characterized by several limitations. First, all the included studies are cross-sectional; therefore it is not possible to make any causal claims on the role of cognitive biases in leading to depression. Future studies using either prospective or experimental design could use the partitioning approach adopted in our study to investigate the unique and overlapping causal effects of cognitive biases on depression. Second, in our investigation, we included only biases in basic cognitive processes.
17
Running head: SPECIFIC AND OVERLAPPING COGNITIVE VULNERABILITY TO DEPRESSION
Although other processes may be of relevance (e.g. interpretation bias, emotional associations, or intrusive ideation; Mathews & MacLeod, 2005), the inclusion of variables closely mirroring the symptom contents could artificially inflate their association with the outcome variables, via either content redundancy or common-method bias (Podsakoff, MacKenzie, Lee, & Podsakoff, 2003). Furthermore, in future studies, more fine-grained sub-processes for each cognitive bias could be considered, such as disengagement impairments from negative information as a proxy for attentional bias (Gotlib and Joormann, 2010). Third, the included studies had different features, including students and community samples, different paradigms, different types of stimuli, and same/different set of stimuli across the biasesrelated tasks. Although this enhanced the generalizability of our findings, we could not investigate the moderating effect of these variables due to power issues. Future large-scale systematic reviews should take these features into account and better qualify the role played by these moderators. In closing, we believe that our study of the association structure between cognitive biases and depression is an important step in further understanding the relationship between information processing and depression. By adopting a meta-analytic perspective (Cumming, 2012), we considered multiple paradigms and psychological measures and provided robust and reliable evidence on the differential role of attentional and memory biases in relation to depression and anxiety.
18
Running head: SPECIFIC AND OVERLAPPING COGNITIVE VULNERABILITY TO DEPRESSION
Figures Caption Figure 1. Commonality analysis with attentional bias and memory bias used as predictors and either depressive symptoms or anxiety symptoms as outcome. U1 and U2: variance explained uniquely (i.e., specificity) by attentional bias (U1) and memory bias (U2), respectively. C1: variance explained interchangeably (i.e., overlap) by attentional bias or memory bias.
Figure 2. Commonality analysis and meta-analytic commonality analysis (95% bootstrap confidence intervals) with attentional bias and memory bias accounting for depression total score (upper part) and anxiety total score (lower part).
Figure 3. Comparison of the meta-analytic partitions across models (depression total score vs. anxiety total score).
Figure 4. Meta-analytic commonality on BDI-II depressive symptoms (upper part) and commonality analysis on CESD depressive symptoms (lower part).
19
Running head: SPECIFIC AND OVERLAPPING COGNITIVE VULNERABILITY TO DEPRESSION
Reference List Bar-Haim, Y., Lamy, D., Pergamin, L., Bakermans-Kranenburg, M. J., & van IJzendoorn, M. H. (2007). Threat-related attentional bias in anxious and nonanxious individuals: A meta-analytic study. Psychological Bulletin, 133(1), 1-24. doi: 10.1037/0033-2909.133.1.1 Beck, A. T., & Bredemeier, K. (2016). A Unified Model of Depression: Integrating Clinical, Cognitive, Biological, and Evolutionary Perspectives. Clinical Psychological Science, 4(4), 596-619. doi: 10.1177/2167702616628523 Beck, A. T., Steer, R. A., & Brown, G. K. (1996). Manual for the beck depression inventory-II. San Antonio: The Psychological Corporation. Borsboom, D., Cramer, A. O. J., Schmittmann, V. D., Epskamp, S., & Waldorp, L. J. (2011). The Small World of Psychopathology. Plos One, 6(11). doi: 10.1371/journal.pone.0027407 Chun, M. M., Golomb, J. D., & Turk-Browne, N. B. (2011). A Taxonomy of External and Internal Attention. Annual Review of Psychology, Vol 62, 62, 73-101. doi: 10.1146/annurev.psych.093008.100427 Chun, M. M., & Turk-Browne, N. B. (2007). Interactions between attention and memory. Current Opinion in Neurobiology, 17(2), 177-184. doi: 10.1016/j.conb.2007.03.005 Cisler, J. M., Bacon, A. K., & Williams, N. L. (2009). Phenomenological Characteristics of Attentional Biases Towards Threat: A Critical Review. Cognitive Therapy and Research, 33(2), 221-234. doi: 10.1007/s10608-007-9161-y Cohen, J. (1988). Statistical power analysis for the behavioral sciences (2nd ed.). Hillsdale, NJ: Lawrence Earlbaum Associates. Crawford, J. R., & Henry, J. D. (2003). The Depression Anxiety Stress Scales (DASS): Normative data and latent structure in a large non-clinical sample. British Journal of Clinical Psychology, 42, 111-131. doi: 10.1348/014466503321903544 Cuijpers, P., Beekman, A. T. F., & Reynolds, C. F. (2012). Preventing Depression A Global Priority. Jama-Journal of the American Medical Association, 307(10), 1033-1034. doi: 10.1001/jama.2012.271 Cuijpers, P., de Graaf, R., & van Dorsselaer, S. (2004). Minor depression: risk profiles, functional disability, health care use and risk of developing major depression. Journal of Affective Disorders, 79(1-3), 71-79. doi: 10.1016/S0165-0327(02)00348-8 Cuijpers, P., Koole, S. L., van Dijke, A., Roca, M., Li, J., & Reynolds, C. F. (2014). Psychotherapy for subclinical depression: meta-analysis. British Journal of Psychiatry, 205(4), 268-274. doi: 10.1192/bjp.bp.113.138784 Cuijpers, P., & Smit, F. (2004). Subthreshold depression as a risk indicator for major depressive disorder: a systematic review of prospective studies. Acta Psychiatrica Scandinavica, 109(5), 325-331. doi: 10.1111/j.1600-0447.2004.00301.x Cumming, G. (2012). Understanding the new statistics: Effect sizes, confidence intervals, and metaanalysis. New York, NY: Routledge. De Voogd, E. L., Wiers, R. W., Prins, P. J. M., & Salemink, E. (2014). Visual search attentional bias modification reduced social phobia in adolescents. Journal of Behavior Therapy and Experimental Psychiatry, 45(2), 252-259. doi: 10.1016/j.jbtep.2013.11.006 Derry, P. A., & Kuiper, N. A. (1981). Schematic Processing and Self-Reference in Clinical Depression. Journal of Abnormal Psychology, 90(4), 286-297. doi: 10.1037/0021-843X.90.4.286 Disner, S. G., Beevers, C. G., Haigh, E. A. P., & Beck, A. T. (2011). Neural mechanisms of the cognitive model of depression. Nature Reviews Neuroscience, 12(8), 467-477. doi: 10.1038/nrn3027 Disner, S. G., Shumake, J. D., & Beevers, C. G. (2017). Self-referential schemas and attentional bias predict severity and naturalistic course of depression symptoms. Cognition & Emotion, 31(4), 632-644. doi: 10.1080/02699931.2016.1146123 Durlak, J. A. (2009). How to Select, Calculate, and Interpret Effect Sizes. Journal of Pediatric Psychology, 34(9), 917-928. doi: 10.1093/jpepsy/jsp004
Running head: SPECIFIC AND OVERLAPPING COGNITIVE VULNERABILITY TO DEPRESSION
Ellis, A. J., Beevers, C. G., & Wells, T. T. (2011). Attention Allocation and Incidental Recognition of Emotional Information in Dysphoria. Cognitive Therapy and Research, 35(5), 425-433. doi: 10.1007/s10608-010-9305-3 Ellwart, T., Rinck, M., & Becker, E. S. (2003). Selective memory and memory deficits in depressed inpatients. Depression and Anxiety, 17(4), 197-206. doi: 10.1002/da.10102 Everaert, J., Duyck, W., & Koster, E. H. W. (2014). Attention, Interpretation, and Memory Biases in Subclinical Depression: A Proof-of-Principle Test of the Combined Cognitive Biases Hypothesis. Emotion, 14(2), 331-340. doi: 10.1037/a0035250 Everaert, J., Duyck, W., & Koster, E. H. W. (2015). Emotionally Biased Cognitive Processes: The Weakest Link Predicts Prospective Changes in Depressive Symptom Severity. Plos One, 10(5). doi: 10.1371/journal.pone.0124457 Everaert, J., Grahek, I., Duyck, W., Buelens, J., Van den Bergh, N., & Koster, E. H. W. (2017). Mapping the interplay among cognitive biases, emotion regulation, and depressive symptoms. Cognition & Emotion, 31(4), 726-735. doi: 10.1080/02699931.2016.1144561 Everaert, J., Koster, E. H. W., & Derakshan, N. (2012). The combined cognitive bias hypothesis in depression. Clinical Psychology Review, 32(5), 413-424. doi: 10.1016/j.cpr.2012.04.003 Everaert, J., Tierens, M., Uzieblo, K., & Koster, E. H. W. (2013). The indirect effect of attention bias on memory via interpretation bias: Evidence for the combined cognitive bias hypothesis in subclinical depression. Cognition & Emotion, 27(8), 1450-1459. Fried, E. I., & Nesse, R. M. (2014). The Impact of Individual Depressive Symptoms on Impairment of Psychosocial Functioning. Plos One, 9(2). doi: 10.1371/journal.pone.0090311 Fried, E. I., & Nesse, R. M. (2015). Depression sum-scores don't add up: why analyzing specific depression symptoms is essential. Bmc Medicine, 13. doi: 10.1186/s12916-015-0325-4 Fried, E. I., Nesse, R. M., Zivin, K., Guille, C., & Sen, S. (2014). Depression is more than the sum score of its parts: individual DSM symptoms have different risk factors. Psychological Medicine, 44(10), 2067-2076. doi: 10.1017/S0033291713002900 Friedman, L., & Wall, M. (2005). Graphical views of suppression and multicollinearity in multiple linear regression. American Statistician, 59(2), 127-136. doi: 10.1198/000313005x41337 Goldstein, B. L., Hayden, E. P., & Klein, D. N. (2015). Stability of self-referent encoding task performance and associations with change in depressive symptoms from early to middle childhood. Cognition & Emotion, 29(8), 1445-1455. doi: 10.1080/02699931.2014.990358 Gotlib, I. H., & Joormann, J. (2010). Cognition and Depression: Current Status and Future Directions. Annual Review of Clinical Psychology, Vol 6, 6, 285-312. doi: 10.1146/annurev.clinpsy.121208.131305 Gotlib, I. H., Kasch, K. L., Traill, S., Joormann, J., Arnow, B. A., & Johnson, S. L. (2004). Coherence and specificity of information-processing biases in depression and social phobia. Journal of Abnormal Psychology, 113(3), 386-398. doi: 10.1037/0021-843x.113.3.386 Gotlib, I. H., Krasnoperova, E., Yue, D. N., & Joormann, J. (2004). Attentional biases for negative interpersonal stimuli in clinical depression. Journal of Abnormal Psychology, 113(1), 127-135. doi: 10.1037/0021-843x.113.1.127 Gustavsson, A., Svensson, M., Jacobi, F., Allgulander, C., Alonso, J., Beghi, E., . . . Grp, C. S. (2011). Cost of disorders of the brain in Europe 2010. European Neuropsychopharmacology, 21(10), 718-779. doi: 10.1016/j.euroneuro.2011.08.008 Haslam, N., Holland, E., & Kuppens, P. (2012). Categories versus dimensions in personality and psychopathology: a quantitative review of taxometric research. Psychological Medicine, 42(5), 903-920. doi: 10.1017/S0033291711001966 Hertel, P. T. (1998). Relation between rumination and impaired memory in dysphoric moods. Journal of Abnormal Psychology, 107(1), 166-172. doi: 10.1037//0021-843x.107.1.166
21
Running head: SPECIFIC AND OVERLAPPING COGNITIVE VULNERABILITY TO DEPRESSION
Insel, T., Cuthbert, B., Garvey, M., Heinssen, R., Pine, D. S., Quinn, K., . . . Wang, P. (2010). Research Domain Criteria (RDoC): Toward a New Classification Framework for Research on Mental Disorders. American Journal of Psychiatry, 167(7), 748-751. doi: 10.1176/appi.ajp.2010.09091379 Johnson, S. L., Joormann, J., & Gotlib, I. H. (2007). Does processing of emotional stimuli predict symptomatic improvement and diagnostic recovery from major depression? Emotion, 7(1), 201-206. doi: 10.1037/1528-3542.7.1.201 Judd, L. L., Akiskal, H. S., Zeller, P. J., Paulus, M., Leon, A. C., Maser, J. D., . . . Keller, M. B. (2000). Psychosocial disability during the long-term course of unipolar major depressive disorder. Archives of General Psychiatry, 57(4), 375-380. doi: 10.1001/archpsyc.57.4.375 Koster, E. H. W., De Raedt, R., Goeleven, E., Franck, E., & Crombez, G. (2005). Mood-congruent attentional bias in dysphoria: Maintained attention to and impaired disengagement from negative information. Emotion, 5(4), 446-455. doi: 10.1037/1528-3542.5.4.446 Koster, E. H. W., De Raedt, R., Leyman, L., & De Lissnyder, E. (2010). Mood-congruent attention and memory bias in dysphoria: Exploring the coherence among information-processing biases. Behaviour Research and Therapy, 48(3), 219-225. doi: 10.1016/j.brat.2009.11.004 Kraemer, H. C., Stice, E., Kazdin, A., Offord, D., & Kupfer, D. (2001). How do risk factors work together? Mediators, moderators, and independent, overlapping, and proxy risk factors. American Journal of Psychiatry, 158(6), 848-856. doi: 10.1176/appi.ajp.158.6.848 Kraha, A., Turner, H., Nimon, K., Zientek, L. R., & Henson, R. K. (2012). Tools to support interpreting multiple regression in the face of multicollinearity. Frontiers in Psychology, 3. doi: 10.3389/fpsyg.2012.00044 Lépine, J.-P., & Briley, M. (2011). The increasing burden of depression. Neuropsychiatric Disease and Treatment, 7, 3-7. doi: 10.2147/NDT.S19617 Lichtenstein-Vidne, L., Okon-Singer, H., Cohen, N., Todder, D., Aue, T., Nemets, B., & Henik, A. (2017). Attentional bias in clinical depression and anxiety: The impact of emotional and nonemotional distracting information. Biological Psychology, 122, 4-12. doi: 10.1016/j.biopsycho.2016.07.012 Lovibond, P. F., & Lovibond, S. H. (1995). The Structure of Negative Emotional States - Comparison of the Depression Anxiety Stress Scales (Dass) with the Beck Depression and Anxiety Inventories. Behaviour Research and Therapy, 33(3), 335-343. doi: 10.1016/00057967(94)00075-U Marchetti, I., Loeys, T., Alloy, L. B., & Koster, E. H. (2016). Unveiling the Structure of Cognitive Vulnerability for Depression: Specificity and Overlap. PloS one, 11(12), e0168612. doi: 10.1371/journal.pone.0168612 Mathews, A., & MacLeod, C. (2005). Cognitive vulnerability to emotional disorders. Annual Review of Clinical Psychology, 1, 167-195. doi: 10.1146/annurev.clinpsy.1.102803.143916 Mathieu, J. E., & Taylor, S. R. (2006). Clarifying conditions and decision points for mediational type inferences in organizational behavior. Journal of Organizational Behavior, 27(8), 1031-1056. doi: 10.1002/job.406 Matt, G. E., Vazquez, C., & Campbell, W. K. (1992). Mood-Congruent Recall of Affectively Toned Stimuli - a Meta-Analytic Review. Clinical Psychology Review, 12(2), 227-255. doi: 10.1016/0272-7358(92)90116-P Mineka, S., Watson, D., & Clark, L. A. (1998). Comorbidity of anxiety and unipolar mood disorders. Annual Review of Psychology, 49, 377-412. doi: DOI 10.1146/annurev.psych.49.1.377 Mitte, K. (2008). Memory Bias for Threatening Information in Anxiety and Anxiety Disorders: A MetaAnalytic Review. Psychological Bulletin, 134(6), 886-911. doi: 10.1037/a0013343 Mogg, K., & Bradley, B. P. (2005). Attentional bias in generalized anxiety disorder versus depressive disorder. Cognitive Therapy and Research, 29(1), 29-45. doi: 10.1007/s10608-005-1646-y Munoz, R. F., Beardslee, W. R., & Leykin, Y. (2012). Major Depression Can Be Prevented. American Psychologist, 67(4), 285-295. doi: 10.1037/a0027666 22
Running head: SPECIFIC AND OVERLAPPING COGNITIVE VULNERABILITY TO DEPRESSION
Munoz, R. F., & Bunge, E. L. (2016). Prevention of depression worldwide: a wake-up call. Lancet Psychiatry, 3(4), 306-307. doi: 10.1016/S2215-0366(15)00555-6 Myung, W., Song, J., Lim, S. W., Won, H. H., Kim, S., Lee, Y., . . . Kim, D. K. (2012). Genetic association study of individual symptoms in depression. Psychiatry Research, 198(3), 400-406. doi: 10.1016/j.psychres.2011.12.037 Nimon, K., Oswald, F., & Roberts, J. K. (2012). Package ‘yhat’: Interpreting Regression Effects. Osinsky, R., Losch, A., Hennig, J., Alexander, N., & MacLeod, C. (2012). Attentional Bias to Negative Information and 5-HTTLPR Genotype Interactively Predict Students' Emotional Reactivity to First University Semester. Emotion, 12(3), 460-469. doi: 10.1037/a0026674 Pearson, R., McGeary, J. E., Maddox, W. T., & Beevers, C. G. (2016). Serotonin promoter polymorphism (5-HTTLPR) predicts biased attention for emotion stimuli: Preliminary evidence of moderation by the social environment. Clinical Psychological Science, 4(1), 122128. doi: 10.1177/2167702614562470 Peckham, A. D., McHugh, R. K., & Otto, M. W. (2010). A Meta-Analysis of the Magnitude of Biased Attention in Depression. Depression and Anxiety, 27(12), 1135-1142. doi: 10.1002/da.20755 Platt, B., Murphy, S. E., & Lau, J. Y. F. (2015). The association between negative attention biases and symptoms of depression in a community sample of adolescents. Peerj, 3. doi: 10.7717/peerj.1372 Podsakoff, P. M., MacKenzie, S. B., Lee, J. Y., & Podsakoff, N. P. (2003). Common method biases in behavioral research: A critical review of the literature and recommended remedies. Journal of Applied Psychology, 88(5), 879-903. doi: 10.1037/0021-9101.88.5.879 Pool, E., Brosch, T., Delplanque, S., & Sander, D. (2016). Attentional Bias for Positive Emotional Stimuli: A Meta-Analytic Investigation. Psychological Bulletin, 142(1), 79-106. doi: 10.1037/bul0000026 Prunier, J. G., Colyn, M., Legendre, X., Nimon, K. F., & Flamand, M. C. (2015). Multicollinearity in spatial genetics: separating the wheat from the chaff using commonality analyses. Molecular Ecology, 24(2), 263-283. doi: 10.1111/mec.13029 Radloff, L. S. (1977). The CES-D Scale A Self-Report Depression Scale for Research in the General Population. Applied Psychological Measurement, 1(3), 385-401. doi: 10.1177/014662167700100306 Ray-Mukherjee, J., Nimon, K., Mukherjee, S., Morris, D. W., Slotow, R., & Hamer, M. (2014). Using commonality analysis in multiple regressions: a tool to decompose regression effects in the face of multicollinearity. Methods in Ecology and Evolution, 5(4), 320-328. doi: 10.1111/2041210x.12166 Reid, S. C., Salmon, K., & Lovibond, P. F. (2006). Cognitive biases in childhood anxiety, depression, and aggression: Are they pervasive or specific? Cognitive Therapy and Research, 30(5), 531-549. doi: 10.1007/s10608-006-9077-y Roepke, A. M., & Seligman, M. E. (2016). Depression and prospection. British Journal of Clinical Psychology, 55(1), 23-48. doi: 10.1111/bjc.12087 Sanchez, A., Everaert, J., De Putter, L. M. S., Mueller, S. C., & Koster, E. H. W. (2015). Life is ... great! Emotional attention during instructed and uninstructed ambiguity resolution in relation to depressive symptoms. Biological Psychology, 109, 67-72. doi: 10.1016/j.biopsycho.2015.04.007 Sanislow, C. A., Pine, D. S., Quinn, K. J., Kozak, M. J., Garvey, M. A., Heinssen, R. K., . . . Cuthbert, B. N. (2010). Developing Constructs for Psychopathology Research: Research Domain Criteria. Journal of Abnormal Psychology, 119(4), 631-639. doi: 10.1037/a0020909 Sheehan, D. V., Lecrubier, Y., Sheehan, K. H., Amorim, P., Janavs, J., Weiller, E., . . . Dunbar, G. C. (1998). The Mini-International Neuropsychiatric Interview (MINI): The development and validation of a structured diagnostic psychiatric interview for DSM-IV and ICD-10. Journal of Clinical Psychiatry, 59, 22-33.
23
Running head: SPECIFIC AND OVERLAPPING COGNITIVE VULNERABILITY TO DEPRESSION
Spielberger, C. D., Gorsuch, R. L., Lushene, R., Vagg, P. R., & Jacobs, G. A. (1983). Manual for the State-Trait Anxiety Inventory. Palo Alto, CA: Consulting Psychologists Press. Vrijsen, J. N., van Oostrom, I., Isaac, L., Becker, E. S., & Speckens, A. (2014). Coherence Between Attentional and Memory Biases in Sad and Formerly Depressed Individuals. Cognitive Therapy and Research, 38(3), 334-342. doi: 10.1007/s10608-013-9590-8 Wardenaar, K. J., van Veen, T., Giltay, E. J., de Beurs, E., Penninx, B. W. J. H., & Zitman, F. G. (2010). Development and validation of a 30-item short adaptation of the Mood and Anxiety Symptoms Questionnaire (MASQ). Psychiatry Research, 179(1), 101-106. doi: 10.1016/j.psychres.2009.03.005 Wenzlaff, R. M., & Bates, D. E. (1998). Unmasking a cognitive vulnerability to depression: How lapses in mental control reveal depressive thinking. Journal of Personality and Social Psychology, 75(6), 1559-1571. doi: 10.1037/0022-3514.75.6.1559 Winer, E. S., & Salem, T. (2016). Reward Devaluation: Dot-Probe Meta-Analytic Evidence of Avoidance of Positive Information in Depressed Persons. Psychological Bulletin, 142(1), 1878. doi: 10.1037/bul0000022 Zientek, L. R., & Thompson, B. (2006). Commonality analysis: Partitioning variance to facilitate better understanding of data. Journal of Early Intervention, 28(4), 299-307. doi: 10.1177/105381510602800405 Zvielli, A., Bernstein, A., & Koster, E. H. W. (2015). Temporal dynamics of attentional bias. Clinical Psychological Science, 3(5), 772-788. doi: 10.1177/2167702614551572
24
Running head: SPECIFIC AND OVERLAPPING COGNITIVE VULNERABILITY TO DEPRESSION
Figure 1
25
Running head: SPECIFIC AND OVERLAPPING COGNITIVE VULNERABILITY TO DEPRESSION
Figure 2
26
Running head: SPECIFIC AND OVERLAPPING COGNITIVE VULNERABILITY TO DEPRESSION
Figure 3
27
Running head: SPECIFIC AND OVERLAPPING COGNITIVE VULNERABILITY TO DEPRESSION
Figure 4
28
Running head: SPECIFIC AND OVERLAPPING COGNITIVE VULNERABILITY TO DEPRESSION
Table 1. Descriptive statistics and Pearson’s zero-order correlations for Studies #1, #2, #3, and #4 Study #1 (n = 64)
M (SD)
Min
Max
AB
MB
diffCVneg (AB) SSTneg-recall (MB)
-7.70 (55.04) 41.34 (35.12) 15.23 (8.59) 47.92 (11.55) M (SD)
-133.5 0 0 25 Min
159.5 100 40 72 Max
1 .10 .19 .24 AB
1 .52*** .48*** MB
49.94 (4.36) 29.72 (26.72) 13.56 (9.57) 45.72 (11.84) M (SD)
40 0 0 24 Min
60 100 40 71 Max
1 .18 .27* .22 AB
1 .33** .34** MB
0.49 (0.05) 31.34 (30.47) 10.94 (10.00) 6.13 (6.72) M (SD)
0.33 0 0 0 Min
0.6 100 49 33 Max
1 .28** .05 -0.03 AB
1 .34*** .23* MB
0.77 (26.23) 0.14 (0.18) 8.78 (6.78) 21.10 (5.62)
-73.27 0 0 17
125.2 1 31 57
1 .09 -.07 -.07
1 .48*** .16
BDI-II (Depr. symp) STAI-T (Anx. symp)
Study #2 (n = 70) NegFix (AB) SSTneg-recall (MB) BDI-II (Depr. symp) STAI-T (Anx. symp)
Study #3 (n = 109) Fixneg (AB) SSTneg-recall (MB) BDI-II (Depr. symp) DASS-Anx (Anx. symp)
Study #4 (n = 220) ABS (AB) SRETneg-recall (MB) CESD (Depr. symp) MASQ-AA (n = 101) (Anx. symp)
Note: AB: attentional bias; MB: memory bias * p < .05; ** p < .01; *** p < .001
Depressive Symptoms
Anxiety Symptoms
1 .85*** Depressive Symptoms
1 Anxiety Symptoms
1 .81*** Depressive Symptoms
1 Anxiety Symptoms
1 .60*** Depressive Symptoms
1 Anxiety Symptoms
1 .43***
1
Running head: SPECIFIC AND OVERLAPPING COGNITIVE VULNERABILITY TO DEPRESSION
Table 2. Meta-analytic commonality analysis for depression and anxiety Depression Total Score
C(AB OR MB)
Study #1, R = .2845, n = 64 2.01% [0%; 13.1%] 24.79% [9.23%; 43.04%] 1.65% [-1.84%; 8.96%]
Study #2, R = .1527, n = 70 4.65% [0.03%; 20.06%] 7.92% [0.49%; 22.60%] 2.71% [-0.71%; 9.29%]
Study #3, R2 = .1176, n = 109 0.22% [0%; 4.87%] 11.51% [1.58%; 27.65%] 0.03% [-3.36%; 4.01%]
Study #4, R2 = .2460, n = 220 1.26% [0.02%; 4.68%] 24.16% [13.65%; 34.88%] -0.83% [-2.14%; 0.83%]
Fixed-effect common estimator, n = 463 1.07% [0.32%; 3.66%] 16.43% [11.19%; 23.62%] -0.24% [-1.49%; 1.07%]
Commonali ty Analysis
Study #1, R2 = .2705, n = 64
Study #2, R2 = .1425 , n = 70
Anxiety Total Score Study #3, R2 = .0644, n = 109
Study #4, R2 = .0309, n = 101
Fixed-effect common estimator, n = 344
U(AB)
3.64% [0.01%; 17.26%]
2.70% [0.01%; 13.64%]
0.95% [0%; 6.59%]
0.48% [0%; 9.21%]
1.35% [0.39%; 5.59%]
U(MB)
21.43% [7.5%; 39.93%]
9.26% [0.71%; 27.20%]
6.36% [0.17%; 20.86%]
2.62% [0.23%; 9.56%]
4.97% [2.50%; 10.62%]
C(AB OR MB)
1.98% [-2.2%; 9.1%]
2.29% [-0.87%; 7.67%]
-0.87% [-3.97%; 1.17%]
-0.01% [-0.97%; 1.37%]
0.03% [-0.80%; 1.16%]
Commonali ty Analysis U(AB) U(MB)
2
2
Note. U(AB): unique partition of attentional bias; U(MB): unique partition of memory bias; C(AB or MB): common partition of attentional and bias memory
30
Running head: SPECIFIC AND OVERLAPPING COGNITIVE VULNERABILITY TO DEPRESSION
Supplementary Material Table S1. Meta-analytic commonality analysis on BDI-II depressive symptoms, across Study #1, #2, and #3 (total n = 243) BDI #1 Sadness 2 Commonality Study #1, R = Study #2, R2 = Study #3, R2 = Fixed Effect Analysis .1493, n = 64 .1152, n = 70 .1288, n = 109 Common Estimator U(AB) 0% 2.46% 0.24% 0.66% [0%; 6.5%] [0.01%; 18.61%] [0%; 5.95%] [0.11%; 4.59%] U(MB) 14.82% 7.15% 10.76% 10.44% [2.23%; 36.73%] [0.1%; 25.89%] [2.02%; 24.10%] [4.61%; 20.22%] C(AB OR MB) 0.12% 1.91% 1.88% 0.81% [-2.10%; 4.11%] [-1.22%; 6.96%] [-1.49%; 6.85%] [-0.62%; 3.53%] BDI #2 Pessimism Commonality Study #1, R2 = Study #2, R2 = Study #3, R2 = Fixed Effect Analysis .1251, n = 64 .184, n = 70 .1152, n = 109 Common Estimator U(AB) 0.02% 6.85% 0% 0.64% [0%; 6.6%] [0.06%; 24.78%] [0%; 4.62%] 0.12%; 4.08%] U(MB) 12.46% 8.22% 10.54% 10.25% [1.61%; 29.51%] [0.61%; 23.83%] [1.42%; 27.47%] [4.54%; 19.38%] C(AB OR MB) 0.03% 3.33% 0.98% 0.62% [-2.29%; 3.33%] [-1.06%; 9.52%] [-2.71%; 5.09%] [-1.03%; 2.92%] BDI #3 Failures Commonality Study #1, R2 = Study #2, R2 = Study #3, R2 = Fixed Effect Analysis .1373, n = 64 .0507, n = 70 .1054, n = 109 Common Estimator U(AB) 0.03% 0.96% 0.11% 0.62% [0%; 8.44%] [0%; 8.83%] [0%; 4.68%] [0.1%; 4.00%] U(MB) 13.46% 3.30% 9.08% 6.42% [1.62%; 33.12%] [0.02%; 15.34%] [0.81%; 23.94%] [2.38%; 14.86%] C(AB OR MB) 0.25% 0.81% 1.35% 0.56% [-2.38%; 4.79%] [-0.81%; 3.83%] [-1.49%; 5.38%] [-0.52%; 2.80%] BDI #4 Anhedonia Commonality Study #1, R2 = Study #2, R2 = Study #3, R2 = Fixed Effect Analysis .008, n = 64 .0242, n = 70 .0581, n = 109 Common Estimator U(AB) 0.19% 0.06% 1.61% 1.24% [0%; 9.22%] [0%; 11.81%] [0.01%; 9.03%] [0.21%; 6.15%] U(MB) 0.54% 2.15% 5.40% 2.51% [0%; 11.64%] [0.01%; 13.22%] [0.21%; 17.01%] [0.65%; 8.87%] C(AB OR MB) 0.07% 0.21% -1.18% -0.14 [-1.42%; 1.42%] [-1.91%; 3.20%] [-4.23%; 0.98%] [-1.21%; 0.98%] BDI #5 Guilt Commonality Study #1, R2 = Study #2, R2 = Study #3, R2 = Fixed Effect Analysis .2351, n = 64 .0037, n = 70 .0766, n = 109 Common Estimator U(AB) 5.56% 0.15% 0.6% 1.15%
Running head: SPECIFIC AND OVERLAPPING COGNITIVE VULNERABILITY TO DEPRESSION
[0.15%; 16.74%] U(MB) C(AB OR MB)
15.90% [2.81%; 35.96%] 2.06% [-2.15%; 9.05%]
Commonality Analysis
Study #1, R2 = .108, n = 64
U(AB)
0.37% [0%; 8.94%] 9.94% [0.72%; 27.90%] 0.48% [-1.37%; 4.30%]
U(MB) C(AB OR MB)
Commonality Analysis
Study #1, R2 = .1537, n = 64
U(AB)
2.46% [0.01%; 11.32%] 11.71% [0.84%; 31.76%] 1.20% [-1.40%; 6.40%]
U(MB) C(AB OR MB)
Commonality Analysis
Study #1, R2 = .0882, n = 64
U(AB)
0.40% [0%; 7.45%] 7.98% [0.49%; 23.57%] 0.44% [-1.16%; 3.76%]
U(MB) C(AB OR MB)
Commonality Analysis
Study #1, R2 = .0798, n = 64
U(AB)
0.02% [0%; 9.58%] 7.96% [0.49%; 23.94%] -0.01% [-3.18%; 2.53%]
U(MB) C(AB OR MB)
[0%; 7.72%]
[0%; 6.29%]
0.15% 7.66% [0%; 6.78%] [0.51%; 22.05%] 0.07% -0.60% [-1.15%; 1.64%] [-3.89%; 2.18%] BDI #6 Punishment Study #2, R2 = Study #3, R2 = .0054, n = 70 .0163, n = 109 0.03% 0.74% [0%; 15.19%] [0%; 6.59%] 0.53% 0.45% [0%; 0.083%] [0%; 9.29%] -0.03% 0.44% [-1.97%; 1.73%] [-1.23%; 2.36%] BDI #7 Self-Aversion Study #2, R2 = .1043, n = 70
Study #3, R2 = .0596, n = 109
2.34% 0.63% [0.01%; 15.81%] [0%; 6.64%] 6.34% 5.95% [0.18%; 21.42%] [0.11%; 20.16%] 1.74% -0.62% [-1.06%; 7.85%] [-3.93%; 1.63%] BDI #8 Self-criticism Study #2, R2 = .0934, n = 70
Study #3, R2 = .0239, n = 109
4.51% 0.68% [0.03%; 19.26%] [0%; 6.57%] 3.15% 2.21% [0.02%; 12.98%] [0.01%; 12.64%] 1.68% -0.49% [-0.48%; 6.70%] [-2.83%; 1.23%] BDI #9 Suicidality Study #2, R2 = .1375, n = 70
Study #3, R2 = .0362, n = 109
1.40% 0.23% [0%; 12.74%] [0%; 4.2%] 10.50% 3.62% [0.56%; 30.01%] [0.01%; 16.21%] 1.85% -0.23% [-1.60%; 6.29%] [-2.57%; 1.16%] BDI #10 Cry
32
[0.28%; 5.20%] 1.93% [0.72%; 7.53%] 0.01% [-1.01%; 1.38%] Fixed Effect Common Estimator 0.91% [0.14%; 5.32%] 1.27% 0.34%; 6.70%] 0.12% [-0.86%; 1.43%] Fixed Effect Common Estimator 1.33% [0.22%; 5.80%] 7.24% [2.53%; 16.19%] 0.21% [-1.74%; 2.37%] Fixed Effect Common Estimator 1.02% [0.19%; 5.23%] 3.39% [0.96%; 10.02%] 0.11% [-1.26%; 1.71%] Fixed Effect Common Estimator 0.61% [0.09%; 3.98%] 6.28% [2.08%; 15.01%] 0.06% [-1.59%; 1.21%]
Running head: SPECIFIC AND OVERLAPPING COGNITIVE VULNERABILITY TO DEPRESSION
Commonality Analysis
Study #1, R2 = 0598, n = 64
U(AB)
2.76% [0.01%; 15.40%]
U(MB)
2.63% [0.01%; 17.90%] 0.58% [-0.94%; 4.74%]
C(AB OR MB)
Commonality Analysis
Study #1, R2 = 0405, n = 64
U(AB)
1.21% [0%; 13.66%] 2.46% [0.01%; 14.41%] 0.38% [-1.04%; 3.39%]
U(MB) C(AB OR MB)
Commonality Analysis
Study #1, R2 = 0984, n = 64
U(AB)
0.73% [0%; 8.29%]] 8.52% [0.19%; 25.52%] 0.58% [-0.89%; 5.60%]
U(MB) C(AB OR MB)
Commonality Analysis
Study #1, R2 = .1697, n = 64
U(AB)
0.78% [0%; 11.28%] 16.73% [2.55%; 37.70%] -0.55% [-4.27%; 3.06%]
U(MB) C(AB OR MB)
Study #2, R2 = .0723, n = 70
Study #3, R2 = .1171, n = 109
3.60% 2.61% [0.01%; [0.01%; 11.56%] 19.63%]] 2.34% 11.19% [0.01%; 11.66%] [1.96%; 24.93%] 1.29% -2.10% [-0.57%; 6.20%] [-5.62%; 1.74%] BDI #11 Agitation Study #2, R2 = .0360, n = 70
Study #3, R2 = .06, n = 109
1.07% 0% [0%; 10.77%] [0%; 4.63%] 1.90% 5.58% [0.01%; 12.81%] [0.27%; 17.96%] 0.64% 0.43% [-0.88%; 4.39%] [-2.17%; 3.86%] BDI #12 Loss of Interest Study #2, R2 = .0639, n = 70
Study #3, R2 = .0598, n = 109
4.06% 0.17% [0.01%; 19.92%] [0%; 4.89%] 1.28% 5.90% [0%; 13.09%] [0.1%; 18.81%] 1.04% -0.09 [-1.27%; 4.45%] [-3%; 2.46%] BDI #13 Indecision Study #2, R2 = .0525, n = 70
Study #3, R2 = .0707, n = 109
0% 0% [0%; 5.65%] [0%; 4.29%] 5.11% 6.46% [0.08%; 18.99%] [0.33%; 19.24%] 0.14% 0.61% [-2.34%; 2.92%] [-1.98%; 4.30%] BDI #14 Worthlessness
Commonality Analysis
Study #1, R2 = .3259, n = 64
Study #2, R2 = .1644, n = 70
Study #3, R2 = .0725, n = 109
U(AB)
1.19% [0%; 8.39%] 29.92%
12.64% [1.14%; 30.12%] 1.61%
0.45% [0%; 5.21%] 7.25%
U(MB)
33
Fixed Effect Common Estimator 2.90% [0.62%; 9.50%] 3.77% [1.30%; 10.74%] -0.12% [-1.35%; 2.42%] Fixed Effect Common Estimator 0.66% [0.09%; 4.35%] 3.04% [0.83%; 9.65%] 0.24% [-0.58%; 2.29%] Fixed Effect Common Estimator 0.77% [0.14%; 4.49%] 3.82% [1.11%; 11.60%] 0.25% [-1.04%; 2.29%] Fixed Effect Common Estimator 0.50% [0.07%; 3.53%] 7.29% [2.79%; 15.99%] 0.11% [-1.42%; 1.87%] Fixed Effect Common Estimator 1.05% [0.28%; 4.77%] 5.78%
Running head: SPECIFIC AND OVERLAPPING COGNITIVE VULNERABILITY TO DEPRESSION
[13.41%; 48.95%] 1.48% [-1.55%; 8.70%]
[0.01%; 12.30%]
Commonality Analysis
Study #1, R2 = .0680%, n = 64
Study #2, R2 = .0902, n = 70
U(AB)
4.10% [0.02%; 16.44%] 2.07% [0%; 13.85%] 0.63% [-0.74%; 4.82%]
C(AB OR MB)
U(MB) C(AB OR MB)
Commonality Analysis
Study #1, R2 = .0501%, n = 64
U(AB)
1.43% [0%; 12.87%] 3.13% [0.01%; 19.15%] 0.46% [-1.14%; 3.19%]
U(MB) C(AB OR MB)
Commonality Analysis
Study #1, R2 = .1417%, n = 64
U(AB)
0.04% [0%; 7.34] 13.85% [2.77%; 30.95%] 0.28% [-2.18%; 4.21%]
U(MB) C(AB OR MB)
Commonality Analysis
Study #1, R2 = .0017%, n = 64
U(AB)
0.05% [0%; 9.11%] 0.1% [0%; 6.15%] 0.02% [-1.04%; 0.81%]
U(MB) C(AB OR MB)
[0.41%; 21.81%]
[2.82%; 13.71%]
2.18% -0.44% [-1.05%; 7.66%] [-3.22%; 2.59%] BDI #15 Lack of Energy
0.39% [-1.43%; 2.89%]
Study #3, R2 = .0233, n = 109
3.12% 0.04% [0.02%; 15.71%] [0%; 4.99%] 4.28% 2.27% [0.05%; 16.12%] [0.01%; 11.74%] 1.63% 0.02% [-0.59%; 6.73%] [-2%; 2.32%] BDI #16 Sleep Problems Study #2, R2 = .0139, n = 70
Study #3, R2 = .0921, n = 109
0.02% 2.47% [0%; 6.5%] [0.03%; 10.13%] 1.27% 4.24% [0%; 12.9%] [0.05%; 16.11%] 0.10% 2.50% [-1.28%; 2.61%] [-0.01%; 7.26%] BDI #17 Irritability Study #2, R2 = .0362, n = 70
Study #3, R2 = .0326, n = 109
3.33% 2.40% [0.04%; 13.62%] [0.02%; 9.43%] 0.04% 1.75% [0%; 6.95%] [0.01%; 9.79%] 0.25% -0.88% [-1.89%; 2.31%] [-3.25%; 0.57%] BDI #18 Eating Problems Study #2, R2 = .0273, n = 70
Study #3, R2 = .0255, n = 109
1.43% 0.03% [0%; 17.35%] [0%; 3.34%] 0.82% 2.19% [0%; 11.86%] [0.03%; 9.22%] 0.48% 0.33% [-1.71%; 4.28%] [-1.2%; 2.13%] BDI #19 Concentration Problems
34
Fixed Effect Common Estimator 0.95% [0.20%; 5.03%] 2.72% [0.65%; 8.71%] 0.29% [-0.83%; 2.19%] Fixed Effect Common Estimator 1.24% [0.26%; 5.60%] 2.72% [0.61%; 9.95%] 0.34% [-0.45%; 2.14%] Fixed Effect Common Estimator 1.64% [0.40%; 5.97%] 1.56% [0.52%; 6.31%] -0.22% [-1.55%; 0.99%] Fixed Effect Common Estimator 0.43% [0.06%; 3.23%] 1.11% [0.22%; 5.13%] 0.06% [-0.71%; 0.83%]
Running head: SPECIFIC AND OVERLAPPING COGNITIVE VULNERABILITY TO DEPRESSION
Commonality Analysis
Study #1, R2 = .0399, n = 64
U(AB)
3.97% [0.04%; 15.50%] 0.13% [0%; 7.91%] -0.10% [-1.49%; 1.97%]
U(MB) C(AB OR MB)
Commonality Analysis
Study #1, R2 = .0865, n = 64
U(AB)
0% [0%; 6.62%] 8.58% [0.31%; 26.27%] 0.07% [-2.28%; 2.36%]
U(MB) C(AB OR MB)
Commonality Analysis
Study #1, R2 = .0192, n = 64
Study #2, R2 = .1638, n = 70
Study #3, R2 = .0635, n = 109
3.71% 0.01% [0.05%; 14.63%] [0%; 4.06%] 9.92% 5.70% [1.32%; 24.96%] [0.42%; 16.48%] 2.74% 0.64% [-0.64%; 8.91%] [-1.84%; 3.85%] BDI #20 Fatigue Study #2, R2 = .1029, n = 70
Study #3, R2 = .0102, n = 109
2.32% 0.49% [0.01%; 12.77%] [0%; 6.4%] 6.25% 0.81% [0.07%; 21.76%] [0%; 7.47%] 1.72% -0.27% [-0.54%; 6.45%] [-2.06%; 1.12%] BDI #21 Loss of Interest in Sex Study #2, R2 = .1202, n = 70
Study #3, R2 = .0481, n = 109
Fixed Effect Common Estimator 0.85% [0.21%; 4.23%] 2.55% [0.96%; 8.11%] 0.28% [-0.84%; 1.90%] Fixed Effect Common Estimator 0.87% [0.16%; 4.74%] 2.06% [0.58%; 7.88%] 0.06% [-1.27%; 1.17%]
Fixed Effect Common Estimator U(AB) 1.26% 1.28% 1.02% 1.15% [0%; 12.94%] [0%; 13.21%] [0%; 6.75%] [0.17%; 5.92%] U(MB) 0.49% 9.10% 4.63% 3.22% [0%; 10.88%] [0.52%; 24.95%] [0.06%; 17.27%] [0.97%; 10.19%] C(AB OR MB) 0.17% 1.64% -0.84% -0.05% [-1.33%; 1.87%] [-0.93%; 6.98%] [-3.52%; 0.93%] [-1.18%; 1.21%] Note. U(AB): unique partition of attentional bias; U(MB): unique partition of memory bias; C(AB or MB): common partition of attentional or bias memory
35
Running head: SPECIFIC AND OVERLAPPING COGNITIVE VULNERABILITY TO DEPRESSION
Table S2. Commonality analysis on CESD depressive symptoms in Study #4 (n = 220) CESD #1 Irritation CESD #2 Eating CESD #3 Rumination Problems Commonality Study #4, R2 = .0258, n = Study #4, R2 = .0200, n = Study #4, R2 = .0941 n = Analysis 220 220 220 U(AB) 1.20% 0.16% 0.91% [0%; 6.17%] [0%; 2.18%] [0%; 4.92%] U(MB) 1.13% 1.93% 8.95% [0%; 5.92%] [0.02%; 7.57%] [2.84%; 17.67%] C(AB OR MB) 0.24% -0.09% -0.46% [-0.11%; 1.26%] [-0.54%; 0.26%] [-1.53%; 0.63%] CESD #4 Worthlessness CESD #5 Concentration CESD #6 Depressed Problems Mood 2 2 Commonality Study #4, R = .1387, n = Study #4, R = .0274, n = Study #4, R2 = .2006, n = Analysis 220 220 220 U(AB) 0.16% 0.03% 3.17% [0%; 2.53%] [0%; 1.88%] [0.37%; 8.65%] U(MB) 13.87% 2.74% 18.15% [4.12%; 26.49%] [0.15%; 8.14%] [8.20%; 29.04%] C(AB OR MB) -0.16% -0.03% -1.26% [-1.06%; 1.21%] [-0.52%; 0.53%] [-3.10%; 0.64%] CESD #7 Fatigue CESD #8 Hopelessness CESD #9 Failure Commonality Study #4, R2 = .0186, n = Study #4, R2 = .1903, n = Study #4, R2 = .2402, n = Analysis 220 220 220 U(AB) 0.10% 3.22% 1.68% [0%; 2.82%] [0.49%; 8.24%] [0.07%; 5.45%] U(MB) 1.83% 17.05% 23.32% [0.02%; 7.25%] [6.45%; 30.50%] [7.55%; 41.09%] C(AB OR MB) -0.06% -1.24% -0.97% [-0.58%; 0.46%] [-3.14%; 0.56%] [-2.77%; 0.45%] CESD #10 Fearfulness CESD #11 Sleep CESD #12 Unhappiness Problems Commonality Study #4, R2 = .0643, n = Study #4, R2 = .0491, n = Study #4, R2 = .1246, n = Analysis 220 220 220 U(AB) 0.02% 1.17% 0.32% [0%; 1.82%] [0.01%; 4.47%] [0%; 3.17%] U(MB) 6.29% 4.11% 12.41% [1.07%; 15.51%] [0.14%; 12.55%] [4.48%; 22.90%] C(AB OR MB) 0.12% -0.37% -0.26% [-0.52%; 1.12%] [-1.16%; 0.25%] [-1.27%; 0.98%] CESD #13 CESD #14 Loneliness CESD #15 People Untalkativeness Unfriendly 2 2 Commonality Study #4, R = .0447, n = Study #4, R = .1204, n = Study #4, R2 = .0151, n = Analysis 220 220 220 U(AB) 0.01% 0% 0.64% [0%; 1.81%] [0%; 1.71%] [0%; 3.00%] U(MB) 4.38% 11.96% 1.02% [0.43%; 12.08%] [4.13%; 23.44%] [0%; 6.42%] C(AB OR MB) 0.08% 0.08% -0.14% 36
Running head: SPECIFIC AND OVERLAPPING COGNITIVE VULNERABILITY TO DEPRESSION
[-0.40%; 1.03%] [-0.64%; 1.70%] [-0.75%; 0.13%] CESD #16 Lack of Joie CESD #17 Cry CESD #18 Sadness de Vivre Commonality Study #4, R2 = .1379, n = Study #4, R2 = .0598, n = Study #4, R2 = .1861, n = Analysis 220 220 220 U(AB) 1.07% 1.18% 1.12% [0%; 5.66%] [0%; 5.28%] [0.01%; 4.52%] U(MB) 13.31% 5.22% 18.18% [4.66%; 25.32%] [0.88%; 12.74%] [8.42%; 29.88%] C(AB OR MB) -0.59% -0.42% -0.69% [-2.12%; 0.70%] [1.53%; 0.34%] [-2.12%; 0.58%] CESD #19 People CESD #20 Empasse Dislike Commonality Study #4, R2 = .0376, n = Study #4, R2 = .0201, n = Analysis 220 220 U(AB) 0.46% 0.35% [0%; 3.51%] [0%; 3.02%] U(MB) 3.51% 1.79% [0.30%; 10.11%] [0.02%; 7.09%] C(AB OR MB) -0.21% -0.13% [-0.96%; 0.44%] [-0.60%; 0.27%] Note. U(AB): unique partition of attentional bias; U(MB): unique partition of memory bias; C(AB or MB): common partition of attentional or bias memory
37