Aug 7, 2004 - appear on the Finale 2004 large orchestral score template file) played at crotchet (quarter note) = 40 for one semibreve each. The timbres were ...
Spectral centroid and timbre in complex, multiple instrumental textures Emery Schubert* , Joe Wolfe+, Alex Tarnopolsky+, *
School of Music and Music Education; +School of Physics University of New South Wales, Sydney, Australia
ABSTRACT This paper investigates the dependence of perceived timbral brightness on pitch and spectral centroid for single notes and pairs of simultaneous notes. In both cases, brightness is better correlated with the spectral centroid fc than with the ratio of fc to the pitches of the notes.
1.
Hypotheses
2.
Introduction
In a steady tone, the timbre depends, among other things, upon the power spectrum (the distribution of power as a function of frequency). Many researchers believe that the timbral quality of brightness correlates with increased power at high frequencies (eg. the vowel sound ‘ee’ sounds brighter than ‘oo’). One simple quantification the distribution in the power spectrum is the spectral centroid1, fc . What happens to the brightness of a musical note when the pitch frequency (F0) is shifted? In most cases, a higher pitched note has a somewhat higher fc than does a lower note played o n the same instrument. Does the higher fc of a high note produce greater perceived brightness? Or does human audition make some compensation for the F0 shift? Kendall & Carterette (1996) suggested that brightness might be better correlated with the ‘unitless centroid’, the ratio of the centroid to the fundamental frequency (i.e., fc /F0 hereafter the F0AC, for F0 Adjusted Centroid). The F0AC has the interesting property that a recording played back at a lower speed has the same F0AC as the original. Therefore, if brightness correlates well with ‘unitless centroid’, the brightness of the slowly replayed sound would be the same as that of the original. At least two studies support the F0-adjusted-centroid model of brightness perception (Kendall, Carterette, & Hajda, 1999; Kendall 2002; Marozeau, de Cheveigné, McAdams, S. & Winsberg, 2003). When Marozeau et al (2003) asked participants to try to ignore the pitch difference while rating brightness of tones with different F0 but matching spectral structure and loudness, they found reasonable equivalence.
1
For a power spectrum with components Pi(fi), f c is defined as SfiPi/SPI ,. fc is a frequency. Its definition resembles that of the centre of mass: it represents the power distribution over frequency rather than the mass distribution over position. Indeed if a graph of the spectrum were cut out on uniform paper, the centre of mass of the spectrum would lie on the centroid.
ISBN 1-876346-50-7 © 2004 ICMPC
We decided to examine further the relationship between fc and perceived brightness by examining brightness responses (1) without specifically requiring the participant to ignore pitch differences, but being cognizant of the distinction, (2) when chords are presented for comparison, rather than single tones, and (3) when tones were greater than an octave apart (Kendall, 2002, p. 597).
654
The results here may be cast as testing two hypotheses for the brightness of two-tone chords. The aggregate frequency centroid (AFC) hypothesis is that the brightness of two tones is simply correlated with fc . This might result if the brightness were analysed directly from the total spectrum of the chord. The F0-adjusted-centroid (F0AC) hypothesis is that brightness correlates with the average of the fc /F0. This might result if individual tones in a chord were analysed separately and then averaged. Note that this hypothesis is necessarily distinct from the AFC hypothesis because information about each tone’s spectral envelope is required.
3.
Design
Our design is different from that of Marozeau et al in several respects. First, we did not attempt to produce stimuli with equal loudness. Instead, we produced each stimulus with two loudness levels. AFC predicts that increased loudness in the higher pitch of a two note chord should increase the brightness because the overall spectral centroid is increased (the converse should also be true), whereas F0AC suggests that if the spectral shape and F0 remain constant, brightness should remain constant for that pitch regardless of loudness: overall brightness should not change. Second, we chose three test pitches above a low, base pitch, with each test pitch being at least two octaves above the base tone. The base pitch was E2 and the test pitches were E4, A#5 and E5. According to the AFC hypothesis, brightness ratings should increase as the added (test) pitch is increased. That is, E2 & E5 should be rated brighter than E2 & A#4 because the complete spectrum contains relatively more high frequency components. The A#4 was chosen because of the multidimensional nature of pitch (Krumhansl, 1990): it ensured that some variation in chroma is made, rather than octave variation alone. This could allow us to see if there were any effect on brightness response due to harmonic structure i n
ICMPC8, Evanston, IL, USA
August 3-7, 2004
two note chords. (The harmonics of E4 and E5 are subsets of those of E2 whereas A#4 has few harmonics that fall very close to those of E2.)
4.
Experiment 1
The aim of Experiment 1 was to select two timbres that were significantly different in perceived brightness ratings. The internal, computer generated MIDI instrument sounds used in Finale 2004 for OS10.2.6 (Finale 2004, 2004)2 were used. Finale has a default internal playback setting which uses the software sound module referred to as CoreMidi. Six participants with significant musical training (minimum of a Music degree completed) and normal hearing rated the brightness of 12 MIDI generated orchestral tones (which appear on the Finale 2004 large orchestral score template file) played at crotchet (quarter note) = 40 for one semibreve each. The timbres were generated at E2 and rated one by one. The stimuli were then generated again at the pitch A#4 and rated. Participants were asked to rate each note on a scale of 1 (very lacking in brightness) to 10 (very bright timbre) twice. They performed the task once for familiarization. Only the second ratings were analysed. All E2 comparisons were made in one sitting. All A#4 comparisons were made in a second sitting. That is, pitch was held constant across comparisons. Participants were reminded that timbre was multidimensional and that only one dimension, the brightness, was being rated. The sounds that produced the greatest mean difference i n subjective brightness ratings for both E2 and A#4 were selected to generate the stimuli for Experiments 2 and 3. The sounds used were ‘piccolo’ (which was rated, at constant pitch, as the least bright sound [coded in this paper as ‘-‘]) and trumpet (for the bright sounds [+]).
5.
Experiment 2
Stimuli Stimuli were generated from the two extremely different brightness rated tones determined in Experiment 1 (piccolo, rated as low in brightness [-] and trumpet, rated as high in brightness [+]) . For each of these, versions were created at four pitches (E2, E4, A#4 and E5) and 2 loudness levels (using the default forte [f] and p i a n o [p] setting in Finale notation software). A selection of these 2 x 4 x 2 stimuli were used for the experiment (shown in Fig 1 to conserve space). Each stimulus pair was presented twice, with order of presentation reversed. For each of the stimuli, the centroids were calculated using PsySound (Cabrera, 1999) or a routine written by the third author. For each pair (A/B) of stimuli the log ratio of centroids log(fcA/fcB.) was calculated to predict the brightness rating according to the AFC hypothesis (the A stimulus is brighter if log(fcA/fcB)>0). log(F0ACA/F0ACB) was also calculated t o predict the brightness response according to the F0AC hypothesis.
Procedure Participants were asked to rate the pitch, loudness and brightness differences within pairs. They were asked to rate other dimensions of the sound which may be related to timbre, namely vibrato (Jensen, n.d.), roughness (Terhardt, 1979), sharpness (Benedini, 1979) and warmth (Schubert, 19853). The intention of these additional ratings was to make the participant cognizant of the many dimensions that contribute to the timbre of sound apart from brightness. These additional data are not reported here. Data collection was performed o n software written by the first author.
Results
The aim of Experiment 2 was to examine individual tones with a priori differences in brightness, centroid, loudness and pitch (F0). The data were also used to extend previous findings about the relationship between perceived brightness at different centroid and fundamental frequencies.
Participants 16 participants with no or small degredation in hearing participated in the experiment. Most participants had significant musical experience, being enrolled in an undergraduate music degree, and/or having considerable experience as performing musicians with a mean of 4 years of formal training.
2
This choice of stimuli was made partly for ecological reasons, and partly to allow easy reproduction of the experiment by other investigators. A free version of Finale, called finale notepad, can be downloaded from http://www.finalemusic.com/.
655
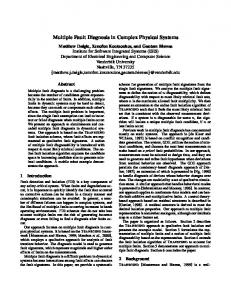
Subjective response was scored by adjusting all responses as though stimulus A were being compared with stimulus B (i.e., within pair randomization was removed). If A were rated as being more bright, loud, … etc. it was scored +2. If A were rated slightly more bright, loud… it was scored +1. If there were no rated difference, it was scored 0. If B were rated as more bright, loud etc, then A was scored –2. Finally if B were rated as slightly more bright, loud …, then A was scored –1. In Fig 1, the ordinate is used to plot the 95% confidence interval for the extent to which stimulus A was brighter than B on the score described above. In 1a, the abscissa is the ratio spectral centroids fcA and fcB calculated for A and B, on a log scale (log(fcA/fcB)). In 1b, it is the log of the F0 adjusted
3
Schubert (1985) argued that Benedini’s sharpness model should include an additional module which processes a quality of sounds he reported as being warmth which related t o attenuation of non-consecutive harmonics in a steady state tone.
ICMPC8, Evanston, IL, USA
August 3-7, 2004
centroid ratios (i. e., log([fc /F0]A/[fc /F0]B). Fig 1 shows that fc correlates better with brightness than fc /F0.
Stimuli A selection of two-tone chords was generated from the tones used in Experiment 1. Combinations were included which would contrast predictions of the two hypotheses. Predictions for brightness responses according to the AFC hypothesis were generated in the same way as in Experiment 2. For F0AC it was not clear how the two F0 adjusted ratios would be combined. We decided to take the average of the two ratios. (Consider for example the comparison when tones with identical spectral envelopes and different F0 are compared: according to F0AC, they should have the same brightness. Therefore, when sounded together they might well still have the same brightness.) With this speculation, the average of the fc/F0 values for each tone generated in Experiment 2 was taken. This value represented the speculated F0 adjusted centroid for the two-tone chord. The value for each two-tone chord was divided as described in Experiment 2 to produce the F0AC prediction of brightness response.
Procedure The same procedure was used as in Experiment 1, but this time only two questions were asked: whether there was a difference in loudness between example A and B, and whether there was a difference in brightness between examples A and B. Only brightness data are reported here.
Results
Figure 1. Perceived brightness ratings (95% CI) of single tone comparisons using (a) AFC [top] and (b) F0AC [bottom]. f denotes loud, p denotes soft; ‘+’ denotes bright timbre instrument (trumpet), ‘-‘ low brightness (piccolo).
Discussion This result casts some doubt over the notion that listeners make an F0 adjustment when judging brightness. However, this comparison is limited because a conscious effort has not been made to adjust for pitch. This leads to our next question: what would be the prediction of the two hypotheses for different versions of a two-tone chord?
6.
Experiment 3
The aim was to determine whether the F0AC or AFC hypotheses would better explain perceived brightness of two tone chords.
Participants Participants were those who completed Experiment 2.
656
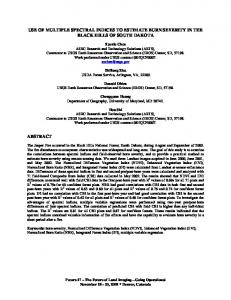
The scoring procedure was identical to that used in Experiment 2. Fig 2 shows the 95% confidence interval for a brightness increase. In 2a, the abscissas show the ratio of the spectral centroids (log(fcA/fcB)). In 2b, it shows the ratio of the average of the F0 adjusted centroids, (i.e., log([fc /F0]A/[fc /F0]B). Again, the brightness correlates better with the centroid of the complete spectrum than with the average of the F0 adjusted centroids.
7.
Discussion and Conclusion
Our experiments demonstrate little evidence to support use of the F0 adjusted centroid as a predictor or brightness. In contrast, the simple spectral centroid was a better predictor of perceived brightness. The finding was extended to brightness perception of two-tone chords. However, there was a difficulty in determining how the F0 adjustment should be made: the mean value had little utility. While other methods of determining how to combine the F0 adjusted centroid may be calculated, there is little doubt that, in addition to being a good predictor of perceived brightness, the centroid of the total spectrum (AFC) is also easy to calculate from commercial sound recordings. This is an important finding for researchers looking for acoustic models of brightness in rich and complex textures such as orchestras (Schubert, 2004), bands and ensembles, where there may be many notes of different timbres being played simultaneously and spreading over a range that exceeds two octaves.
ICMPC8, Evanston, IL, USA
August 3-7, 2004
8.
Acknowledgement
This paper was supported by an Australian Research Council Grant ARC-DP0452290 held by the first author, and conference travel support provided by the Research Committee, Faculty of Arts and Social Science, University of New South Wales.
9.
References
Benedini K. (1979). A functional model of timbre differences. Biological Cybernetics, 34, 111-117. Cabrera, D. (1999). Psysound: A computer program for the psychoacoustical analysis of music. Mikropolyphonie 5, Retrieved June, 1, 2003, from http://farben.latrobe.edu.au/mikropol Finale 2004 [computer software] (2004). MakeMusic Coda Music Technologues, http://www.finalemusic.com/. Jensen, K. (n.d.). The Timbre Model. Music Informatics Laboratory, Department of Datalogy, University of Copenhagen. Retrieved April, 14, 2004, from http://www.diku.dk/musinf/papers/mosart01-timbremodel.pdf Kendall, R. (2002). Musical timbre beyond a single note, II: Interactions of pitch chroma and spectral centroid, Proceedings of the 7th International Conference on Music Perception and Cognition, Sydney (pp. 596-599), C. Stevens, D. Burnham, G. McPherson, E. Schubert, J. Renwick (Eds.). Adelaide: Causal Productions.
Figure 2. Perceived brightness ratings (95% CI) of two-tone chord comparisons using (a) AFC [top] and (b) F0AC [bottom].
Kendall, R. & Carterette, E. (1996). Difference thresholds for timbre related to spectral centroid. Proceedings of the 4 th International Conference on Music Perception and Cognition (pp. 91-95). Montreal, Canada: ICMPC. Kendall, R., Carterette, E., & Hajda, J. (1999). Perceptual and acoustical features of natural and synthetic orchestral instrument tones, Music Perception, 16, 265–294.
The present study used realistic tones with instrument attack and decay present. In addition, note onsets were also not identical (a feature of the software’s humanization function). Changing pitches also produced some changes in spectral envelope, although the instruments selected in Experiment 1 ensured that this was minimized within instrument. However, the design of the present study aimed to produce some ecological validity, by using realistic MIDI sounds which are easy to reproduce (using Finale software). Another possible methodology for the future is to use a single tone which i s then sped up or slowed down to ensure that the F0 adjusted spectral envelope remain identical. This will allow another avenue for comparing the F0-adjusted centroid and the combined spectrum centroid hypotheses. In addition, further research needs to extend the number of tones sounded at the same time.
657
Krumhansl, C. L. (1990). Cognitive Foundations of Musical Pitch. New York: Oxford University Press. Marozeau, J., de Cheveigné, A., McAdams, S. & Winsberg, S. (2003). The dependency of timbre on fundamental frequency, Journal of the Acoustic Society of America, 114, 2946–2957. Schubert, E. (1985). A model for timbre perception. Unpublished undegraduate thesis, School of Electrical Engineering, University of New South Wales, Sydney, Australia. Schubert, E. (2004). Modeling perceived emotion with continuous musical features. Music Perception, 21, 561-585, Terhardt, E.(1974). Pitch, consonance, and harmony. Journal of the Acoustical Society of America,. 55, 1061-1069.