clustering for a large data set. To overcome this problem, we propose the method to reduce the similarity matrix size. First, using k-means, we obtain a clustering ...
Spectral Clustering for a Large Data Set by Reducing the Similarity Matrix Size Hiroyuki Shinnou, Minoru Sasaki Ibaraki University, 4-12-1 Nakanarusawa, Hitachi, Ibaraki, Japan 316-8511 shinnou, msasaki�@mx.ibaraki.ac.jp Abstract Spectral clustering is a powerful clustering method for document data set. However, spectral clustering needs to solve an eigenvalue problem of the matrix converted from the similarity matrix corresponding to the data set. Therefore, it is not practical to use spectral clustering for a large data set. To overcome this problem, we propose the method to reduce the similarity matrix size. First, using k-means, we obtain a clustering result for the given data set. From each cluster, we pick up some data, which are near to the central of the cluster. We take these data as one data. We call these data set as “committee.” Data except for committees remain one data. For these data, we construct the similarity matrix. Definitely, the size of this similarity matrix is reduced so much that we can perform spectral clustering using the reduced similarity matrix
1.
Introduction
In this paper, we proposed the method to reduce the similarity matrix size in order to use spectral clustering for a large data set. Document clustering is the task of dividing a document’s data set into groups based on document similarity. This is the basic intelligent procedure, and is important in text mining systems (Michael W. Berry, 2003). As the specific application, relevant feedback in IR, where retrieved documents are clustered, is actively researched (Hearst and Pedersen, 1996) (Kummamuru et al., 2004) etc. Spectral clustering is a powerful clustering method using partitioning of a graph (Ding et al., 2001). It uses an object function to find the optimal partition of the graph. The optimal solution of the object function corresponds to a solution of an eigenvalue problem. Using this solution, spectral clustering generates the final clustering result for the given data set. Spectral clustering is actually powerful, but needs to solve the eigenvalue problem of the Laplacian matrix converted from the similarity matrix corresponding to the given data set. Therefore, we cannot use spectral clustering for a large document data set (Dhillon et al., 2005)(Liu et al., 2007). In this paper, we propose the method to reduce the similarity matrix size. First, using k-means, we obtain a clustering result for the given data set. From each cluster, we pick up some data, which are near to the central of the cluster. We take these data as one data. We call these data set as “committee” according to the paper (Pantel and Lin, 2002). Data except for committees remain one data. For these data, we construct the similarity matrix. Definitely, the size of this similarity matrix is reduced so much that we can perform spectral clustering using the reduced similarity matrix Note that our method needs a reasonably accurate clustering result to reduce the similarity matrix size. Therefore, the final clustering result generated by spectral clustering must be improved from the initial clustering result. That is, our method is regarded as the method to improve the given clustering result. In the experiment, we used seven document data sets to
evaluate our method. We compared our method with kmeans and spectral clustering, Mcut. The experiment showed our method improves the clustering result generated by k-means. In future we will investigate the proper reduction degree, and improve the similarity definition.
2.
Spectral clustering
In spectral clustering the data set is represented as a graph. Each data point is represented as a vertex in the graph. If the similarity between data and � is non-zero, the edge between and � is drawn and the similarity is used as the weight of the edge. From this graph, clustering can be seen to correspond to the segmentation of the graph into a number of subgraphs by cutting the edges. The preferable cutting is such that the sum of the weights of the edges in the subgraph is large and the sum of weights of the cut edges is small. To find the ideal cut, the object function is used. The spectral clustering method finds the desirable cut by using the fact that an optimum solution of the object function corresponds to the solution of an eigenvalue problem. Different object functions are proposed. In this paper, we use the object function of Mcut (Ding et al., 2001). First, we define the similarity ��� �� � � between the subgraph �and � as follows:
��� �� � � � �� � �
The function �� � � is the sum of the weights of the edges between � and � . We define �� as �� ��. The object function of Mcut is the following:
��� �� � � ��� �� � � � (1) �� �� The clustering task is to find � and � to minimize the above � ��� �
equation. Note that the spectral clustering method divides the data set into two groups. If the number of clusters is larger than two, the above procedure is iterated recursively. The minimization problem of Eq. 1 is equivalent to the problem of finding the n dimensional discrete vector � to minimize the following equation:
�� � �� � �� �
(2)
where is the similarity matrix of data, � ���� �� and � � �� �� � � � � ��� . Each element in the vector � is � or ��, where
�� �� ��
�
�� � �� � �� � �� �
��
�¾�
�
and � � �� � �� . If the �-th element of the vector � is � (or ��), the �-th data element belongs to the cluster � (or � ). We can solve Eq. 2 by converting the discrete vector � to the continuous vector �. Finally, we can obtain an approximate solution to Eq. 2 by solving the following eigenvalue problem:
� �
�� �� �� � ��
(3)
We obtain the eigenvector � , that is, the Fielder vector, corresponding to the second minimum eigenvalue by solving the eigenvalue problem represented by Eq. 3. We can obtain the solution � to Eq. 2 from � � ��� . By the sign of the �-th value of �, we can judge whether the �-th data element belongs to cluster � or � . Note that Eq. 1 is the object function when the number of clusters is two. The object function used in NMF is the following general object function for � clusters.
�����½� ��½� � �����¾� ��¾� � � ������� ��� � � ��½� � ��¾ � � ��� �
���
���
(4)
� the complement of � . The smaller � ��� is, where is � � � � the better it is.
3.
Reduction of the similarity matrix size Suppose � is divided into cluster � and � by a spectral
�¼ � �¼ . Let ¼ the similarity matrix of � ¼ . The size of ¼ is � � � � �� � � � � � ��. It is clear that the above similarity definition is exact. It can be confirmed by applying the clustering result of � to � ¼ . That is, if data � � � �¼ belongs to the cluster � according to the clustering result of � , we set the cluster of data as � in the clustering result of � ¼ , And we set the cluster of data �¼ as �. Computing the value of Eq. 1 for this segmentation using ¼ , it is same to the value of Eq. 1 for the clustering result of � . The value of Eq. 1 for the clustering result of � is minimum. Therefore, spectral clustering for ¼ generates the same clustering result. 3.1.
We need the collect clustering result of data set � to reduce the similarity matrix size by the above method. However, it is impossible to obtain the collect clustering result. Here, we take notice that �¼ is a subset of �, and need not to be �. What we requires for �¼ is that �¼ does not include wrong data. We call this set �¼ as “committee” according to (Pantel and Lin, 2002). In this paper, we perform k-means first. From each cluster, we pick up some data, which are near to the central of the cluster. These picked up data is the committee. Specifically, committee is made by picking up 80% data of the cluster in this paper. However, this value is changeable. 3.2.
First, we define the similarity between � ¼ and data � � �¼ as follows:
�
��
�
1
� � ��� � � �
� �
�� �
(6)
Using Eq. 5 and Eq. 6, we can translate the set �¼ into one data �¼ . As the result, we obtain the new data set � ¼ � 1
� � means the complement set of � . ¼
¼
��� �¼ � �¼� ���
(5)
Next, we define the similarity between �¼ and �¼ as follows:
��� �¼ � �¼� �
��� �¼ � �� � � ��� �� � ��
(7)
� means the central point of �¼ . where �
�¼ � � � ��� � � � � � � � �
� ��� � � �
Improved similarity definition using central point
After making committees, we construct the small similarity matrix using Eq. 5 and Eq. 6. However, Eq. 5 and Eq. 6 cannot actually be used because Eq. 5 and Eq. 6 assume that �¼ does not include wrong data, but this assumption is wrong. Therefore, instead of Eq. 5 and Eq. 6, we must use the more practical similarity definition. Thus, we define them as follows:
clustering method. Note that the value of Eq. 1 for this segmentation is minimum. Now, we translate a subset �¼ � � into one data � ¼ .
��� �¼ � �� �
Construction of Committee by k-means
4.
(8)
Experiment
To confirm the effectiveness of our method, we performs our method for seven document data sets (tr12, tr31, mm, la12, sports, ohscal, cacmcisi) provided in CLUTO site 2 . Table 1 shows information of these data set: the number of data, the number of dimension, the number of non-zero data and the number of clusters. 2
http://glaros.dtc.umn.edu/gkhome/cluto/cluto/download
data tr12 tr31 mm cacmcisi la12 sports ohscal
Table 1: Data sets # of data # of dimension 313 5804 927 10128 2521 126373 4663 41681 6279 31472 8580 126373 11162 11465
5. # of clusters 8 7 2 2 6 7 10
Discussions
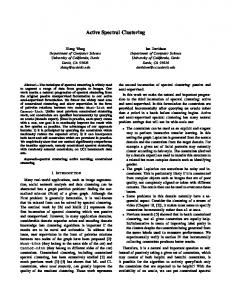
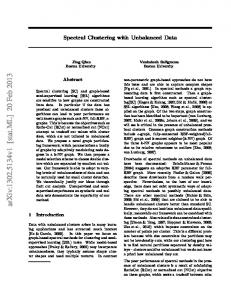
In the paper, our method sets the reduction degree to be 80%. However, this value is changeable. For the data set ‘mm’, we varied the reduction degree from 100% to 0%, in steps of 10%. The result is shown in Fig. 1 and Fig. 2.
0.99 0.985
First we perform k-means for the data set. Using distance between the central point of the cluster and data, we make a committee from each cluster. Next, using Eq. 7 and Eq. 8, we make the reduced similarity matrix. Finally, we perform spectral clustering using the reduced similarity matrix to obtain the final clustering result.
k-means
0.98 0.975 0.97
0.96
We evaluate our method by comparing it with k-means and Mcut. In this paper,we used entropy and purity for clustering evaluation. It is natural that our method is worse than Mcut. However, it is remarkable that our method is better than k-means. The size of four data set (cacmcisi、la12、 sports、ohscal) are big, so we cannot perform the spectral clustering, Mcut for these data sets. This experiment showed that our method can improve the clustering result generated by k-means.
Mcut
0.965
Figure 1: Entropy for the reduction degree
0.585
Mcut
0.58 0.575 0.57
data tr12 tr31 mm cacmcisi la12 sports ohscal
Table 2: Result (Entropy) Mcut k-means our method 0.3800 0.4366 0.3840 0.2946 0.3419 0.3414 0.9715 0.9847 0.9837 — 0.6768 0.6744 — 0.4523 0.4575 — 0.3142 0.3049 — 0.5678 0.5722
0.565 0.56 0.555 0.55
k-means
Figure 2: Purity for the reduction degree
Theoretically, the larger the reduction degree is, the nearer the result is to result of k-means. And the smaller the reduction degree is, the nearer the result is to result of Mcut. Moreover, the change must be monotonous. data tr12 tr31 mm cacmcisi la12 sports ohscal
Table 3: Result (Purity) Mcut k-means our method 0.7061 0.6550 0.6741 0.8037 0.7605 0.7702 0.5799 0.5601 0.5688 — 0.6869 0.6869 — 0.7015 0.7019 — 0.7735 0.7871 — 0.5434 0.5440
Curves of Fig. 1 and Fig. 2 are not exactly monotonous. However they are likely to be monotonic. We can consider two reasons that curves are not exactly monotonous. The one is that our committee includes error, and another is that the similarity definition is not proper. In future we will investigate the proper reduction degree, and improve the similarity definition. Lastly, we note that viewing our method as method to improve the given clustering result, “first validation” of (Dhillon et al., 2002) and “Link based refinement” of (Ding et al., 2001) are informative to refine our method.
6.
Conclusion
In this paper, we proposed the method to reduce the similarity matrix size in order to use spectral clustering for a large data set. Our method needs a reasonably correct clustering result to reduce the similarity matrix size. Thus, our method is regarded as the method to improve the given clustering result. The experiment using seven data sets showed that our method improves the clustering result generated by kmeans. In future we will investigate the proper reduction degree, and improve the similarity definition.
Acknowledgements This research was partially supported by the Ministry of Education, Science, Sports and Culture, Grant-in-Aid for Scientific Research on Priority Areas,“ Japanese Corpus ”, 19011001, 2007.
7.
References
Inderjit S. Dhillon, Yuqiang Guan, and J. Kogan. 2002. Iterative Clustering of High Dimentional Text Data Augmented by Local Search. In The 2002 IEEE International Conference on Data Mining, pages 131–138. Inderjit Dhillon, Yuqiang Guan, and Brian Kulis. 2005. A Unified View of Kernel k-means, Spectral Clustering and Graph Cuts. In The University of Texas at Austin, Department of Computer Sciences. Technical Report TR04-25. Chris Ding, Xiaofeng He, Hongyuan Zha, Ming Gu, and Horst Simon. 2001. Spectral Min-max Cut for Graph Partitioning and Data Clustering. In Lawrence Berkeley National Lab. Tech. report 47848. Marti A. Hearst and Jan O. Pedersen. 1996. Reexamining the cluster hypothesis: Scatter/gather on retrieval results. In Proceedings of SIGIR-96, pages 76–84. Krishna Kummamuru, Rohit Lotlikar, Shourya Roy, Karan Singal, and Raghu Krishnapuram. 2004. A Hierarchical Monothetic Document Clustering Algorithm for Summarization and Browsing Search Results. In Proceedings of WWW-04, pages 658–665. Tie-Yan Liu, Huai-Yuan Yang, Xin Zheng, Tao Qin, and Wei-Ying Ma. 2007. Fast Large-Scale Spectral Clustering by Sequential Shrinkage Optimization. In ECIR, pages 319–330. Michael W. Berry, editor. 2003. Survey of Text Mining: Clustering, Classification, and Retrieval. Springer. P. Pantel and D. Lin. 2002. Document clustering with committees. In Proceedings of SIGIR-02.