Sep 29, 2009 - arXiv:0909.5453v1 [math. ... (Here SNâ1 denotes the unit sphere in N dimensions.) ... A relatively recent and important class of methods for locating the singular support is based on concentration kernels [10, 12, 14, 15, 16], ... be solved and an overview of the full edge detection procedure (section 2.4).
arXiv:0909.5453v1 [math.NA] 29 Sep 2009
Spectral edge detection in two dimensions using wavefronts L. Greengard and C. Stucchio September 29, 2009 Abstract A recurring task in image processing, approximation theory, and the numerical solution of partial differential equations is to reconstruct a piecewise-smooth real-valued function f (x), where x ∈ RN , from its truncated Fourier transform (its truncated spectrum). An essential step is edge detection for which a variety of one-dimensional schemes have been developed over the last few decades. Most higher-dimensional edge detection algorithms consist of applying one-dimensional detectors in each component direction in order to recover the locations in RN where f (x) is singular (the singular support). In this paper, we present a multidimensional algorithm which identifies the wavefront of a function from spectral data. The wavefront of f is the set of points (x, ~k) ∈ RN × (S N−1 /{±1}) which encode both the location of the singular points of a function and the orientation of the singularities. (Here S N−1 denotes the unit sphere in N dimensions.) More precisely, ~k is the direction of the normal line to the curve or surface of discontinuity at x. Note that the singular support is simply the projection of the wavefront onto its x-component. In one dimension, the wavefront is a subset of R1 × (S 0 /{±1}) = R, and it coincides with the singular support. In higher dimensions, geometry comes into play and they are distinct. We discuss the advantages of wavefront reconstruction and indicate how it can be used for segmentation in magnetic resonance imaging (MRI).
1
Introduction
Consider an image, i.e. a function ρ : R2 → R+ . If the image is smooth (e.g. b ~k), will decay rapidly C m (R2 )), then the Fourier transform of ρ(x), denoted ρ( ~ b ~k) (and hence be localized near k = 0). Discontinuities in the image cause ρ( to decay more slowly as |~k| → ∞. Thus, information about the discontinuities b ~k). The goal can be said to be encoded in the high frequency components of ρ( of spectral edge detection is to recover the location of the discontinuities from b ~k). limited (and often noisy) information about ρ( As an example, consider the function ρ(x) = 1B (x) which is equal to 1 inside B = {x : |x| < 1} and 0 elsewhere. The set of discontinuities of this function (the 1
singular support) is given by {x : |x| = 1}. One natural approach to computing the curve on which the discontinuities lie is to first find a set of point which lie in the singular support, followed by an algorithm aimed at connecting these points sets into a finite number of curves. In our example, the output would be the unit circle. A relatively recent and important class of methods for locating the singular support is based on concentration kernels [10, 12, 14, 15, 16], a high pass filtering approach, which we describe briefly below. For the function ρ(x) = 1B (x), the normal at each point of discontinuity x is simply the normal to the unit circle at that point. The wavefront of this function is, therefore, {(x, k)}, with |x| = 1 and ~k k x. In this paper, we study the problem of extracting the wavefront from continuous spectral data available in a finite frequency range |~k| < kmax in two dimensions. This extra information is useful practically as well as theoretically. First, it is easier to reconstruct curves of discontinuity from points in the wavefront than points in the singular support, both in closing “gaps” and in associating points on close-to-touching curves to the correct one [2, 7, 8, 9, 17]. Second, the directional information is useful for noise removal. If spurious points are included in the wavefront set, the normal (or tangent) data allows us to filter it out; it is unlikely that a random point and a random tangent will be consistent with the points and tangents that come from the actual curves of discontinuity, as we have shown previously in [17]. Our approach to edge detection is based on applying concentration kernels (high pass filters) to angular slices of the Fourier data. Rather than recovering the points on the edges (as in [10, 15, 16]), we also determine the direction of the normal. In section 2, we present a precise statement of the problem to be solved and an overview of the full edge detection procedure (section 2.4). In section 3, we present a detailed analysis of the asymptotic behavior of the Fourier transform of the characteristic function of a smooth region. Section 4 is devoted to a discussion of the directional filters used to extract wavefront data and Section 6 describes the full algorithm. Many of the proofs are technical and we have relegated most proofs to the appendices. We discuss the application of our method to magnetic resonance imaging (MRI), where raw data is acquired in the Fourier domain, extending the algorithm of [14]). Finally, we note that our algorithm is closely related to the recent paper [18], which describes a wavefront extraction procedure based on the shearlet transform, extending the use of curvelets in [5, 6].
2
Mathematical Formulation
Let ρ(x) be a piecewise smooth function form R2 → R, and let χ(x) be a C ∞ compactly supported radial function. The singular support of ρ(x) consists of the points x0 ∈ R2 for which χ(λ(x − x0 ))f (x) has slowly decaying Fourier
2
transform for every λ > 0, i.e.: Z i~ k·x ∀λ > 0, sup e ρ(x)χ((x − x0 )λ)dx = O(kr −3/2 ) |~k|≥kr
(2.1)
In order to find the singular support, concentration kernel methods [10, b ~k) by a function which gives heavier 12, 14, 15, 16] multiply the Fourier data ρ( weight to high frequencies than to low frequencies (a high-pass filter). Since high frequencies encode the location of singularities but are unaffected by smooth parts of the image, this method isolates discontinuities from the rest of the image. In short, concentration kernel methods find the location of singularities by flagging local maxima in the inverse Fourier transform of the high-pass filtered Fourier data. The wavefront of a function consists of the points (x0 , ~k0 ) ∈ R2 × S1 for which the Fourier transform of χ(λ(x − x0 ))ρ(x) decays slowly in the direction ~k0 = (kr , kθ ): Z irk0 ·x ∀λ > 0, sup e (2.2) ρ(x)χ((x − x0 )λ)dx = O(kr −3/2 ) r≥kr
As indicated in the introduction, while the singular support of ρ(x) only contains the location of singularities, the wavefront also contains the direction of the singularities.
Remark 2.1 In the language of computational geometry, the singular support is a set of points, while the wavefront is a set of surfels (pairs of the form (x, k) with x representing a position and k a direction).
2.1
Definition of the image class
To simplify the theory, we consider a special class of images. In particular, we consider two-dimensional images supported on [0, 1]2 and vanishing near the boundaries, which consist of a set of piecewise constant functions on which is superimposed a globally smooth function: M−1 X ρ(x) = ρj 1γj (x) + ρtex (x) (2.3) j=0
where γj (t) are simple closed curves, and 1γj (x) = 1 for x in the interior of γj ~ and 0 elsewhere. The “texture” term ρtex (x) is band limited, i.e. ρd tex (k) = 0 ~ for k ≥ ktex .
Definition 2.2 Let γj (t) be a simple closed curve. The curvature at each point is denoted by κj (t), the normal to γj (t) is denoted by Nj (t), and the tangent is denoted by Tj (t). 3
�1 �2
Separtionbwcuvs
Figure 1: An illustration of Assumption 2. The black arrow illustrates the condition (2.5a), while the red arrow illustrates the condition (2.5b). Assumption 1 We assume the curves have bounded curvature, i.e.: ′ γ (t)γ ′′ (t) − γ ′ (t)γ ′′ (t) i,x i,y i,y i,x ∀i = 0 . . . M − 1, κi (s) = ≤κ ¯ ′ (t)2 + γ ′ (t)2 )3/2 (γi,x i,y
(2.4)
Assumption 2 We also assume that the curves are separated from each other (see Fig. 1): sup |γi (t) − γj (t′ )| ≥ δ for i 6= j (2.5a) t,t′
and that different areas of the same curve are separated from each other, i.e. if the curves are parameterized to move at unit speed, then: sup |t−t′ |>¯ κ−1 π/2
|γi (t) − γi (t′ )| ≥ δ
(2.5b)
In order to extract the wavefront, we assume each edge is associated with a sufficiently large discontinuity. Since our wavefront detector decays somewhat slowly away from the wavefront, we also assume that the discontinuity is bounded from above, so as not to pollute nearby edges of lower contrast. We formalize this as: Assumption 3 We assume the contrast of the discontinuities in the image is bounded above and below: 0 < ρ ≤ ρj ≤ ρ (2.6) 4
b ~k) obThe data we are given and wish to segment are noisy samples of ρ( tained on a 2m × 2m grid with spacing 2π in ~k-space centered at the origin: ~k ∈ 2πZ2m with Z2m = {−2m−1 , . . . , 2m−1 − 1}2 . Our segmentation goal is to recover the curves γj (t). With the preceding sampling, we may define the maximum frequency available in the image as kmax = 2π2m−1 . We assume that ktex < kmax . More precisely, we assume that kmax − ktex ≥ 12 · 2π, providing at least 12 lattice points in the sampling beyond ktex . In most of our experiments, we take ktex = 2π · 16, and kmax = 2π · 32. Finally, we make the technical assumption that the curves have non-vanishing curvature: Assumption 4 We assume that the curvature of the curves is bounded below. ∀i = 0 . . . M − 1, κi (s) ≥ κ > 0
(2.7)
Remark 2.3 The assumption (2.7) implies that the region bounded by γi (t) is convex. This geometric fact is not used by our algorithm in any way. Remark 2.4 Assumption 4 is introduced only because it is required below by our proof technique for the correctness of the directional filters. It is not strictly necessary, and it would be straightforward to extend our analysis to cases where the curvature vanishes. This, however, would require more complicated conditions on higher derivatives of γj (t) in places where the curvature vanishes, and correspondingly more complicated proofs. See Figure 6 which illustrates that our algorithm works even when Assumption 4 is violated.
2.2
Wavefront Extraction Methodology
The algorithm we present in this work takes an image, given as spectral data b ~k), and extracts a set of surfels sampled from the wavefront. We do this in ρ( two steps. First, we construct a set of directional filters: ˆ b ~k)] = F −1 [W(kr )V(kθ − θ)ρ( [Dθ,α ρ](x)
(2.8)
Here, W(kr ) is a high pass filter in the radial direction (the radial filter ), V is a smooth function, compactly supported on [−α, α] (the angular filter ), and F is the Fourier transform. Note that, given a direction θ, the angular filter is supported on the angular window [θ − α, θ + α]. The angular and radial filters will be related by the parabolic scaling: width2 = length (Equivalently, they will be chosen to satisfy width = length2 in the x-domain.) In particular, this implies that the filter angle α ∼ (pass-band)−1/2 , where pass-band is the center of the pass-band of the radial filter (to be determined in section 4). 5
b ~k), the directional filters will return a funcWhen applied to the function ρ( tion which is small except near locations where Nj (t) points in the direction θ. This allows us to pinpoint the locations of singularities with direction θ. The result is, in some sense, a directional version of the jump function of [10, 14, 15, 16]. Spikes (local maxima) obtained from these directional filters correspond to surfels in the wavefront of the image. Remark 2.5 For the algorithm described here to work, it is required that accurate values of the continuous spectral data be available. The discrete Fourier transform (DFT) of ρ(x) can not be used as a substitute for the continuous data, since aliasing induced by the DFT will destroy the asymptotic expansion b ~k). of ρ(
2.3
A note on our phantom
In the medical imaging literature, the Shepp-Logan phantom (which is piecewise constant) is a traditional choice for analysis and validation purposes. We have added a smoothly varying component (see (2.3)), with ρtex (x) defined as a sum of Gaussians whose bandwidth (to six digits of accuracy) is equal to half the bandwidth of the measurement data.
2.4
Informal Description of the Algorithm
The full algorithm proceeds in three steps. 1. Construct directional filters, based on kmax (the maximum frequency content of the data) and ktex (the frequency content of the “smooth” part of the image). 2. Multiply the data ρb by each directional filter indexed by θ = jπ/A, j = 1, . . . , A) and transform back to the image domain. • Apply a threshold in the image domain.
• Add each point x above the threshold to the surfel set as the pair (x, kθ ). 3. Given the set of all surfels, use the algorithm of [17] to reconstruct the set of curves γj (t) that define the discontinuities. The last step is described briefly in section 6, while the bulk of the paper is devoted to the surfel extraction procedure itself.
3
~ Large k Asymptotics of 1c γj (k)
~ In this section we wish to compute the large k asymptotics of 1c γj (k). In partic~ ular, we will show that 1c γj (k) is dominated solely by the parts of γj (t) where ′ ~ γj (t) · k = 0, i.e. where k ⊥ Tj (t). 6
1.0
Exact Phantom
64x64 phantom, DFT reconstruction 1.0
0.8
0.8
0.6
0.6
0.4
0.4
0.2
0.2
0.00.0
0.2
0.4
0.6
0.8
1.0 0.00.0
0.2
0.4
0.6
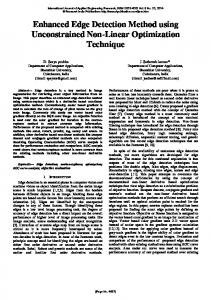
Figure 2: A plot of the phantom used in this work. The image in the second panel is obtained by applying the DFT to the (exactly known) continuous Fourier Transform of the phantom on a 64 × 64 grid of samples in k-space.
7
0.8
1.0
We can use Green’s theorem to rewrite the Fourier transform of 1γj (x) −2 ~ as follows. Let F (~k, x) = (F1 (~k, x), F2 (~k, x)) = −i ~k eik·x~k ⊥ with ~k ⊥ = [−k2 , k1 ]T . Then by Green’s theorem: ~ 1c γj (k) =
Z Z
~
eik·x dx1 dx2 =
Ωj
Ωj
=
Z Z
Z
S1
F (~k, γj (t)) ·
∂x1 F2 (~k, x) − ∂x2 F1 (~k, x)dx1 dx2
dγj (t) 1 dt = ~ dt i|k|2
Z
~
S1
eik·γj (t)~k ⊥ · γj′ (t)dt
(3.1)
(with Ωj the region bounded by γj ). This trick is taken from [22]. ~ We can now use stationary phase to approximate 1c γj (k) for large k. For this, express k in polar coordinates (kr , kθ ), fix a direction kθ , and consider what happens as kr becomes large. As we remarked earlier, the phase ~k · γj (t) becomes stationary only when ~k · γj′ (t) = 0 or ~k · Tj (t) = 0. This is precisely where k points normal to the curve, and it is these locations that dominate ~ 1c γj (k):
Proposition 3.1 Let tj (~k) correspond to the value of t at which Nj (t) k k and Nj (t) · ~k > 0 (i.e. the normal to γj (t) points in the direction k). Then: M−1 X j=0
~ ρj 1c γj (k) =
M−1 X j=0
i~ k·γ(tj (~ k))
e ρj 3/2 ~ k
√
e π q + 3/2 ~ κj (tj (~k)) k
where E(~k) ≤ Cgeo with Cgeo
i~ k·γ(tj (−k))
√
π q κj (tj (−~k))
E(~k) + 2 ~ k
(3.2)
r � � supj γj′′′ (t) L∞ X 8¯ κ 2¯ κ +2 arclength(γj ) . (3.3) + 3ρ = Mρ 4 + πκ κ κ j
Note that Cgeo incorporates both geometric and contrast information about the image itself. This result is proved carefully in Appendix A. The basic idea behind the proof is simple, however. Set k = kr~kθ , with ~kθ fixed. Then: Z Z ′ i~ k·γj (t)~ ⊥ eikr f (t)~k ⊥ · γj′ (t)dt k · γj (t)dt = e S1
S1
with f (t) = ~kθ · γj (t). The phase function f (t) is stationary when ~kθ · γj′ (t) = 0, or equivalently the place where ~kθ · Nj (t) = ±1 (i.e. tj (~k) = tj (~kθ )). By Assumption 4, we find that γj′′ (t) = κj (t)Nj (t) is nonzero. We restrict the
8
consideration to an interval I = [tj (~kθ ) − ǫ, [tj (~kθ ) + ǫ] and apply stationary phase: Z eikr f (t)~k ⊥ · γj′ (t)dt I s π ~ ∼ eikr f (tj (kθ ))~k ⊥ · γj′ (tj (~kθ )) + remainder ′′ ~ kr f (tj (kθ )) s π ~ ~ 1/2 eik·γj (tj (k)) + remainder = kr κj (tj (~kθ )) Proving Proposition 3.1 is done by adding this result up over all the curves, and all points of stationary phase, and estimating the remainder.
3.1
What if κ = 0?
It is important to note that all is not lost when κ = 0. In this case, although ~ the coefficient on k −3/2 in (3.2) becomes singular, the asymptotics of 1c γj (k) do not. In this case, what happens is that the leading order behavior becomes O(kr −1−1/n ), where n is the order of the first non-vanishing derivative. This can be seen relatively easily from stationary phase, although rigorous justification requires a long calculation. However, the limiting case n = ∞ (a straight line) is easy enough to treat. Proposition 3.2 Let γ(t) = ~a + (~b − ~a)t for t ∈ [0, 1]. Then: 1 2 ~ i k
Z
1 0
~
eik·γ(t)~k ⊥ · γ ′ (t)dt
=
k⊥ ·(~b−~ a) −1 ~ 2 ~ ~ ~ |k| k·(b−~a) ~
eik·~a ~ ⊥ 2 k |~k|
i h ~~ ~ eik·b − eik·~a , ~k · (~b − ~a) 6= 0
· (~b − ~a),
=
(
k · (~b − ~a) = 0
k · (~b − ~a) 6= 0 O(kr −2 ), −1 ik·~ a e O(kr ), k · (~b − ~a) = 0
(3.4)
Proof. If ~k · (~b − ~a) 6= 0, then: Z 1 Z 1 ~ eik·((b−~a)t+~a)~k ⊥ · (~b − ~a)dt eik·γ(t)~k ⊥ · γ ′ (t)dt = 0 0 # " Z 1 ik·(~b−~ a) 1 e ~ − = ~k ⊥ ·(~b−~a)eik·~a eik·((b−~a)t) dt = ~k ⊥ ·(~b −~a)eik·~a ik · (~b − ~a) ik · (~b − ~a) 0 i ~k ⊥ · (~b − ~a) h ~ eik·b − eik·~a = ik · (~b − ~a) 9
2 Multiplying by (i ~k )−1 yields the result we seek.
The asymptotics are straightforward to compute (from the second line of (3.4)), but note that the constant in the O(kr −2 ) term in (3.4) is not uniform in k∠(~b − ~a). �
4
Directional Filters
We are now in a position to build the filter operators Dθ,α of (2.8), which will allow us to extract edge information from the signal. We demand that the radial filter takes the form W(kr ) = W p (kr − (kmax + ktex )/2) + W p (kr + (kmax + ktex )/2)
(4.1a)
where Wˇ p (r) is a positive, symmetric function. This means that the 1-dimensional inverse Fourier transform of W(kr ) is � � kmax + ktex ˇ W(r) = cos r Wˇ p (r) (4.1b) 2 The intuition behind this operator is the following. Multiplying by W(kr )V(kθ − θ) localizes on the region k ≈ (kr cos θ, kr sin θ). Dropping all but one of the terms in Proposition 3.1, we find that: ~
ik·γj (tj (k)) ~ W(kr )V(kθ − θ)1c κj (tj (~k))−1/2 A(~k) . γk (k) ≈ e
The term A(~k) incorporates both the 1/|~k|3/2 decay from the asymptotics of ~ 1c γk (k) and the localization to kθ and large kr from the filters. Therefore, if we inverse Fourier transform, we will obtain ~
ˇ − γj (tj (~k))) F −1 [eik·γj (tj (k)) κj (tj (~k))−1/2 A(~k)] ≈ κj (tj (~k))−1/2 A(x
ˇ Provided A(x) is a sharply localized bump function, this will be a bump located at γj (tj (~k)). Of course, this calculation is not exactly correct, and is presented merely to obtain intuition. We will go through the details shortly, but require a few definitions. Definition 4.1 Given W(kr ), define the auxiliary functions: Z ˇ W(r) = e−irkr W(kr )dkr ˇ W(R) = sup W(r)
(4.2a) (4.2b)
r>R
Definition 4.2 Define the set Aθ,α ⊂ R2 to be the set of points where some γj (t) has normal pointing in the direction [θ − α, θ + α], i.e.: Aθ,α =
M−1 [ j=0
�
{γj (t)}t∈[tj (θ−α),tj (θ+α)] ∪ {γj (t)}t∈[tj (θ−α+π),tj (θ+α+π)] 10
�
(4.3a)
We also define Aθ,α j to be the set of arcs excluding γj (tj (θ)). [� � Aθ,α j = {γi (t)}t∈[ti (θ−α),ti (θ+α)] ∪ {γi (t)}t∈[ti (θ−α+π),ti (θ+α+π)]
(4.3b)
i6=j
The goal of our directional filters is to approximate the location of Aθ,α . That is to say we want Dθ,α ρ to be large near Aθ,α and small away from it. The decay in the tangential direction away from a point in Aθ,α is at least of the order O(r−1 ). To ensure that the decay in the normal direction is as fast, we ˇ consider the case when W(r) = O(r−1 ) (see Fig. 3 d). We then have the following result which proves the directional filters approximate the location of Aθ,α . Theorem 4.3 Suppose that α satisfies α2 (kmax + ktex ) ≤π κ
(4.4a)
and W(kr ) satisfies (4.1a) as well as the following decay condition: W(r) ≤
CW r
(4.4b)
Then away from Aθ,α , the directional filter has the following decay: M−1 X C(W, V, α) ≤ Dθ,α c (x) ρ 1 j γj d(x, Aθ,α ) j=0
+ kr −1/2 W(kr )
L1 (R,dkr )
kV(kθ )kL1 (S1 ,dkθ ) Cgeo
(4.4c)
where
( √ 2M ρ 2π C(W, V, α) = √ max CW kV(kθ )kL1 (S1 ,dkθ ) , κ cos(2α) "
′′′ #
γ (t) ∞ j ′ L 2 kW(kr )/kr kL1 (R,dkr ) kV (kθ )kL1 + kV(kθ )kL1 2κ2 !)
√ ˇ (4.4d) + 1) L∞ + κ W(z)(z
At the point x = γj (tj (θ))
M−1 X
[θ · Nj (t)]Dθ,α
j=0
ρj 1c γj (x) ≥ T(W, V, α) 11
(4.4e)
with
r
π ρ W p (r) inf 2¯ κ r∈[−α2 /2κ,α2 /2κ] � �
C(W, V, α)(2M − 1)
Cgeo + kr −1/2 W(kr ) − 2M δ L1 (R,dkr )
T(W, V, α) ≡
(4.4f)
We postpone the proof of this result to Appendix B, where we compute the leading order asymptotics of a single segment of the curve and put the various pieces together. Remark 4.4 While the expressions above are somewhat involved, for the filters described in the next section, (4.4c) simplifies to ! M−1 X C(W, V, α) 1 Dθ,α ≤ ρj 1c . (4.5) + O γj (x) d(x, Aθ,α ) kmax 1/2 + ktex 1/2 j=0
Note that the second term in this estimate becomes negligible as kmax increases. The term C(W, V, α) determines the rate of decay of the directional filter away from a surfel and it should be as small as possible (to minimize noise), for which the norm of W should be small. At the same time, we want T(W, V, α) to be as large as possible (to maximize signal). For this, the norm of W should be large. We will need to balance this competition.
Remark 4.5 If the decay of W(r) is faster than (4.4b), we can of course get sharper results. However, this would require extra geometric conditions and would require Theorem 4.3 to make distinctions concerning the direction from x to Aθ,α . To simplify the exposition of this paper, such considerations will be reported at a later date.
4.1
The estimate is suboptimal
Let us consider the application of our directional filters on a simple numerical example. We consider a 64 × 64 pixel image on [0, 1]2 . The image is taken to be the phantom described in Section 2.3, and the parameters are
kmax = 64π ≈ 201.1, ktex = 32π ≈ 100.5, α = π/16, κ = 0.1 and γj′′′ (t) L∞ ≤ 5. With this set of parameters, C(W, V, α) = 0.3 if we use the windows V(kθ ) = (2α)−1 1[θ−α,θ+α](kθ ) and W(kr ) = (kmax −ktex )−1 1[ktex ,kmax ] (kr ). The first term on the right-hand side in (4.4c) is, therefore, approximately 0.3/(1/64) ≈ 25 if we move one pixel away from a surfel. The second term, however, is approximately 85 so that we have no reason to expect that the directional filters will yield any useful information. However, numerical experiments show that they do in fact work even in this case. Figure 3 shows that the directional filters do yield the location of the edges. Figure 4 shows that even in the presence of noise (up to 7.5% of the total image energy), the directional filters still yield correct results. It is also useful to compare the directional filters to a naive algorithm, namely computing the directional derivative. As is apparent from Figure 5, this naive method does not perform as well as our algorithm. 12
1.0
Inverse DFT of Image
Directional Filter (k-domain)
200
0.8
100
0.6
0
0.4 0.2 0.00.0 0.2 0.4 0.6 0.8 1.0 Edge map 1.0
�10
�20
0 100 200 Directional Filter (x-domain) �20
�10
1.0
0.8
0.8
0.6
0.6
0.4
0.4
0.2
0.2
0.00.0 0.2 0.4 0.6 0.8 1.0
0.00.0 0.2 0.4 0.6 0.8 1.0
Figure 3: An illustration of the sharp directional filter. The first panel shows the image. The second panel shows the directional filter in k-space. The third b with θ = π/4 and α = π/16. The red panel shows the edge map [Dθ,α ρ](x) b = 2.4 contour lines, while the green lines are the actual lines are the |[Dθ,α ρ](x)| (analytically known) edges of the image. The fourth panel shows the directional filter in the x-domain.
13
Edgemap, noise = 2.5%
Thresholds, noise = 2.5%
1.0
1.0
0.8
0.8
0.6
0.6
0.4
0.4
0.2
0.2
0.00.0 0.2 0.4 0.6 0.8 1.0 Edgemap, noise = 5.0% 1.0
0.00.0 0.2 0.4 0.6 0.8 1.0 Thresholds, noise = 5.0% 1.0
0.8
0.8
0.6
0.6
0.4
0.4
0.2
0.2
0.00.0 0.2 0.4 0.6 0.8 1.0
0.00.0 0.2 0.4 0.6 0.8 1.0
Edgemap, noise = 7.5%
Thresholds, noise = 7.5%
1.0
1.0
0.8
0.8
0.6
0.6
0.4
0.4
0.2
0.2
0.00.0 0.2 0.4 0.6 0.8 1.0 Edgemap, noise = 10.0% 1.0
0.00.0 0.2 0.4 0.6 0.8 1.0 Thresholds, noise = 10.0% 1.0
0.8
0.8
0.6
0.6
0.4
0.4
0.2
0.2
0.00.0 0.2 0.4 0.6 0.8 1.0
0.00.0 0.2 0.4 0.6 0.8 1.0
Figure 4: An illustration of the directional filters in the presence of noise. The image and parameters are the same as in Figure 3. The figures in the left column b The gray dotted lines in the right column illustrate the are plots of [Dθ,α ρ](x). discontinuities of the image (which we know exactly, c.f. Section 2.3), while b = 2.4. Noise amplitude is the red regions are the places where |[Dθ,α ρ](x)| described as a percentage of the total image strength. Noise begins to corrupt the data when it reaches 7.5%, and becomes a serious problem at 10%. 14
1.0
Directional Derivative
Directional Derivative, Thresholded 1.0
0.8
0.8
0.6
0.6
0.4
0.4
0.2
0.2
0.0 0.0 1.0
0.2
0.4
0.6
0.8
1.0
Exact Contours
0.0 0.0
0.8
0.6
0.6
0.4
0.4
0.2
0.2
0.2
0.4
0.6
0.8
0.4
0.6
0.8
1.0
0.2
0.4
0.6
0.8
1.0
1.0
0.8
0.0 0.0
0.2
Threshold Regions
1.0
0.0 0.0
Figure 5: Result of edge detection based on measuring the directional derivative, i.e. ∂π/4 ρ(x). The green lines represent the analytically known edges of the image, while the red regions are the regions where ∂π/4 ρ(x) ≥ 150.
15
1.0
0.8
0.6
0.4
0.2
0.0 0.0
0.2
0.4
0.6
0.8
1.0
Exact Contours, Extracted Surfels 1.0
0.8
0.6
0.4
0.2
0.0 0.0
0.2
0.4
0.6
0.8
1.0
Figure 6: Result of edge detection applied to an image where Assumption 4 is violated. The green lines in the second panel indicate the actual discontinuities, while the red arrows indicate extracted surfels (at angles θ = 0 and θ = π/4. The vertical and horizontal Gray bars are artifacts from using the DFT to reconstruct a discontinuous image. 16
4.2
Parabolic Scaling
The choice of α is an important one. We want α to be as small as possible, since this will give us better angular resolution. On the other hand, the constant bounding the size of the filtered image away from the edges is directly proportional to α−1 , as we will show shortly. For simplicity, let us impose the constraint that kV(kθ )kL1 (kθ ,dkθ ) = 1.
(4.6)
Now let us take V(kθ ) to be a fixed filter scaled with α, i.e. V(kθ ) = α−1 V (kθ /α), where V (kθ ) is supported in [−1, 1] and kV (kθ )kL1 (dkθ ) = 1. With this choice of V(kθ ), we find that:
kV ′ (kθ )kL1 (S1 ,dkθ ) = α−1 V ′ (kθ /α) L1 (S1 ,dk ) = α−1 kV ′ (kθ /α)kL1 (S1 ,dkθ ) θ (4.7) Substituting this into (4.4d) and assuming α to be very small yields: √ 2π C(W, V, α) = √ 2 kW(kr )/kr kL1 (R,dkr ) κ cos(2α) " −1
× α
′
kV (kθ /α)kL1 (S1 ,dkθ ) + kV(kθ )kL1
√ ˇ + κ W(z)(z + 1) L∞
!
′′′ #
γ (t) j L∞ 2κ2
� � (4.8) = O κ−1/2 α−1 kW(kr )/kr kL1 (R,dkr )
To prevent C(W, V, α) from being too large, we want to ensure that α is as large as possible. However, to ensure that the filter is sufficiently large on the edges, we need to prevent α from being too large (Theorem 4.3). In particular, we require (c.f. (4.4a)) r πκ α≤ (4.9) kmax + ktex To satisfy both these constraints, we simply replace the “≤” in (4.9) by “=”. This yields the standard parabolic scaling used elsewhere [5, 6, 11, 21, 23]. Remark 4.6 The requirement (4.4a) yields the standard parabolic scaling used to analyze line discontinuities in harmonic analysis [5, 6, 11, 21, 23]. In the x2 domain, the standard parabolic scaling uses √ elements with width ∼ length . In the k-domain, this translates to width ∼ length. This also implies that for the filter to approach zero as ktex , kmax → ∞, we require that kW(kr )/kr kL1 (R,dkr ) = o(ktex −1/2 ).
17
4.3
Choosing the Filters
We now consider the simplest choices of window possible which satisfy our assumptions. We take W(kr ) to be a a step function, i.e.: � 1 W(kr ) = 1[ktex ,kmax ] (kr ) + 1[−kmax ,−ktex ] (kr ) 2(kmax − ktex ) and we take V(kθ ) to be a triangle function:
1 max{α − |kθ | , 0} α2 In this case, it is straightforward to show:
1
−1/2 W(kr ) =
kr 1/2 L1 (R,dkr ) + ktex 1/2 kmax
−1 ln(kmax /ktex )
kr W(kr ) 1 = L (R,dkr ) kmax − ktex
1
W(r)(r ˇ + 1) L∞ (R,dr) ≤ kmax − ktex 1 CW = kmax − ktex kV(kθ )kL1 (S1 ,dkθ ) = 1 r kmax + ktex ′ −1 kV (kθ )kL1 (S1 ,dkθ ) = 2α = 2 π Then we have: ( √ 2π C(W, V, α) = √ max 1, κ cos(2α)(kmax − ktex ) s !)
′′′
γ (t) ∞ √ kmax + ktex j L + + κ 2 ln(kmax /ktex ) 2 πκ 2κ2 V(kθ ) =
Similarly, the remainder term has the bound: E(~k) 1 kV(kθ )kL1 (S1 ,dkθ ) Dθ,α 2 ≤ 1/2 |k| kmax + ktex 1/2
(4.10)
× Cgeo ,
where Cgeo is defined in (3.3). Therefore, we find that: M−1 X Dθ,α c (x) 1 γj j=0 √ � � � � 1 ln(kmax /ktex ) kmax + ktex 1 + (4.11) =O d(x, Aθ,α ) kmax − ktex kmax 1/2 + ktex 1/2 18
Thus, away from Aθ,α , the directional filter approaches zero. The O(ln(kmax /ktex )/(kmax − ktex )) factor is present because we are attempting to extract spatial information from a frequency band of width kmax − ktex . The 1/(kmax 1/2 + ktex 1/2 ) term is present because the asymptotic expansion we used to derive the directional filters decays only kr −1/2 faster than the leading order terms.
5
Surfel Extraction
Theorem 4.3 proves that, provided we choose the parameters correctly, directional filters will decay away from Aθ,α . Extracting surfels from the filters is therefore simply a matter of choosing the parameters correctly and seeking local maxima. We know that at the point γj (tj (θ)), (4.4e) provides a lower bound on the size of the directionally filtered image. We also know that away from Aθ,α , (4.4c) provides an upper bound on the size of the filtered image. We wish to say that if the filtered image is “large”, then we are near Aθ,α , otherwise we are not. Therefore, we will need the lower bound at γj (tj (θ)) to be greater than the upper bound away from Aθ,α : r
π inf ρ kV(kθ )kL1 (dkθ ) W p (r) r∈[−α2 /2κ,α2 /2κ] 2¯ κ # "
C(W, V, α)(2M − 1)
−1/2
+ kr W(kr ) 1 kV(kθ )kL1 (S1 ,dkθ ) Cgeo − L (R,dkr ) 2M d(x, Aθ,α j ) C(W, V, α) d(x, Aθ,α )
−1/2 W(kr ) + kr 1 ≥
L (R,dkr )
kV(kθ )kL1 (S1 ,dkθ ) Cgeo
(5.1)
Let us also use the convention that
kV(kθ )kL1 (dkθ ) = 1 .
(5.2)
Using the fact that d(x, Aθ,α j ) ≥ d(x, Aθ,α ), we find that (5.1) implies: r
π inf W p (r)/Cgeo 2¯ κ r∈[−α2 /2κ,α2 /2κ]
(4M − 1)C(W, V, α)
+ 2 kr −1/2 W(kr ) 1 (5.3) ≥ 2M d(x, Aθ,α ) L (R,dkr )
is sufficiently small, then (5.1) will be true Thus, if kr −1/2 W(kr ) ρ
L1 (R,dkr )
whenever d(x, Aθ,α ) is sufficiently large. In particular, if we make each term on the right side of (5.3) smaller than half the left side, this equation will be satisfied. 19
We summarize this result in the following corollary to Theorem 4.3, which shows that the directional filter is large only when d(x, Aθ,α ) is sufficiently small. Corollary 5.1 Suppose that:
−1/2
W(kr )
kr
L1 (R,dkr )
≤
1 ρ 4
r
π inf W p (r)/Cgeo . (5.4) 2¯ κ r∈[−α2 /2κ,α2 /2κ]
Define the surfel location error to be: D(W, V, α) r � �−1 (4M − 1)C(W, V, α) κ 2 2¯ p inf Cgeo . (5.5a) W (r) ≡ 2 2 ρ π r∈[−α /2κ,α /2κ] 2M Then whenever d(x, Aθ,α ) ≥ D(W, V, α), we have that
M−1 X Dθ,α ρj 1c γj (x) (x) ≤ T(W, V, α). j=0
(5.6)
(5.7)
Thus, when x is located a distance at least D(W, V, α) from Aθ,α , the filtered image is smaller than T(W, V, α). On the other hand, at the point γj (tj (α)), we know that the filtered image is larger than T(W, V, α). Thus, we obtain the following thresholding algorithm for locating surfels in the wavefront: Algorithm 1: Surfel Extraction
1 2 3
4 5 6 7 8 9 10 11 12
b ~k) and a desired minimal Input: The image in the Fourier domain, i.e. ρ( sampling rate ǫ. Output: Surfels which approximate the wavefront of ρ(x) in the direction θ. b let f1 (x) �:= [Dθ,α ρ](x). let Z := x ∈ [−1, 1]2 : |f (x)| ≥ T(W, V, α) . Cluster the set Z. Any two points are part of the same cluster if they are located a distance D(W, V, α) apart. Let S denote the set of clusters. let RESULT := [] (the empty set) foreach s ∈ S do Let the midline of s be the set {midpoint((x + θR) ∩ s) : x ∈ s}. Sample the midline of s with spacing at least ǫ, calling the result Q. foreach q ∈ Q do Add the surfel (q, θ) to RESULT. end end return RESULT
20
1.0
0.8
0.6
0.4
0.2
0.0 0.0
0.2
0.4
0.6
0.8
1.0
Figure 7: An illustration of the result of Algorithm 1. The red arrows indicate the location and direction of extracted surfels in the direction π/4 (with α = π/16). The surfels are overlayed on the image (reconstructed by DFT). An example of Algorithm 1 applied to the same image as in Section 4.1 is shown in Figure 7. The algorithm generates no surfel a distance more than 1.0/64 (i.e., one pixel) away from the actual edge. We have the following result concerning correctness of Algorithm 1. Theorem 5.2 Suppose that in addition to (4.1a), (4.4a), (4.4b), (5.2), (5.4), the following constraint is satisfied: D(W, V, α) ≤
δ 3
(5.8)
Then for every (x, θ) in the result of Algorithm 1, there is a corresponding surfel (x′ , θ′ ) in the wavefront of ρ(x) with the property that: |x − x′ | ≤ D(W, V, α)
(5.9a)
|θ − θ′ | ≤ α
(5.9b)
Additionally, for each j, at least one surfel output by Algorithm 1 will approximate some surfel (γj (tj (λ)), Nj (tj (λ))) in the arc segment arc segment {γj (tj (λ)) : λ ∈ [θ − α, θ + α]}. 21
Proof. Define the arc segment: Aj = {γj (tj (λ)) : λ ∈ [θ − α, θ + α]} By Corollary 5.1, any point x ∈ Z is located a distance at most D(W, V, α) away from Aθ,α . Now, consider any segment s of Z. For any x ∈ s, there is some point x′ in some arc segment Aj for which d(x, x′ ) ≤ D(W, V, α). We need to show that all points y ∈ s are located at most a distance D(W, V, α) from the same arc Aj . Consider a point y with d(y, Ak ) ≤ D(W, V, α). Suppose also that y ′ ∈ Ak is a point for which d(y, y ′ ) ≤ Surf elResolution. Then: δ ≤ d(x′ , y ′ ) ≤ d(x′ , x)+d(x, y)+d(y, y ′ ) ≤ D(W, V, α)+d(x, y)+D(W, V, α) Subtracting 2D(W, V, α) from both sides and applying (5.8) implies that d(x, y) ≥ δ/3 ≥ D(W, V, α) and therefore x and y are not in the same segment. Thus, s consists only of points a distance D(W, V, α) from Aj . Therefore, any point on the midline of S is located a distance at most D(W, V, α) from Aθ,α . By definition, any point on Aθ,α has a normal pointing in some direction in [θ −α, θ +α]. This proves the Surfels returned by Algorithm 1 accurately approximate surfels in the wavefront of ρ(x). To prove that each arc segment has at least one surfel in it, note that by Theorem 4.3, the point γj (tj (θ)) is contained in Z (c.f. (4.4e)). This implies that each arc segment {γj (tj (λ)) : λ ∈ [θ − α, θ + α]} generates at least one segment s of Z. There will be at least one sample taken from this segment, which will generate a surfel in the output of Algorithm 1. Thus, Theorem 5.2 is proved. �
6
Segmentation: connecting the surfels is better than connecting the dots
As we have indicated earlier, one of the reasons for developing a surfel/wavefront extraction procedure is segmentation - by which we mean the reconstruction of the curves of discontinuity γj which divide the image into well-defined geometric sub-regions. The first step in reconstructing the curves is to reconstruct their topology. Definition 6.1 A polygonalization of a figure {γj (t), j = 0, . . . , M − 1} is a planar graph Γ = (V, E) with the property that each vertex p ∈ V is a point on some γj (t), and each edge connects points which are adjacent samples of some curve γj (t) (see Fig. 8). There is a substantial literature in computational geometry discussing the task of taking as input a set of unordered points that lie on a set of curves and returning a polygonalization [2, 7, 8, 9]. In [17], we described an algorithm for 22
Curves and polygonalizations
�polygnaizt
Figure 8: A curve and it’s polygonalization. polygonalization that uses both point and tangent data (i.e. surfels) and showed that the method is significantly more robust. It is easier to remove spurious data from the set of surfels and the sampling requirements are much weaker (see Fig. 9) . In particular, Theorem 2.8 of [17] shows that, given a set of points and tangents (a discrete sampling of the wavefront of ρ(x)), then there is an algorithm √ −1 that returns the correct polygonalization provided δ > 2¯ κǫ2 and ǫ < ( 2¯ κ) , where ǫ is the maximal distance between samples on the curve. If the point and tangent data are corrupted by noise (as they are in practice), then we need to assume a maximal sampling rate as well. Otherwise noise could change the order of samples on the curve. The following theorem provides technical conditions under which one can prove that the algorithm is correct when applied to noisy data. Theorem 6.2 [17, Theorem 3.2] Suppose that Assumptions 1 and 2 hold, that noise in the point data is bounded by ζ, and that noise in the tangent data is bounded by ξ. Suppose further that: δ > 4ζ + 4ǫξ + 2.1¯ κǫ2 ,
(6.1a)
1 (6.1b) ǫ< √ , κ ¯ 2 and that adjacent points on a curve are separated by a distance greater than [(1 + 23/2 )(2ξǫ + ζ)]. Then there is an algorithm that correctly reconstructs the figure. 23
δ
C ε
Figure 9: The advantages of connecting surfels over connecting points are illustrated in this figure. First, the separation between points (ǫ) can be much greater than the separation between curves (δ). Without information about the tangent, ǫ and δ must be of the same order. Using the algorithm of [17], it is easy to automatically assign points to the correct curve. Note also that points such as C are easy to filter away when tangent information is available, even in the presence of modest amounts of noise. Once the polygonalization of the curve set has been obtained, one can approximate the geometry with higher order accuracy. This is particularly easy in the case of surfel data; between each pair of points, cubic Hermite interpolation constructs a fourth order polynomial in arclength that interpolates the two points and matches the derivative (tangent) data as well. This achieves fourth order accuracy. The full segmentation algorithm follows. Algorithm 2: Segmentation b Input: The Fourier transform of the image, ρ(k). Output: A set of curves approximating the discontinuities of ρ(x). 1 let S = [] 2 for j = 1 . . . A do 3 let θ = jπ/A 4 let s = result of applying Algorithm 1 (the Surfel Extraction b algorithm, see p. 20) to ρ(k) in the direction θ. 5 Append s to S. 6 end /* Now S contains surfels pointing in the direction θ for many values of θ. */ 7 Call the algorithm of [17] to polygonalize S. 8 return C, where C is the Hermite interpolant of the polygonalization of S. This algorithm can be proven “correct” in the sense that, for sufficiently large kmax , the algorithm will return a set of curves which are topologically correct. To do this, we need need to prove that the output of Algorithm 1 meets the requirements of Theorem 6.2. This requires verifying that (6.1) are satisfied. Note that we take Assumptions 1, 2, 3 and 4 as given. After extracting surfels from the image (as per the loop in lines 2-6 of Algorithm 2), we find that the error in each surfel’s position is bounded by Theorem 24
5.2: ζ≤ ξ≤
! p kmax 2 − ktex 2 D(W, V, α) = O (kmax − ktex )3/2 � � 1 α =O √ kmax + ktex
(6.2) (6.3)
Both these quantities are O(kmax −1/2 ), holding all other factors fixed, and can therefore be made as small as desired. Note that the angle between adjacent surfels returned by separate applications of Algorithm 1 is at most 2α + π/A. By Lemma A.2, the separation between two such surfels in arc length is at most (2α + π/A)/κ. By taking √ A = O( kmax ) (e.g. A = π/α), we find that ǫ = O(kmax −1/2 ) and thus (6.1b) is satisfied for sufficiently large kmax . To satisfy (6.1a), observe that: 4ζ + 4ǫξ + 2.1¯ κǫ2 ≤ O(kmax −1/2 + kmax −1 + kmax −1 ) = O(kmax −1/2 ) ≤ δ (6.4) For sufficiently large kmax , this implies (6.1a) is satisfied. Thus, we have shown that (6.1b) is satisfied. This implies that for sufficiently large kmax (holding all other parameters fixed), if Assumptions 1 and 2, 3 and 4 are satisfied, then Algorithm 2 will successfully segment the image. We summarize this in a Theorem.
25
1.0
Segmented Image
1.0
0.8
0.8
0.6
0.6
0.4
0.4
0.2
0.2
0.00.0
0.2
0.4
0.6
0.8
1.0 0.00.0
Exact Contours
0.2
0.4
0.6
Figure 10: The result of applying the segmentation algorithm to a 64 × 64 grid of spectral data. Note that the separation of two curves near the center is smaller than a pixel, but that wavefront/surfel reconstruction has no difficulty in resolving the them. Theorem 6.3 Suppose that Assumption 1, 2, 3 and 4 hold. Then for sufficiently large ktex , kmax , Algorithm 2 will successfully approximate the singular support of ρ(x). The result of applying Algorithm 2 to spectral data for our phantom on a 64 × 64 grid is shown in Fig. 10. The deviation from the exact result is noticeable, but is on the order of a pixel since we are using low resolution data to make the nature of the error clear.
26
0.8
1.0
7
Conclusions
In this paper, we have described a new method for edge detection that can be viewed as an extension of the method of concentration kernels [10, 12, 14, 15, 16]. We use more complex filters in order to recover information about the wavefront of a two-dimensional image rather than just its singular set. That is, instead of trying to locate a set of points that lie on curves of discontinuity, we look for both those point locations and the normal (or tangent) directions there. This allows us to reconstruct edges more faithfully and robustly, using the algorithm developed previously in [17]. We have focused here on a rigorous mathematical foundation for the method, based on detailed asymptotics and Fourier analysis. Although in this work we require that the curvature of the discontinuities not vanish, this assumption is merely technical. The algorithm works properly even when that assumption is violated, and even for singularities which are not differentiable (see Figure 6 for an example). A major advantage of extracting surfel information is that one can more easily “denoise” the data, as discussed in detail in [17] and illustrated in Fig. 9. A number of improvements can still be made, including the incorporation of nonlinear “limiters” to reduce the oscillations produced in the physical domain from our linear filtering procedure (see, for example, [16]). Recovering local information about a function from partial Fourier data is a rather subtle issue, as demonstrated by Pinsky [20] who showed that spherical partial Fourier integrals do not converge pointwise to the characteristic function of the unit ball in R3 . His analysis suggests that radial variations of the concentration method may not converge either (though of course appropriately filtered versions will). A limitation of the method described here is that we have assumed the image consists of a globally smooth function superimposed on a set of piecewise constant functions. Extensions of our method to more general piecewise smooth functions will be reported at a later date, as will its application to magnetic resonance imaging.
A
Proof of Proposition 3.1
To prove Proposition 3.1, we will require some results concerning the asymptotics of integrals of the form (3.1) near a point of stationary phase. Lemma A.1 Consider a curve γ(t), proceeding at unit speed, for t ∈ [0, L]. ′ ′′ Suppose k · γ ′ (0) = 0, k · γ (t) 6= 0 for t ∈ (0, L], and k · γ (t) does not vanish. Let ~kθ = ~k/ ~k .
27
Then 1 2
i |k|
Z
L
0
eik·γ(t)~k ⊥ · γ ′ (t)dt =
i−1/2 R(~k) ik·γ(0) e γ(1/2, −i |k| β) + 2 3/2 |k| 2(~kθ · γ ′′ (0)/2)1/2 |k| 1
1
=
3/2
|k|
+
eik·γ(0)
R(~k) 2
|k|
i−1/2
2(~kθ · γ ′′ (0)/2)1/2
− |k|−3/2 eik·γ(0)
Γ(1/2)
i−1/2 Γ(1/2, −i |k| β) 2(~kθ · γ ′′ (0)/2)1/2
(A.1a)
The remainder R(~k) is bounded by:
~
′′′ ~k ⊥ · γ ′ (L) k · γ (t)
∞ θ 3 1 L ~ θ L + − R(k) ≤ 1 + (A.1b) ~kθ · γ ′′ (0)L 4 ~kθ · γ ′′ (0) ~kθ · γ ′ (L) ~kθ · γ ′ (L) Here, γ(a, z) and Γ(a, z) are the incomplete Gamma functions [1, Chapt. 6.5, p.p.269] and β = d · γ(L) − d · γ(0).
Proof. This is a standard application of stationary phase [19, Section 3.13]. Recalling that , ~kθ = ~k/ |k|, the unit direction of k, let us define the variable v = ~kθ ·γ(t)− ~kθ ·γ(0) and β = ~kθ ·γ(L)− ~kθ ·γ(0), so that dv = ~kθ ·γ ′ (t)dt. Since v = ~kθ · γ(t) − ~kθ · γ(0) = ~kθ · γ ′′ (0)t2 /2 + O(t3 ), a straightforward calculation shows that ~k ⊥ · γ ′ (t(v)) v 1/2−1 θ as v → 0. ∼ ~kθ · γ ′ (t(v)) 2(~kθ · γ ′′ (0)/2)1/2
Thus,
e−ik·γ(0)
Z
L
0
eik·γ(t)~k ⊥ · γ ′ (t)dt = |k| = |k|
+ |k|
Z
β
i|k|v
0
0
+ |k|
Z
0
β
e
ei|k|v
0
~k ⊥ · γ ′ (t(v)) θ dv ~kθ · γ ′ (t(v))
v −1/2
2(~kθ · γ ′′ (0)/2)1/2
i1/2
1/2
= |k|
ei|k|v
β
dv
~k ⊥ · γ ′ (t(v)) v −1/2 θ − ~kθ · γ ′ (t(v)) 2(~kθ · γ ′′ (0)/2!)1/2
β
e
Z
Z
2(~kθ · γ ′′ (0)/2)1/2 ~k ⊥ · γ ′ (t(v))
i|k|v
θ
~kθ · γ ′ (t(v))
28
!
dv
γ(1/2, −i |k| β) −
v −1/2 2(~kθ · γ ′′ (0)/2!)1/2
!
dv
(A.2)
We must now bound the remainder, the last line of (A.2). This can be done via Theorem 12.3 of [19, p.p. 99], which states that the integral is bounded by the total variation norm of the integrand plus the value at the endpoints, i.e.: |k|
Z
β
e 0
= −ie with
i|k|v
ik·γ(L)
~k ⊥ · γ ′ (t) 1 θ − ~kθ · γ ′ (t) ~kθ · γ ′′ (0)t
!
~k ⊥ · γ ′ (L) 1 θ − ~kθ · γ ′ (L) ~kθ · γ ′′ (0)L
dv
!
+ ie
i~ k·γ(0)
~k ⊥ · γ ′′ (0) θ ~kθ · γ ′′ (0)
!
+E
(A.3)
!
~k ⊥ · γ ′ (t) 1
θ − |E| ≤
~kθ · γ ′′ (0)t
~kθ · γ ′ (t) TV
To compute the total variation norm, first use the expansion: ! q ~k ⊥ · γ ′ (t) 1 − (~kθ · γ ′ (t))2 1 1 θ = − − ~kθ · γ ′′ (0)t ~kθ · γ ′ (t) ~kθ · γ ′′ (0)t d · γ ′ (t) q 1 + ( 1 − (~kθ · γ ′ (t))2 − 1) 1 = − ~kθ · γ ′ (t) ~kθ · γ ′′ (0)t q ~kθ · γ ′′ (0)t − ~kθ · γ ′ (t) 1 − (~kθ · γ ′ (t))2 − 1 + = ~kθ · γ ′ (t)~kθ · γ ′′ (0)t ~kθ · γ ′ (t)
(A.4)
on [0, β]. It is an exercise in elementary calculus to show that kf (z)kT V ([0,1]) = 1 where √ f (z) = ( 1 − z 2 − 1)/z; this, combined with the fact that ~kθ · γ ′ (t) ∈ [0, 1] and ~kθ · γ ′ (t) is monotonically increasing, shows that the last term of (A.4) has total variation less than 1. To bound the first term, we begin by using Taylor’s theorem: Z t ~kθ · γ ′ (t) − ~kθ · γ ′′ (0)t ≡ R2 (t) = (1/2)~kθ · γ ′′′ (z)(z − t)dz 0
Define R(t) = t−1 R2 (t). Then we can write:
~k · γ ′′ (0)t − ~k · γ ′ (t)
d ~k · γ ′′ (0)t − ~k · γ ′ (t)
θ
θ θ θ ≤
~kθ · γ ′ (t)~kθ · γ ′′ (0)t
dt ~kθ · γ ′ (t)~kθ · γ ′′ (0)t 1 TV L Z L Z L~ 1 kθ · γ ′ (t)R′ (t) − R(t)~kθ · γ ′′ (t) 1 d R(t) dt = = dt ′ (~kθ · γ ′ (t))2 ~kθ · γ ′′ (0) 0 dt ~kθ · γ (t) ~kθ · γ ′′ (0) 0
(A.5)
29
Note that: R′ (t) = −
Z
0
t
(1/2)~kθ · γ ′′′ (z)z/t2 dz
(A.6)
Substituting (A.6) into (A.5) yields: Z L Z t ~kθ · γ ′ (t)z/t2 − (z/t − 1)~kθ · γ ′′ (t) 1 − (A.5) = dzdt ~kθ · γ ′′′ (z) (~kθ · γ ′ (t))2 2 ~kθ · γ ′′ (0) 0 0 Z L Z t ~kθ · γ ′ (t)z − (zt − t2 )~kθ · γ ′′ (t) − 1 ′′′ = dzdt ~kθ · γ (z) (~kθ · γ ′ (t))2 t2 2 ~kθ · γ ′′ (0) 0 0 Z LZ L ~kθ · γ ′ (t)z − (zt − t2 )~kθ · γ ′′ (t) 1 − = dtdz ~kθ · γ ′′′ (z) (~kθ · γ ′ (t))2 t2 2 ~kθ · γ ′′ (0) 0 z
~
kθ · γ ′′′ (t) ∞ Z L Z L ~kθ · γ ′′ (t) ~kθ · γ ′′ (t) z −z L ≤ + − dtdz (~kθ · γ ′ (t))2 t (~kθ · γ ′ (t))2 2 ~kθ · γ ′′ (0) 0 z ~kθ · γ ′ (t)t2
!
~
kθ · γ ′′′ (t) ∞ Z L Z L d ~kθ · γ ′′ (t) z L ≤ + dtdz (~kθ · γ ′ (t))2 2 ~kθ · γ ′′ (0) 0 z dt ~kθ · γ ′ (t)t
~
kθ · γ ′′′ (t) ∞ Z L z 1 1 −z L + + − ≤ ~ 0 ~k · γ ′ (L)L ~k · γ ′ (z)z ~k · γ ′ (L) ~k · γ ′ (z) dz ′′ θ θ θ θ 2 kθ · γ (0)
~
kθ · γ ′′′ (t) ∞ Z L 1 z L + dz = ~ ′ ~ ~ 2 kθ · γ ′′ (0) 0 kθ · γ (L)L kθ · γ ′ (L)
!
~
kθ · γ ′′′ (t) ∞ L L L ≤ + 2~kθ · γ ′ (L) ~kθ · γ ′ (L) 2 ~kθ · γ ′′ (0)
~
′′′ k · γ (t)
∞ θ 3 L L ≤ (A.7) 4 ~kθ · γ ′′ (0) ~kθ · γ ′ (L)
Thus,
we have the bound that:
!
~
′′′
k · γ (t)
∞ θ ~k ⊥ · γ ′ (t) 3 1 L
L θ ≤1+ −
~kθ · γ ′ (t) ~kθ · γ ′′ (0)t 4 ~k · γ ′′ (0) ~kθ · γ ′ (L) θ TV
This implies that: (A.3) = −ie
ik·γ(L)
~k ⊥ · γ ′ (L) 1 θ − ~kθ · γ ′ (L) ~kθ · γ ′′ (0)L
30
!
+ ie
ik·γ(0)
~k ⊥ · γ ′′ (0) θ ~kθ · γ ′′ (0)
(A.8)
!
+E (A.9)
with
~
′′′ k · γ (t)
∞ 3 θ L L |E| ≤ 1 + 4 ~k · γ ′′ (0) ~kθ · γ ′ (L) θ
Since d is the normal vector to γ(t) at t = 0, and ~kθ⊥ is tangent to it, we find that ~kθ⊥ · γ ′′ (0) = 0 (using the fact that γ ′′ (0) = κ(0)N (0)). Thus, we find that: Z
L
0
+ ie
ik·γ(0)
i1/2
1/2
eik·γ(t)~k ⊥ · γ ′ (t)dt = |k| ~k ⊥ · γ ′′ (0) θ ~kθ · γ ′′ (0)
!
2(~kθ · γ ′′ (0)/2)1/2
+ E ′ = |k|1/2
γ(1/2, −i |k| β)
i1/2
2(~kθ · γ ′′ (0)/2)1/2
γ(1/2, −i |k| β) + E ′ (A.10)
with
~
′′′ ~k ⊥ · γ ′ (L) k · γ (t)
∞ θ 3 1 L ′ L θ |E | ≤ 1 + + − ~kθ · γ ′′ (0)L 4 ~k · γ ′′ (0) ~kθ · γ ′ (L) ~kθ · γ ′ (L) θ 2
Multiplying (A.10) by 1/(i |k| ) yields the result we seek.
(A.11)
�
We also need the following geometric result: Lemma A.2 Consider two normal vectors k1 and k2 on a curve γj (t) with an angle θ between them. Then: θ/κ ≥ |tj (k1 ) − tj (k2 )| ≥ |θ| /¯ κ
(A.12)
Proof. The angle changes most quickly if γj (t) is a circle with minimal radius of curvature. The arc length along such a curve is |θ| R ≥ |θ| /¯ κ. The arc length changes most quickly (w.r.t angle) along a circle with maximal radius of curvature, i.e. a circle of radius 1/κ. � The proof of Proposition 3.1 basically requires us to applying Lemma A.1 to (3.1). Proof of Proposition 3.1. Note that k · γj′ (tj (~k)) = 0. Thus, we may apply Lemma A.1 to the curve γ(t) = γj (tj (~k) + t) along the segment t ∈ [0, tk (k ⊥ ) − tj (~k)] and similarly to γ(t) = γj (tj (~k) − t). This will give us an expansion over the sections of the curve where k · Nj (t) ≥ 0. Repeating the analysis centered at tj (−k) yields an expansion over sections of the curve where k · Nj (t) ≤ 0.
31
Applying Lemma A.1 directly yields the following: Z 1 1 i−1/2 eik·γ(t)~k ⊥ ·γ ′ (t)dt = 3/2 eik·γ(0) Γ(1/2) 2 i |k| k·Nj (t)>0 2(~kθ · γ ′′ (tj (~k))/2)1/2 |k| −1/2 R1 (~k) Γ(1/2, −i |k| β1 ) −3/2 ik·γ(0) i + e 2 − |k| |k| 2(~kθ · γ ′′ (tj (~k))/2)1/2 i−1/2 ik·γ(0) e Γ(1/2) 3/2 2(~kθ · −γ ′′ (tj (~k))/2)1/2 |k| −1/2 R2 (~k) Γ(1/2, −i |k| β2 ) −3/2 ik·γ(0) i + − |k| e 2 ~ |k| 2(kθ · −γ ′′ (tj (~k))/2)1/2 √ π R1 (~k) + R2 (~k) ~ q = eik·γ(tj (k)) + 2 3/2 |k| |k| κj (tj (~k)) +
+ |k|−3/2 eik·γ(0)
1
i−1/2 Γ(1/2, −i |k| β1 ) i−1/2 Γ(1/2, −i |k| β2 ) + |k|−3/2 eik·γ(0) 2(~kθ · γ ′′ (tj (~k))/2)1/2 2(~kθ · γ ′′ (tj (~k))/2)1/2 (A.13)
Here, the remainders R1,2 (~k) are bounded by:
~ ′′′ k · γ (t)
∞ (t (k ⊥ ) − t (~k))
θ j 3 j j L R1 (~k) ≤ 1 + 4 ~k · γ ′′ (t (~k)) ~kθ · γ ′ (tj (k ⊥ )) θ j ~k ⊥ · γ ′ (t (k ⊥ )) 1 θ j + − ~kθ · γ ′′ (tj (~k))(tj (k ⊥ ) − tj (~k)) ~kθ · γ ′ (tj (k ⊥ ))
~
′′′ k · γ (t)
∞ (t (~k) − t (−k ⊥ )) θ j 3 j j L R1 (~k) ≤ 1 + 4 ~kθ · γ ′′ (tj (~k)) ~kθ · γ ′ (tj (−k ⊥ )) ~k ⊥ · γ ′ (t (−k ⊥ )) 1 θ j − + ~kθ · γ ′′ (tj (~k))(tj (~k) − tj (−k ⊥ )) ~kθ · γ ′ (tj (−k ⊥ ))
(A.14a)
(A.14b)
Since k · γj′ (tj (~k)) = 0 and γj (t) proceeds with unit speed, we find that ~kθ · γj′′ (tj (~k)) = κ(tj (~k)). Note also that ~kθ⊥ · γj′′ (tj (±k ⊥ )) = 0 since γj′′ (tj (±k ⊥ )) k ±k ⊥ (and similarly ~kθ · γ ′ (tj (−k ⊥ )) = 1. Substituting this into (A.14), as well as bounding the curvature below by κ and adding them up yields:
′′′ 3 γj (t) L∞ tj (k ⊥ ) − tj (−k ⊥ ) ~ ~ R1 (k) + R2 (k) ≤ 2 + 2 κ 1 1 1 + + (A.15) κj (tj (~k))(tj (k ⊥ ) − tj (~k)) κj (tj (~k))(tj (~k) − tj (−k ⊥ )) 32
Applying Lemma A.2 shows that (tj (k ⊥ ) − tj (~k)) ≥ π/2¯ κ and similarly (tj (~k) − ⊥ tj (−k )) ≥ π/2¯ κ. Substituting this into (A.15) and observing that κj (tj (~k)) > κ yields:
′′′ 4¯ κ 3 γj (t) L∞ ~ ~ (tj (k ⊥ ) − tj (−k ⊥ )) + R1 (k) + R2 (k) ≤ 2 + 2 κ πκ
(A.16)
We must also bound −1/2 Γ(1/2, −i |k| β2 ) −3/2 ik·γ(0) i−1/2 Γ(1/2, −i |k| β1 ) −3/2 ik·γ(0) i e + |k| e |k| 2(~kθ · γ ′′ (tj (~k))/2)1/2 2(~kθ · γ ′′ (tj (~k))/2)1/2
To do this, note that β1 = ~kθ · γj (tj (k ⊥ )) − ~kθ · γj (tj (~k)) ≤ −1/¯ κ (and similarly β2 ≤ −1/¯ κ. Thus, − |k| β1,2 ≥ |kr | κ ¯. This can be seen easily by considering circle tangent to γj (tj (~k)) of radius 1/¯ κ. Using Eq. (6.5.32) from [1, p.p. 263], combined with the estimate on the remainder stated immediately after Eq. −1/2 (6.5.32), we observe that |Γ(1/2, −i |k| βi,j )| ≤ |k/¯ κ| . Thus, we find that: −1/2 Γ(1/2, −i |k| β2 ) −3/2 ik·γ(0) i−1/2 Γ(1/2, −i |k| β1 ) −3/2 ik·γ(0) i + |k| e e |k| 2(~kθ · γ ′′ (tj (~k))/2)1/2 2(~kθ · γ ′′ (tj (~k))/2)1/2 r −3/2 (k¯ 2¯ κ κ)−1/2 −3/2 (k¯ 1 κ)−1/2 ≤ |k| (A.17) + |k| ≤ 2 2(κ/2) 2(κ/2) κ |k|
Repeating this analysis for the part of the curve where k · Nj (t) < 0 yields the following:
√ √ ~ eik·γ(tj (k)) eik·γ(tj (−k)) Ej (~k) π π ~ c q p (A.18) 1γj (k) = + + 2 3/2 3/2 κj (tj (−k)) |k| |k| |k| κj (tj (~k))
where
′′′ r
γ (t) 2¯ κ 8¯ κ j ~ L∞ arclength(γj ) + +2 Ej (k) ≤ 4 + 3 κ πκ κ
(A.19)
Adding this result up over j = 0 . . . M − 1 and bounding ρj by ρ yields the desired result. �
B
Proof of Theorem 4.3: Leading Order Asymptotics
We first show that the directional filters behave properly when applied to the b ~k). leading order asymptotic terms of ρ( 33
For this, we need to prove two facts: a) that directional filters, after being applied to the image, decay away from the points γj (tj (θ)), with θ the direction of the filter and b) that the filters yield spikes at or near the points γj (tj (θ)). The basis for our calculation is the following Lemma, which allows us to write the directional filter applied to the leading order term of (3.2) as an integral over the curve γj (t). We consider only a directional filter oriented in the direction θ = 0. Results for other directions can be obtained by rotation. Lemma B.1 Let V(kθ ) be supported on the interval [−α, α], let W(kr ) ∈ L1 (R, dkr ) and let W(kr )/kr ∈ L1 (R, dkr ). Then: Z
0
√ π q V(kθ )kr 1/2 W(kr )dkθ kr dkr 3/2 |k| −α ~ κj (tj (k)) √ Z αZ ∞ π = eikr Nj (tj (kθ ))·(γj (tj (kθ ))−x) p V(kθ )W(kr )dkr dkθ κj (tj (kθ )) −α 0 √ Z α π ˇ j (tj (kθ )) · [γj (tj (kθ )) − x])dkθ p V(kθ )W(N = κ (t −α j j (kθ )) Z tj (α) q √ ˇ j (t) · [γj (t) − x])dt (B.1) = π V(kθ (t)) κj (t)W(N
∞
Z
α
~
e−ik·x
eik·γj (tj (k))
tj (−α)
Proof. √ π q V(kθ )kr 1/2 W(kr )dkθ kr dkr 3/2 0 −α |k| κj (tj (~k)) √ Z αZ ∞ π = eikr Nj (tj (kθ ))·(γj (tj (kθ ))−x) p V(kθ )W(kr )dkr dkθ (t κ −α 0 j j (kθ ))
Z
∞
Z
~
α
e−ik·x
eik·γj (tj (k))
(B.2)
Note that the inner integral of the last line of (B.2) is merely the inverse Fourier transform of W(kr ) evaluated at the point r = Nj (tj (kθ ))·[γj (tj (kθ ))−x]. Thus, (B.2) =
Z
α −α
√ π ˇ j (tj (kθ )) · [γj (tj (kθ )) − x])dkθ p V(kθ )W(N κj (tj (kθ )) Z tj (α) q √ ˇ j (t) · [γj (t) − x])dt , V(kθ (t)) κj (t)W(N = π tj (−α)
completing the proof.
�
Proposition B.2 Let V(kθ ) be supported on the interval [−α, α], let W(kr ) ∈ L1 (R, dkr ) and also W(kr )/kr ∈ L1 (R, dkr ).
34
Define the smallest normal and tangent distances (DN and DT respectively) as: DN
=
DT
=
inf
Nj (t) · [γj (t) − x]
(B.3a)
inf
γj′ (t) · [γj (t) − x].
(B.3b)
t∈[tj (−α),tj (α)] t∈[tj (−α),tj (α)]
Then we have the following bound on the action of the filter in the normal directions: Z ∞ Z α √ ik·γj (tj (~ k)) π 1/2 −ik·x e q W(k )dk k dk V(k )k e r θ r r θ r 3/2 −α |k| 0 κj (tj (~k)) r π ≤ kV(kθ )kL1 (S1 ,dkθ ) W(DN ) (B.4a) κ We also have a weaker bound in the tangential direction: Z ∞ Z α √ ik·γj (tj (~ k)) π e 1/2 −ik·x q V(kθ )kr W(kr )dkθ kr dkr e 3/2 −α |k| 0 κj (tj (~k))
! √ 2 π kW(kr )/kr kL1 (R,dkr ) kV ′ (kθ )kL1 kV(kθ )kL1 γj′′′ (t) L∞ ≤ + DT κ1/2 2κ5/2
√ ˇ π kV(kθ )kL1 W(z)(z + 1) L∞ + (B.4b) DT2 Finally, DN ≥ cos(α) |Nj (tj (0)) · (γ(tj (0)) − x)| −
� � α2 κ ¯ α kγ ′′′ (t)kL∞ κ + (B.5) + κ2 2 κ3 6
Proof. The result (B.4a) follows from the second to last line of (B.1) and the fact that W(N ˇ j (tj (kθ )) · [γj (tj (kθ )) − x]) ≤ W(DN ). To prove (B.5), we must bound Nj (tj (kθ )) · [γ(tj (kθ )) − x]. Let t0 = tj (0), and consider the Taylor expansion (to second order) of γj (t). � � γj′′ (t0 ) 2 ′ (t − t0 ) + remainder Nj (t) · γj (t0 ) + γj (t0 )(t − t0 ) + 2
By Taylor’s theorem, the remainder is bounded by |k · R(t)| ≤ kγ ′′′ (t)kL∞ The first order term is: |Nj (kθ ) · γ ′ (t0 )| = |cos(kθ + π/2)| ≤ |sin(kθ − 0)| ≤ |kθ | ≤ α 35
α3 6κj (t) .
We use also the fact that |t − t0 | ≤ α/κ. Thus, we obtain: kγ ′′′ (t)kL∞ α2 κ ¯ α2 3 |Nj (t) · (γ(t) − x) − Nj (t) · (γ(t0 ) − x)| ≤ + |t − t0 | + κ 2 κ2 6 � � kγ ′′′ (t)kL∞ α3 κ ¯ 1 2 + 2 + ≤α (B.6) κ 2κ 6 κ3 Note also that Nj (t) · (γ(t0 ) − x) ≥ cos(α)Nj (t0 ) · (γ(t0 ) − x). We therefore find that: |Nj (t) · [γ(t) − x]| ≥
�
2
cos(α) |Nj (t0 ) · (γ(t0 ) − x)| − α
�
κ ¯ 1 + κ 2κ2
�
kγ ′′′ (t)kL∞ α3 + 6 κ3
�
(B.7)
Taking the inf over the angles in [−α, α] yields the result we seek. For (B.4b), note that ∂t Nj (t) · [γj (t) − x] = κj (t)γj′ (t) · [γj (t) − x]. We can then multiply and divide the integrand of (B.1) by this and then integrate by parts to obtain: (B.1) Z √ = π
p V(kθ (t)) κj (t) ˇ j (t) · [γ(t) − x])κj (t)γj′ (t) · [γj (t) − x]dt W(N ′ tj (−α) κj (t)γj (t) · [γj (t) − x] Z tj (α) √ V(kθ (t)) ˇ j (t) · [γ(t) − x])∂t p dt W(N =− π κj (t)γj′ (t) · [γj (t) − x] tj (−α) Z tj (α) ′ ′ √ ˇ j (t) · [γ(t) − x]) × p V (kθ (t))kθ (t) =− π W(N κj (t)γj′ (t) · [γj (t) − x] tj (−α) ! V(kθ (t))κ′j (t) V(kθ (t)) (γ ′′ (t) · [γj (t) − x] + γ ′ (t) · γ ′ (t)) + dt + κj (t)(γj′ (t) · [γj (t) − x])2 2(κj (t))3/2 γj′ (t) · [γj (t) − x] Z tj (α) ′ √ ˇ j (t) · [γ(t) − x]) × p V (kθ (t))κj (t) =− π W(N κj (t)γj′ (t) · [γj (t) − x] tj (−α) ! V(kθ (t))κ′j (t) V(kθ (t)) (κj (t)Nj (t) · [γj (t) − x] + 1) dt + + κj (t)(γj′ (t) · [γj (t) − x])2 2(κj (t))3/2 γj′ (t) · [γj (t) − x] tj (α)
(B.8)
36
We can further simplify this to: √ (B.8) = − π
Z
tj (α)
tj (−α)
ˇ j (t) · [γ(t) − x]) × W(N
p V ′ (kθ (t)) κj (t) γj′ (t) · [γj (t) − x]
! V(kθ (t))κ′j (t) V(kθ (t)) (Nj (t) · [γj (t) − x] + 1) + dt + (γj′ (t) · [γj (t) − x])2 2(κj (t))3/2 γj′ (t) · [γj (t) − x] p Z α √ V ′ (kθ (tj (kθ ))) κj (tj (kθ )) ˇ = π W(Nj (tj (kθ )) · [γ(tj (kθ )) − x]) × γj′ (tj (kθ )) · [γj (tj (kθ )) − x] −α
V(kθ (tj (kθ )))κ′j (tj (kθ )) 2(κj (tj (kθ )))3/2 γj′ (tj (kθ )) · [γj (tj (kθ )) − x] ! dkθ V(kθ (tj (kθ ))) (Nj (tj (kθ )) · [γj (tj (kθ )) − x] + 1) (B.9) + (γj′ (tj (kθ )) · [γj (tj (kθ )) − x])2 κj (tj (kθ )) Rz R Note that Fˇ (z) = fˇ(z ′ )dz ′ = e−ikr z W(kr )(ikr )−1 dkr , and thus Fˇ (z) ≤ kW(kr )/kr kL1 (R1 ) . Noting also that γj′′′ (t) · Nj (t) = κ′j (t) (differentiate the formula γj′′ (t) = κj (t)Nj (t), use the Frenet-Serret formula and dot product with Nj (t)), we find that κ′j (t) ≤ γj′′′ (t) . Combining these facts and using the definition of DT , we obtain: +
|(B.9)| Z α √ ≤ π kW(kr )/kr kL1 (R,dkr )
! V(kθ (tj (kθ ))) γj′′′ (t) L∞ V ′ (kθ (tj (kθ ))) p + 2(κj (tj (kθ )))5/2 DT κj (tj (kθ ))DT −α ! V(k (t (k ))) θ j θ dkθ + Fˇ (Nj (tj (kθ ))·[γ(tj (kθ ))−x])(Nj (tj (kθ ))·[γ(tj (kθ ))−x]+1) DT2
! Z α V(kθ (tj (kθ ))) γj′′′ (t) L∞ √ V ′ (kθ (tj (kθ ))) + ≤ π kW(kr )/kr kL1 (R,dkr ) p 2(κj (tj (kθ )))5/2 DT κj (tj (kθ ))DT −α
≤
V(kθ (tj (kθ ))) dkθ + Fˇ (z)(z + 1) L∞ DT2
√ 2 π kW(kr )/kr kL1 (R,dkr ) DT
kV ′ (kθ )kL1 (S1 ,dkθ )
! kV(kθ )kL1 γj′′′ (t) L∞
+ κ1/2 2κ5/2
√ π kV(kθ )kL1 Fˇ (z)(z + 1) L∞ + DT2
This yields (B.4b), and completes the proof of Proposition B.2.
(B.10) �
Lemma B.3 Let γ(t) be a curve moving at unit speed and having non-vanishing curvature, with unit tangent T (t) and normal N (t). Then: |N (t) · (γ(t) − γ(t0 ))| ≤ 37
θ2 (t) 2κ
(B.11)
Here, θ(t) = T (t)∠T (t0 ). Proof. Letting θ(t) be the angle of the tangent, we find that θ′ (t) = κ(t). Note that non-vanishing curvature implies that t(θ) and θ(t) are both functions (at least for small t and θ). Note first that: d dt T (t) (γ(t) − γ(t0 )) = γ ′ (t) = dθ dθ κ(t) Integrating this with respect to θ shows that |γ(t) − γ(t0 )| ≤ θ/κ. Now compute: 1 d d N (t) · (γ(t) − γ(t0 )) = N (t) · (γ(t) − γ(t0 )) dθ κ(t) dt 1 1 = (−κ(t)T (t)) · (γ(t) − γ(t0 )) + N (t) · T (t) = T (t) · (γ(t) − γ(t0 )) κ(t) κ(t) This implies that: d N (t) · (γ(t) − γ(t0 )) ≤ |T (t) · (γ(t) − γ(t0 ))| ≤ θ dθ κ Integrating with respect to θ yields the result we seek.
�
Proposition B.4 Suppose that V(kθ ) is smooth and compactly supported on [−α, α]. Let Wˇ p (r) be a function symmetric about r = 0, and strictly positive on the interval [−α2 /2κ, α2 /2κ]. Suppose also that W(kr ) satisfies (4.1a). Assume also that (4.4a) is satisfied. Then at the point γj (tj (0)), we have that: Z
∞
−∞
Z
α
e
−ik·x e
ik·γj (tj (~ k))
√
π q V(kθ )kr 1/2 W(kr )dkθ kr dkr |k| ~ κj (tj (k)) r π ≥ kV(kθ )kL1 (dkθ ) inf W p (r) 2¯ κ r∈[−α2 /2κ,α2 /2κ] 3/2
−α
(B.12)
Proof. Note that: k · (γj (tj (~k)) − x) = kr Nj (tj (kθ )) · [γj (tj (kθ )) − x]
(B.13)
Following the calculations of (B.1) and using (4.1b) as well as (B.13) we find: Z
∞
−∞
Z
α
~
e−ik·x
eik·γj (tj (k)) 3/2
√ π q V(kθ )kr 1/2 W(kr )dkθ kr dkr κj (tj (~k))
|k| √ Z α π ˇ j (tj (kθ )) · [γj (tj (kθ )) − x])dkθ p V(kθ )W(N = κ (t −α j j (kθ )) √ Z α � � π p V(kθ )g Nj (tj (kθ )) · [γj (tj (kθ )) − x] = κj (tj (kθ )) −α � �k max + ktex Nj (tj (kθ )) · [γj (tj (kθ )) − x] dkθ × cos 2
−α
38
(B.14)
For x = γj (tj (0)) and α ∈ [−α, α], Lemma B.3 implies that: |Nj (t) · (γ(t) − x)| ≤
α2 π ≤ 2κ 4
where √ the last line follows from Lemma B.3. This implies that cos(Nj (t) · (γ(t) − x)) ≥ 1/ 2 and therefore: (B.14) ≥
Z
α
−α
√ 1 π p V(kθ )m √ dkθ 2 κj (tj (kθ )) p √ ≥ π/2 kV(kθ )kL1 (dkθ ) / κ ¯
inf
r∈[−α2 /2κ,α2 /2κ]
This is what we wanted to prove.
B.1
Wˇ p (r) �
Proof of Theorem 4.3: Putting it together
We now consider the behavior of the filter applied to the entire asymptotic expansion of the image. Lemma B.5 Suppose that W(kr ) satisfies (4.4b). In that case √ ik·γ(tj (~ k)) 1 e π ≤ C(W, V, α) Dθ,α q , inf 3/2 t∈[tj (−α),tj (α)] |γj (t) − x| |k| κj (tj (~k))
(B.15)
where C(W, V, α) is given by (4.4d).
Proof. As before, we study the case when θ = 0, since the rest can be treated by rotation. Recalling (B.5), we define the quantities: + DN
=
DT+
=
sup
inf
|Nj (s) · [γj (t) − x]|
sup
inf
|Tj (s) · [γj (t) − x]| .
s∈[tj (−α),tj (α)] t∈[tj (−α),tj (α)] s∈[tj (−α),tj (α)] t∈[tj (−α),tj (α)]
+ Obviously DN ≥ DN and DT+ ≥ DT . Let N = Nj (s) be the normal at which + DN is achieved, and T = Tj (s) be the tangent at which DT+ is achieved. Let p~ = γj (t) − x. Since the angle between N and T is at most 2α, we find that |x|2 ≤ sec(2α)2 |x|2(N,T ) , where | · |(N,T ) is the L2 norm taken in the coordinate system (N, T ). Thus, we find: 2
2
|~ p| ≤ sec(2α)2 |~ p|(N,T ) ≤ 2 sec(2α)2 max{|N · ~p| , |T · p~|}2
39
Thus: sup t∈[tj (−α),tj (α)]
=
√
≤
|γj (t) − x|
√ 2 sec(2α)
sup t∈[tj (−α),tj (α)]
2 sec(2α) max{
sup t∈[tj (−α),tj (α)]
max{|N · (γj (t) − x)| , |T · (γj (t) − x)|}2 |N · (γj (t) − x)| , =
sup t∈[tj (−α),tj (α)]
|T · (γj (t) − x)|}
√ + 2 sec(2α) max{DN , DT+ }
This implies that: 1 cos(2α) inf min ≥ √ |γj (t) − x| 2
�
1 1 +, DN DT+
�
cos(2α) ≥ √ min 2
�
1 1 , DN DT
�
(B.16)
Now, substituting (4.4b) into (B.4a) we find: p √ ik·γj (tj (~ k)) CW π/κ kV(kθ )kL1 (S1 ,dkθ ) e π Dα,θ q ≤ 3/2 DN |k| κj (tj (~k))
(B.17)
Using (B.4b), we find:
√ ik·γj (tj (~ k)) e π Dα,θ q 3/2 |k| ~ κj (tj (k))
! √ 2 π kW(kr )/kr kL1 (R,dkr ) kV ′ (kθ )kL1 kV(kθ )kL1 γj′′′ (t) L∞ + ≤ DT κ1/2 2κ5/2
√ ˇ + 1) L∞ π kV(kθ )kL1 W(z)(z + D2 " T
′′′ # √
γ (t) ∞ π j L ≤ √ 2 kW(kr )/kr kL1 (R,dkr ) kV ′ (kθ )kL1 + kV(kθ )kL1 DT κ 2κ2 !
√ ˇ (B.18) + 1) ∞ + κ W(z)(z L
40
Taking the min of (B.17) and (B.18), and using (B.16) we find: √ � � √ ik·γj (tj (~ k)) π 1 1 Dα,θ e ≤ √π min q , κ DN DT |k|3/2 κj (tj (~k)) ( × max CW kV(kθ )kL1 (S1 ,dkθ ) , "
2 kW(kr )/kr kL1 (R,dkr ) kV ′ (kθ )kL1 + kV(kθ )kL1 +
√ ˇ + 1) L∞ κ W(z)(z
!)
√ � � 2π 1 ≤ inf √ |γj (t) − x| κ cos(2α) ( max CW kV(kθ )kL1 (S1 ,dkθ ) , "
′
2 kW(kr )/kr kL1 (R,dkr ) kV (kθ )kL1 + kV(kθ )kL1
′′′ #
γ (t) j L∞ 2κ2
′′′ #
γ (t) ∞ j L 2κ2
√ ˇ + 1) L∞ + κ W(z)(z
This is what we wanted to show.
!)
(B.19) �
Recalling Definition 4.2, we have the following result: Proposition B.6 Let x be a point not on any of the curves γi (t). Then (with C(W, V, α) as in Lemma B.5): M−1 X C(W, V, α) ≤ Dθ,α c (x) ρ 1 j γj d(x, Aθ,α ) j=0
+ kr −1/2 W(kr )
L1 (R,dkr )
where Cgeo is defined in (3.3).
41
kV(kθ )kL1 (S1 ,dkθ ) Cgeo ,
(B.20)
Proof. Begin by using (3.2): M−1 X ~ Dθ,α c ( k) ρ 1 j γj j=0 √ √ M−1 ik·γ(tj (~ k)) ik·γ(tj (−k)) X ~k) e E( e π π + Dθ,α q p ρj ≤ Dθ,α + 3/2 3/2 κj (tj (−k)) |k|2 |k| |k| j=0 κj (tj (~k)) √ √ M−1 ik·γ(tj (~ k)) ik·γ(tj (−k)) X π π e e + Dθ,α q p ρj Dθ,α ≤ 3/2 3/2 κj (tj (−k)) |k| |k| j=0 κj (tj (~k)) E(~k) + Dθ,α 2 ≤ C(W, V, α) |k| � � M−1 X 1 1 inf ρj × + inf t∈[tj (−α+θ),tj (α+θ)] |γj (t) − x| t∈[tj (−α+θ+π),tj (α+θ+π)] |γj (t) − x| j=0 E(~k) + Dθ,α |k|2 C(W, V, α)2M E(~k) ≤ max ρj + Dθ,α 2 j d(x, Aθ,α ) |k| C(W, V, α)2M E(~k) ≤ ρ + Dθ,α 2 d(x, Aθ,α ) |k|
To control the last term, recall the bound Cgeo in(3.3) on E(~k):
Z ~ E(~k) E( k) 1/2 −ik·x = dk k dk W(k ) e V(k )k Dθ,α θ r r r θ r 2 2 kr |k| Z Z W(kr ) ~ ≤ 1/2 V(kθ )E(k) dkθ dkr kr Z Z W(kr ) ≤ 1/2 dkr Cgeo |V(kθ )| dkθ kr
kV(kθ )kL1 (S1 ,dkθ ) Cgeo . ≤ kr −1/2 W(kr ) L1 (R,dkr )
42
�
Proposition B.7 We have the following estimate at the point x = γj (tj (θ)).
r π (x) ρj 1c ≥ ρ kV(kθ )kL1 (dkθ ) inf W p (r) γj 2¯ κ r∈[−α2 /2κ,α2 /2κ] j=0 " #
C(W, V, α)(2M − 1)
−1/2 − W(kr ) kV(kθ )kL1 (S1 ,dkθ ) Cgeo . + kr L1 (R,dkr ) 2M d(x, Aθ,α j ) (B.21) [θ·Nj (t)]Dθ,α
M−1 X
Proof. By Proposition B.4, we have that: ~
Dθ,α ρ
eik·γj (tj (k)) 3/2
|k|
√ π
q 1kθ ∈[−α,α] (kθ ) κj (tj (~k)) r π ≥ ρ kV(kθ )kL1 (dkθ ) W p (r) inf 2¯ κ r∈[−α2 /2κ,α2 /2κ]
Applying the same reasoning as in the proof of Proposition B.6, we find that: X Dθ,α c ρj 1γi (x) ≤ i6=j " #
C(W, V, α)(2M − 2)
−1/2
+ kr W(kr ) 1 kV(kθ )kL1 (S1 ,dkθ ) Cgeo . L (R,dkr ) d(x, Aθ,α j )
The second triangle inequality yields the result we seek.
�
Proof of Theorem 4.3. Proposition B.6 proves (4.4c). Note that Assumption 2 implies that d(γj (tj (θ)), Aθ,α j ) ≥ δ. Substituting this into Proposition B.7 proves (4.4e), and thus completes the proof of Theorem 4.3. �
References [1] M. Abramawitz and I.A. Stegun. Handbook of Mathematical Functions. Dover, 1965. [2] N. Amenta, M. Bern, and D. Eppstein. The crust and the β-skeleton: Combinatorial curve reconstruction. Graphical models and image processing: GMIP, 60(2):125, 1998. [3] R. Archibald and A. Gelb. A method to reduce the gibbs ringing artifact in mri scans whilekeeping tissue boundary integrity. IEEE Transactions on Medical Imaging, 21(4):305–319, 2002.
43
[4] John P. Boyd. Trouble with gegenbauer reconstruction for defeating gibbs’ phenomenon: Runge phenomenon in the diagonal limit of gegenbauer polynomial approximations. J. Comput. Phys., 204(1):253–264, 2005. [5] Emmanuel J. Cand`es and Laurent Demanet. The curvelet representation of wave propagators is optimally sparse. Comm. Pure Appl. Math., 58(11):1472–1528, 2005. [6] Emmanuel J. Cand`es and David L. Donoho. New tight frames of curvelets and optimal representations of objects with piecewise C 2 singularities. Comm. Pure Appl. Math., 57(2):219–266, 2004. [7] Siu-Wing Chen, Stefan Funke, Mordecai Golin, Sheung-Hung Kumar, Piyush Poon, and Edgar Ramos. Curve reconstruction from noisy samples. Comput. Geometry, 31:63–100, 2005. [8] Tamal K. Dey, Kurt Mehlhorn, and Edgar A. Ramos. Curve reconstruction: Connecting dots with good reason. In Symposium on Computational Geometry, pages 197–206, 1999. [9] Tamal K. Dey and Rephael Wenger. Reconstructing curves with sharp corners. Computational Geometry, 19(2–3):89–99, 2001. [10] S. Engelberg and E. Tadmor. Recovery of edges from spectral data with noise—a new perspective. SIAM Journal on Numerical Analysis, 2008. [11] Charles Fefferman. A note on spherical summation multipliers. Israel J. Math, 15:44–52, 1973. [12] Anne Gelb. Parameter optimization and reduction of round off error for the gegenbauer reconstruction method. Journal of Scientific Computing, 20(3):433–459, 2004. [13] Anne Gelb. Reconstruction of piecewise smooth functions from non-uniform grid point data. Journal of Scientific Computing, 30(3):409–440, 2007. [14] Anne Gelb and Dennis Cates. Segmentation of images from fourier spectral data. Communications in Computational Physics, 5(2–4):326–349, 2009. [15] Anne Gelb and Eitan Tadmor. Detection of edges in spectral data. Applied and Computational Harmonic Analysis, 7(1):101–135, 1999. [16] Anne Gelb and Eitan Tadmor. Detection of edges in spectral data ii. nonlinear enhancement. SIAM J. Numer. Anal., 38(4):1389–1408, 2000. [17] L. Greengard and C. Stucchio. Reconstructing curves from points and tangents. 2009. [18] Kanghui Guo, Demetrio Labate, and Lim Wang-Q. Edge analysis and identification using the continuous shearlet transform. Applied and Computational Harmonic Analysis, 27:24–46, 2009. 44
[19] Frank W.J. Olver. Asymptotics and Special Functions. A.K. Peters, Ltd., Wellesley, MA, 1997. [20] Mark A. Pinsky. Fourier inversion for multidimensional characteristic functions. Journal of Theoretical Probability, 6(1):187–193, 1993. [21] A. Seeger, C.D. Sogge, and E.M. Stein. Regularity properties of fourier integral operators. Ann. Math, 134:231–251, 1993. [22] Eugene Sorets. Fast fourier transforms of piecewise constant functions. J. Comput. Phys., 116(2):369–379, 1995. [23] Elias M. Stein. Harmonic analysis: real-variable methods, orthogonality, and oscillatory integrals. Princeton University Press, Princeton, NJ, 1993.
45