in clean, additive babble noise and reverberant environments. The results show that entropy features improve the baseline performance and robustness in ...
SPECTRAL ENTROPY AS SPEECH FEATURES FOR SPEECH RECOGNITION Aik Ming Toh
Roberto Togneri
Sven Nordholm
School of Electrical, Electronic, and Computer Engineering The University of Western Australia
School of Electrical, Electronic, and Computer Engineering The University of Western Australia
Western Australian Telecommunications Research Institute
Abstract— This paper presents an investigation of spectral entropy features, used for voice activity detection, in the context of speech recognition. The entropy is a measure of disorganization and it can be used to measure the peakiness of a distribution. We compute the entropy features from the short-time Fourier transform spectrum, normalized as a PMF. The concept of entropy shows that the voiced regions of speech have lower entropy since there are clear formants. The flat distribution of silence or noise would induce high entropy values. In this paper, we investigate the use of the entropy as speech features for speech recognition purpose. We evaluate different sub-band spectral entropy features on the TI-DIGIT database. We have also explored the use of multi-band entropy features to create higher dimensional entropy features. Furthermore, we append the entropy features to baseline MFCC 0 and evaluate them in clean, additive babble noise and reverberant environments. The results show that entropy features improve the baseline performance and robustness in additive noise.
I. INTRODUCTION Speech recognition systems typically use speech features based on the short-term spectrum of speech signal. The state of the art feature used in most speech recognizer is the Melfrequency cepstral coefficients (MFCC) with enhancements such as regression features and normalization strategy. Other speech features such as perceptual linear prediction (PLP) and its variant RASTA [1] are also popular speech features. An additional type of feature based on the entropy has recently emerged in the context of speech recognition. It is also know as the Wiener entropy since it measures the power spectral flatness of the spectrum. Misra proposed the use of entropy features as speech features for use in speech recognition [2]. Entropy is usually used in the context of pattern classification and information technology. Originally the entropy was defined for information sources by Shannon [3]. It is a measure of disorganization or uncertainty in a random variable. The information can be interpreted as essentially the negative of the entropy, and the negative logarithm of its probability. The application of the entropy concept for speech recognition is based on the assumption that the speech spectrum is more organized during speech segments than during noise segments. In addition, the spectral peaks of the spectrum are supposed to be more robust to noise. Thus a voiced region of speech would induce low entropy since there are clear formants in the region. The spectra of noise or unvoiced region
would have a flatter distribution and thus higher entropy. This concept has enabled the entropy to be considered in voice activity detection [4] and speech recognition [2]. In this paper we investigate the entropy feature for its performance in speech recognition. Misra had evaluated the entropy features for phoneme recognition. We extend the entropy features for connected digit recognition on the TI-DIGIT database and study their robustness in noisy environments. In addition, we append the entropy features to MFCC 0 features rather than the PLP features used in [5]. Our experiments in [6] showed that MFCC 0 outperformed the PLP features both in recognition performance and robustness. We want to determine the contribution of entropy features on the state-of-art feature. We have also generated multiple multi-band entropy features from smaller sub-bands entropy features. Furthermore, we evalute the entropy features with MFCC 0 in additive babble noise and reverberant noise for robustness. The paper is organized as follows: Section 2 presents an overview of the spectral entropy features and its derivation. The third section explains the experimental setup and is followed by the results in section 4. The final section comprises the conclusion of the work. II. S PECTRAL E NTROPY The entropy has been used to detect silence and voiced region of speech in voice activity detection. The discriminatory property of this feature gives rise to its use in speech recognition. The entropy can be used to capture the formants or the peakiness of a distribution. Formants and their locations have been considered to be important for speech tracking. Thus, the peak capturing ability of entropy was employed for speech recognition. We converted the spectrum into a probability mass function (PMF) by normalizing the spectrum in each sub-band. Misra also suggested the use of entropy computation from the fullband normalized spectrum [5]. Equation (1) is used for subband normalization. Xi xi = PN i=1
Xi
for i = 1 to N
(1)
where Xi represents the energy of the it h frequency component of the spectrum and xi is the PMF of the spectrum. The
8
8
7
7
6 6 5 5 4 4 3 3 2
2
1
1
0
20
40
60
80
100
120
140
160
180
0
0
20
40
60
80
100
120
140
160
180
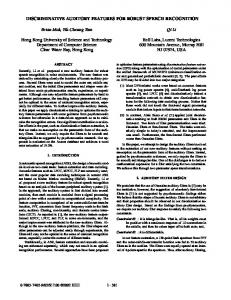
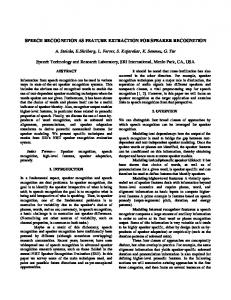
Fig. 1. The entropy contour of connected digit utterance ”1-9-8-6” in clean (dashed line) and corrupted with babble noise at SNR10dB (line)
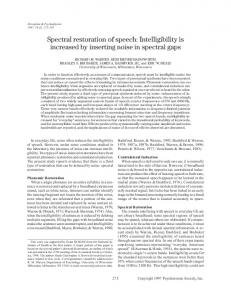
Fig. 2. The entropy contour of digit utterance ”1-9-8-6” in clean (dashed line) and corrupted speech with RT0.2s (line)
area under the normalized spectrum in each sub-band should sum to 1. The normalized spectra were considered as a PMF and used for entropy computation.The entropy was computed with equation (2). X H(x) = − xi · log2 xi (2)
entropy. Due to the number of points in STFT spectrum, we divided the distribution into sub-bands of equal size with the remainder allocated into the last sub-band. The K sub-bands of interest were the full-band, 2, 3, 4, 5, 6, 8, 12 and 13 subbands. The performance of the 12 and 13 sub-bands entropy features will be compared against the baseline MFCC and MFCC 0 features. Initially we only proposed to compute the entropy features up to 13 subbands. Misra [5] reports that the sub-bands 16, 24 and 32 yield surprisingly good performance and we decided to investigate those sub-bands. We also appended the sub-band entropy features to create larger dimensional entropy features. Misra [2] have only evaluated the performance of 15 dimensional entropy computed from the full-band, 2, 3, 4 and 5 sub-bands entropy features. We computed multiple dimensional entropy features to show the contribution of smaller sub-bands in comparison with conventional entropy features of the same size.
x∈X
Figure 1 shows the full-band entropy contour of the speech utterance ”1-9-8-6”. The dashed line illustrates the reference or the entropy contour of the clean utterance. The line contour represents the entropy contour of the corrupted utterance under influence of babble noise at SNR10dB. The figure shows that the entropy feature managed to track most of the formants which is represented by the contour trough even in low SNR of 10dB. The beginning and end of the entropy contour depicts that the entropy for the distribution increases as the level of noise increased. We have also compared the full-band contours of the utterance under the babble noise influence of 20dB and 10dB. The plots revealed that the location of the peak remained pretty much in place and the noise region contour were almost similar. The entropy features were able to discriminate the speech region and the noise region. We have also carried out the same analysis for reverberant noise and initial results on slight reverberation indicates that spectral entropy may not be suitable for speech recognition in reverberant condition. Figure 2 illustrates the contour of the clean (dashed line) and the utterance under reverbernt influence of RT 0.2s. The contour of the reverberant utterance has been shifted. Reverberations have been shown to introduce a temporal smearing effect in [6]. The formants have been displaced due to temporal smearing and this was not ideal for speech recognition. III. S UB - BANDS E NTROPY The full-band entropy captures the gross peakiness of the spectrum. We partitioned the STFT spectrum into sub-bands for improved resolution. The distribution is separated into K non-overlapping sub-bands. We refered to this as K subbands entropy features whereas Misra called them multi-band
IV. EXPERIMENTAL SETUP The TI-digit corpus was used in the speech recognition experiments. The database comprised both isolated and connected digit utterances. The training data contained utterances of 24 male and 24 female speakers. There were 8 male and 8 female speakers for the testing data. Each subset composed of 77 digit utterances. The babble noise from NOISEX 92 database was used to corrupt the testing data for evaluation in noisy environments. The babble noise represented a real-world non-stationary environment noise. The test data was corrupted with babble noise at five different signal-to-noise ratios (SNRs) ranging from 0dB to 40dB at the intervals of 10dB. Reverberant effects were captured by estimating the impulse response of the room environments from long segments of speech. The experiment used the room impulse response designed to match the characteristic of a 2.2m high, 3.1m wide and 3.5m long room. The microphone and the speakers were localized 0.5m from the wall at opposite end. The speech was convolved with the RT60 room impulse response. The
TABLE I
TABLE II
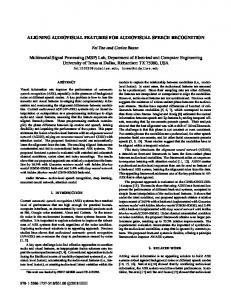
W ORD ERROR RATES FOR SUB - BAND ENTROPY FEATURES
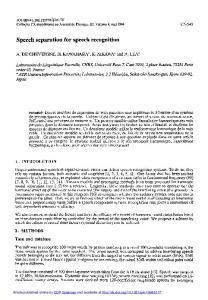
W ORD ERROR RATES FOR DIMENSIONAL ENTROPY FEATURES
Entropy
Word Error Rates (%)
DIM Entropy
Word Error Rates (%)
Full-band 2 sub-bands 3 sub-bands 4 sub-bands 5 sub-bands 6 sub-bands 8 sub-bands 12 sub-bands 13 sub-bands
46.96 39.52 34.98 31.87 32.96 25.67 24.31 23.50 24.78
12 sub-bands (3,4,5) 12 sub-bands (2,4,6) 13 sub-bands (1,3,4,5) 13 sub-bands (1,4,8) 13 sub-bands (1,2,4,6) 14 sub-bands (2,4,8) 15 sub-bands (1,2,3,4,5)
21.31 18.98 18.96 15.79 17.87 16.49 20.54
B. Dimensional Entropy number of filter coefficients were adjusted according to the reverberation time. We chose MFCC 0 features as the baseline because of their broad use in speech research and adoption as the state-ofart features in speech recognition systems. In our previous study [6], we have shown that the PLP features fell short both in performance and recognition, thus we decided to adopt MFCC 0 as the baseline feature. All the speech files were pre-emphasized and windowed with a Hamming window. The speech signal was analyzed every 10ms with a frame width of 25ms. The number of points of the STFT spectrum is 257. A Mel-scale triangular filterbank with 26 filterbank channels was used to generate the Mel-frequency cepstral coefficients (MFCC) features. The MFCC 0 coefficients constitute the 12 static MFCC coefficients and the zeroth cepstral coefficients. The HMM model used 15 states and 5 mixtures for the connected digit recognition. We do not use any penalty factor to optimize the recognition accuracy for these experiments.
Table II displays the WERs for dimensional entropy computed from smaller sub-bands. The dimensional entropy features performed better than the conventional sub-bands entropy features. We were able to yield an improvement of about 5% to 9% for 13 dimensional entropy compared to 13 sub-bands entropy features. The 14 dimensional and 15 dimensional entropy features have also outperformed the conventional subband features by 10.5% and 9.7% respectively. The WERs for conventional 14 and 15 sub-bands entropy features were 27.03% and 30.30% respectively. Our primary aim in investigating the 12 and 13 dimensional sub-bands was to evaluate their performances in comparison to the baseline MFCC and MFCC 0 features. The results showed that dimensional entropy features were still unable to match the performance of the baseline feature. This showed that spectral entropy features were not suitable to be used as baseline speech features. Thus, we decided to utilize them as additional features and appended them to our baseline MFCC 0 feature for speech recognition. C. MFCC and Subband Entropy
V. EXPERIMENT RESULTS A. Subband Entropy Table I shows the word error rates (WERs) for spectral entropy features up to 13 sub-bands. We have conjectured that entropy features with sub-bands greater than 5 would contribute more to the recognition performance which was not shown in [2]. We could observe the contribution of entropy features with better resolution. The WERs decreased as the dimension of the entropy increased as in Table I. However, the 12 and 13 sub-band entropy features did not outperform the baseline MFCC and MFCC 0 with WERs of just 2.97% and 2.05% respectively. Misra extended their entropy computations to 32 sub-bands in [5]. They have reported that 16-bands, 24-bands and 32bands entropy features gave WERs of 15% to 18%. Our results gave different perspectives as the WERs for subbands greater than 16 were typically more than 25%. This raised the issue of redundancy in excessive sub-bands entropy computation.
The entropy features were not competitive when compared to the baseline MFCC 0 features, therefore we appended the entropy features to assess the performance of entropy features as additional features. The entropy features did improve the baseline recognition accuracy slightly. Most of the entropy features reduced the WERs to less than 2.00% in the clean environment. We have also appended the dimensional entropy features to the baseline MFCC 0. The results did not show much contribution from the dimensional entropy features and caused slight degradation in some cases. The use of dimensional entropy features should enhance the performance of the baseline but experimental results showed otherwise. D. Spectral Entropy in Noisy Environments We then performed speech recognition with MFCC 0 and entropy features in additive babble noise. The NOISEX 92 noise characterized the background noise of real-world environment. The baseline MFCC 0 results from [6] were used as benchmark. Table III shows the WERs for MFCC 0 appended with entropy features in additive noise environment. All the
TABLE III W ORD ERROR RATES % FOR MFCC 0
WITH ENTROPY FEATURES IN AADDITIVE BABBLE NOISE
Clean
SNR 40
SNR 30
SNR 20
SNR 10
MFCC 0
2.05
2.33
3.09
17.97
59.93
90.20
MFCC0 +Full MFCC0 +2 MFCC0 +3 MFCC0 +4 MFCC0 +5 MFCC0 +6 MFCC0 +8 MFCC0 +12 MFCC0 +13
2.03 1.76 1.76 1.93 1.88 1.76 2.08 1.91 2.13
2.15 1.98 1.81 2.08 2.00 1.81 2.10 2.00 2.13
4.98 4.41 4.53 3.34 3.54 3.42 2.97 2.45 2.72
29.73 22.85 24.21 17.48 19.83 17.95 19.18 14.73 13.42
64.43 55.00 61.34 51.68 59.38 52.52 55.17 51.31 50.22
91.83 86.83 93.14 88.42 94.41 89.48 94.90 88.25 88.04
TABLE IV W ORD ERROR RATES % FOR MFCC 0 AND ENTROPY FEATURES IN REVERBERANT ENVIRONMENTS
Entropy
RT 0.1s
RT 0.2s
Full-band 2 sub-bands 3 sub-bands 4 sub-bands 5 sub-bands 6 sub-bands 8 sub-bands 12 sub-bands 13 sub-bands
3.56 3.96 3.42 4.43 4.23 4.41 5.07 5.15 5.22
8.89 11.01 9.95 10.82 9.13 9.18 9.53 8.89 8.96
spectral entropy features contributed to robustness as shown by the performance in SNR 40dB. However, the entropy features with more sub-bands performed better than those with less sub-bands as the SNR decreased. The contribution of sub-band entropy features were evident for 12 and 13 sub-bands entropy. These entropy features have shown robustness in additive noise throughout different level of SNRs. Other sub-bands such as sub-band 2,4 and 6 were also robust to additive babble noise. The results in Table III demonstrated that MFCC 0 and entropy features with more sub-bands performed better than the baseline MFCC 0 features across different levels of additive noise. We have also evaluated speech recognition with MFCC 0 and spectral entropy features in reverberant environments. Table IV records the WERs for speech recognition with MFCC 0 and entropy features in reverberant environments. Preliminary results in light reverberation of RT 0.1s and RT 0.2s did not show any significant contribution or robustness from spectral entropy features. The WERs for baseline MFCC 0 in reverberant condition were 4.48% and 7.40% for RT60 of 0.1s and 0.2s respectively. The performance of the entropy features greatly deteriorated as the reverberant level increased. One reason would be the weakness of spectral entropy in capturing shifted spectral peaks. Figure 2 illustrates the effects of reverberation on spectral entropy contour. The temporal
SNR 0
smearing effect induced by reverberations have shifted the formants and the entropy distribution. Thus, spectral entropy failed to perform for reverberant speech recognition. VI. CONCLUSION The utilization of the spectral entropy features have been adopted in speech activity detection and speech recognition. We have investigated the use of spectral entropy as speech features and evaluated them on the TI-DIGIT connected digit database and in noisy environments. The spectral entropy features with better resolution such as sub-bands 12 and 13 performed better than other sub-bands. The spectral entropy features alone however were not able to surpass the performance of the cepstral features such as the baseline MFCC 0. The use of spectral entropy features as additional features showed improvements in the recognition accuracy and robustness against additive noise when compared with the baseline MFCC 0 features. Both the analysis and the results showed that entropy features were less affected by additive noise such as babble noise. The entropy contours also demonstrated that formants were less affected by noise. However, spectral entropy features were not suitable for speech recognition in reverberant environment. Both temporal smearing and shifted formants contributed to the poor performance of spectral entropy in reverberant environment. R EFERENCES [1] H. Hermansky and N. Morgan, “Rasta processing of speech,” IEEE Trans. SAP, vol. 2, no.4, July, Oct. 1994. [2] H. Misra, S. Ikbal, H. Bourlard, and H. Hermansky, “Spectral entropy based feature for robust asr,” in Proc. ICASSP, May 2004, pp. 193–196. [3] C.E. Shannon, “A mathematical theory of communication,” Bell System Technical Journal, vol. 27, pp. 379–423, 623–656, July, Oct. 1948. [4] P. Renevey and A. Drygajlo, “Entropy based voice activity detection in very noisy conditions,” in Proc.Eurospeech, USA, Sept. 2001, pp. 1887–1890. [5] H. Misra, S. Ikbal, S. Sivadas, and H. Bourlard, “Multi-resolution spectral entropy feature for robust asr,” in Proc. ICASSP, March 2005, pp. 253– 256. [6] A.M. Toh, R. Togneri, and S. Nordholm, “Investigation of robust features for speech recognition in hostile environments,” in Proc. APCC, 2005.