arXiv:quant-ph/0503101v1 10 Mar 2005. Spectral implementation of some quantum algorithms by one- and two-dimensional nuclear magnetic resonance.
Spectral implementation of some quantum algorithms by one- and two-dimensional nuclear magnetic resonance Ranabir Das† and Anil Kumar †
arXiv:quant-ph/0503101v1 10 Mar 2005
‡
†‡
Department of Physics, Indian Institute of Science, Bangalore, India
Sophisticated Instruments Facility, Indian Institute of Science, Bangalore, India
Quantum information processing has been effectively demonstrated on a small number of qubits by nuclear magnetic resonance. An important subroutine in any computing is the readout of the output. “Spectral implementation” originally suggested by Z.L. Madi, R. Bruschweiler and R.R. Ernst, [J. Chem. Phys. 109, 10603 (1999)], provides an elegant method of readout with the use of an extra ‘observer’ qubit. At the end of computation, detection of the observer qubit provides the output via the multiplet structure of its spectrum. In “spectral implementation” by two-dimensional experiment the observer qubit retains the memory of input state during computation, thereby providing correlated information on input and output, in the same spectrum. “Spectral implementation” of Grover’s search algorithm, approximate quantum counting, a modified version of Berstein-Vazirani problem, and Hogg’s algorithm is demonstrated here in three and four-qubit systems.
I. INTRODUCTION
In 1982 Feynmann pointed out that it would be more efficient to simulate the behavior of a quantum system using a quantum, rather than a classical device [1]. The idea of a purpose-built quantum computer which could simulate the physical behavior of a quantum system as well as perform certain tasks much faster than classical computer, attracted immediate attention [2,3]. The theory of such quantum computers is now well understood and several quantum algorithms like Deutsch-Jozsa (DJ) algorithm, Grover’s search algorithm, Shor’s factorization algorithm, BersteinVazirani problem, Hogg’s algorithm and quantum counting have been developed [4–10]. However, building a realistic large scale quantum computer has been extremely challenging [11,12]. Various devices are being examined for building a quantum information processing (QIP) device which is coherent and unitary [11]. Among these, nuclear magnetic resonance (NMR) has shown great promise by demonstrating several quantum algorithms and other QIP tasks on small-scale devices. [13–28]. The last step in any quantum information processing task is the “readout” of the output. Typically in NMR, the readout is obtained by selectively detecting spins [29], or by mapping out the full density matrix [30–32]. It was first pointed out by Ernst et.al. [33] that it is 1
advantageous from the spectroscopic viewpoint that quantum states can be assigned to individual spectral lines, corresponding to transitions between energy levels rather than to the energy levels themselves [33]. However, for such an advantage one has to use an extra qubit called “observer” qubit. After computation the readout is obtained by detecting only the observer qubit, whose multiplet spectrum provides the result of the computation carried out on the work qubits. Such a “spectral implementation” of a quantum computer was demonstrated by implementation of some logic gates by one- and two-dimensional NMR [33]. Later, “spectral implementation” of a complete set of logic gates and DJ-algorithm [34], Berstein-Vazirani problem [35] and quantum Fourier transform [36] has also been implemented by NMR. In this work we extend this range by spectrally implementing Grover’s search algorithm, approximate quantum counting, a modified version of Berstein-Vazirani problem, and Hogg’s algorithm. All the algorithms are implemented by both one- and two-dimensional NMR. To the best of our knowledge this is the first “spectral implementation” of these algorithms. II. THEORY
A convenient representation of the density matrices of pure states in Liouville space can be obtained by the polarization operators for each qubit (k) [33,37], I0k
= |0ih0| =
I+k = |0ih1| = Ixk
1 0
!
I1k
0 0 ! 0 1
I−k = |1ih0| =
0 0
1 1 = (I+k + I−k ) = 2 2
1 1 Izk = (I0k − I1k ) = 2 2
= |1ih1| =
0 1
!
Iyk
1 0 ! 1 0
0 0
!
0 1 ! 0 0 1 0
1 1 = (I+k − I−k ) = 2i 2i
0
1
−1 0
!
(1)
0 −1
For example, the density matrix of a pure state |00i + |11i can be expressed as
1 0 0 1
0 0
0 0 0
0 0 0 1 0 0 1
= |00ih00| + |11ih11| + |00ih11| + |11ih00|
(2)
= I01 I02 + I11 I12 + I+1 I+2 + I−1 I−2
(3)
2
The scheme of “spectral implementation” of one-dimensional (1D) and two-dimensional (2D) NMR is respectively given in figure 1(a) and 1(b). We start with the thermal equilibrium density matrix Iz0 + Iz1 + Iz2 + .. + IzN and in the preparation period we create density matrix of the form Iz0 I01 I02 ..I0N , where Iz0 I01 I02 ..I0N = (I00 I01 I02 ..I0N − I01 I01 I02 ..I0N )/2. In this state the last N-1 qubits are simultaneously in pseudopure state (PPS) [13] in two distinct domains of energy levels, in which the observer qubit is in state |0i and |1i respectively. Such a state is known as sub-system pseudopure state [14]. This is further elaborated in figure 2. The schematic diagram of the energy levels and the spectrum of the observer qubit in a three qubit system, where the first qubit is the observer qubit, is given in figure 2. Figure 2(a) shows the equilibrium deviation populations (populations in excess of uniform background population) of various energy levels and figure 2(b), the equilibrium spectrum of the observer qubit obtained after a (π/2) detection pulse. Each of the spectral lines in the multiplet, correspond to the state of the other qubits. The energy level diagram along with the deviation populations after creating the desired initial state of Iz0 I01 I02 is given in 2(c). The corresponding observer qubit spectrum has a single line, that of |00i, indicating that the other qubits are in |00i state.
1 2 N Typically after computation, the density matrix is of the form Iz0 I0/1 I0/1 ..I0/1 , where the subscript
0/1 means that the particular qubit is either in 0 or 1 state. A subsequent (π/2)0y pulse on the 1 2 N observer (I 0 ) qubit creates single quantum coherences of the form Ix0 I0/1 I0/1 ..I0/1 , which gives a
single line in the spectrum corresponding to the output state of other qubits. An example for the 3-qubit system is given in figure 2. Let us assume that we start with the initial |00i pseudopure state of the qubits (other than observer qubit) and after some computation let the output state be |11i. After such a computation, the deviation populations and spectrum of observer qubit are given respectively in figure 2(e) and 2(f). In some algorithms however, the output is a superposition of multiple states. Then, the output density matrix will have non-zero populations in all the output states and the coherences between them. The spectrum of the observer qubits will thus have multiple lines, corresponding to all the output states. For example, in the 3-qubit system, if the output state of the work qubits is |00i+|11i,
the density matrix is of the form Iz0 I01 I02 + Iz0 I11 I12 + Iz0 I+1 I+2 + Iz0 I−1 I−2 . After the (π/2)0y detection
pulse on the observer qubit the single quantum coherences of the terms Ix0 I01 I02 and Ix0 I11 I12 will be detected. The spectrum of the observer qubit will show two lines corresponding to the states of |00i 3
and |11i of the other qubits. The coherences will be converted into multiple quantum coherences which are not detected directly in NMR. Hence, the “spectral implementation” gives a measure of the deviation populations or probabilities of each state but does not measure the coherences, which if required can be measured by state tomography [30–32]. A two-dimensional experiment for “spectral implementation” provides the input and output in the same spectrum. The pulse sequence for the two-dimensional experiment of “spectral implementation” is given in figure 1(b). Suppose a computation starts with the input of |00..0i and end with an output of |11..1i state. After preparation of the initial Iz0 I01 I02 ..I0N state the application of the pulse sequence of figure 1(b) can be analyzed in the following steps: Iz0 I01 I02 ..I0N
(π/2)0y
→
Ix0 I01 I02 ..I0N
t
0 Ix0 I01 I02 ..I0N cos(ω00..0 t1 )
1 →
(π/2)0−y ,Gz
→
Comp
→
(π/2)0y −t2
→
0 Iz0 I01 I02 ..I0N cos(ω00..0 t1 ) 0 Iz0 I11 I12 ..I1N cos(ω00..0 t1 ) 0 0 Ix0 I11 I12 ..I1N cos(ω00..0 t1 )cos(ω11..1 t2 ),
(4)
0 0 where ω00..0 and ω11..1 are respectively the frequencies of the |00..0i and |11..1i transitions of the
observer qubit I 0 , (π/2)0y is a (π/2) rotation of the observer qubit (I 0 ) about y-axis, Gz is the gradient
pulse and Comp is the computation performed on the work qubits. It may be noted that the signal from the observer qubit is modulated by the frequencies corresponding to both the input and the output states of the work qubits. A series of experiments are performed with systematic increment of the t1 period followed by detection of the observer qubit’s signal. The collected two-dimensional time domain data set s(t1 , t2 ) is double Fourier transformed yielding a two-dimensional frequency domain spectrum S(ω1 , ω2 ), which contains along ω1 the input states of work qubits before computation and along ω2 , the output state of work qubits after computation. III. GROVER’S SEARCH ALGORITHM
√ Grover’s search algorithm can search an unsorted database of size N in O( N) steps while a classical search would require O(N) steps [5]. Grover’s search algorithm has been earlier demonstrated by NMR [18,19]. The quantum circuit for implementing Grover’s search algorithm on two qubit system 4
is given in figure 3(a). The algorithm starts from a |00i pseudopure state. A uniform superposition of all states are created by the initial Hadamard gates (H). Then the sign of the searched state “x” is inverted by the oracle through the operator Ux = I − 2|xihx|.
(5)
An inversion about mean is performed on all the states by a diffusion operator HU00 H, where U00 = I − 2|00ih00|.
(6)
√ For an N-sized database the algorithm requires O( N) iterations of Ux HU00 H. For a 2-qubit system with four states, only one iteration is required. We have implemented this algorithm on the two qubits of a three qubit system with the third qubit acting as the observer qubit. The three qubit system chosen for this purpose is 4-fluro 7-nitro benzofuran (dissolved in CDCl3 ), which comprises of a two protons (1 H) and a flourine (19 F). The chemical structure of the molecule along with the equilibrium proton and fluorine spectrum is given in figure 4(a). We have chosen the fluorine spin as the observer qubit. The Hamiltonian of the system is H=
2 X i=0
2πνi Izi +
X
2πJij Izi Izj ,
(7)
i>j
where νi are the resonance frequencies of various spins and Jij are the indirect couplings. The experiments were performed at a field of 11.4 Tesla in a Bruker DRX500 spectrometer. At the magnetic field of 11.4 Tesla, the resonant frequency of proton is 500.13 MHz and that of fluorine is 470.59 MHz. The frequency difference between the two protons is 646 Hz. The J-couplings are J01 = -3.84 Hz, J02 =8.01 Hz and J12 = 8.07 Hz. The 1 H transmitter frequency is set at the center of the proton spectrum. The required initial state of Iz0 |00ih00| was prepared by the method of pair of pseudopure states (POPS), originally suggested by Fung [38,39]. The method requires two population distributions, (i) equilibrium populations and (ii) population distribution after a selective (π)-pulse on |000i ↔ |100i.
Subtraction of (ii) from (i) effectively gives the initial state of Iz0 |00ih00| (figure 4(b) corresponding to the schematic PPS of figure 2(c)). It might be noted that the method of creation of sub-system pseudopure states from cat-states can also be adopted for creation of this initial state [40].
1,2 pulse (pulses are applied from left The Hadamard gates are implemented by (π/2)1,2 −y (π)x
to right) [18], where (θ)1,2 denotes a θ-angle pulse (rotation) on 1st and 2nd -qubit about the x 5
x-axis.
The U00 operator is a controlled phase gate which can be implemented by the se-
1,2 1,2 1,2 1,2 quence [(τ /2)(π)1,2 x (τ /2)(π)x ][(π/2)−y (π/2)−x (π/2)y ], where τ = 1/2J12 [18].
The sequence
1,2 [(τ /2)(π)1,2 x (τ /2)(π)x ] evolves the system only under the J12 -coupling and refocuses all other cou1,2 1,2 plings and proton chemical shifts [37], whereas the [(π/2)−y (π/2)−x (π/2)y1,2] is a composite z-rotation
on both the qubits [41]. Similarly, the other phase gates can be constructed as [18], 1,2 1,2 1 2 1,2 U01 = [(τ /2)(π)1,2 x (τ /2)(π)x ][(π/2)−y (π/2)x (π/2)−x (π/2)y ] 1,2 1,2 1 2 1,2 U10 = [(τ /2)(π)1,2 x (τ /2)(π)x ][(π/2)−y (π/2)−x (π/2)x (π/2)y ] 1,2 1,2 1,2 1,2 U11 = [(τ /2)(π)1,2 x (τ /2)(π)x ][(π/2)−y (π/2)x (π/2)y ]
(8)
The pulses which are simultaneously applied on both the qubits are achieved by hard pulses. However, some gates require selective excitation of qubits. Since the resonance frequencies of the two protons are relatively close to each other, selective excitation of a particular proton qubit requires long low-power pulses, which introduce significant errors in the computation [17,19]. Fortunately, in case there are two homonuclear qubits, the selective pulses can be substituted by hard pulses and delays using the variation of “jump-and-return” sequence [42], as demonstrated by Jones et.al. [43]. For example, the pulse sequence of U01 gate requires (π/2)1x (π/2)2−x at one point. This can be achieved by using the identity [41] (π/2)−y (π/2)±z (π/2)y = (π/2)±x .
(9)
If the proton transmitter frequency is set at the center of the spectrum, then ν1 = −ν2 = ν, and, a
delay of (1/4ν) evolves the two protons under the Zeeman Hamiltonian of 2πν(Iz1 − Iz2 ) to give the intermediate (π/2)±z rotation of Eq.[9]. Hence, (π/2)1x (π/2)2−x = (π/2)−y − (1/4ν) − (π/2)y .
(10)
Similarly, the pulse (π/2)1−x (π/2)2x required for U10 gate, can be achieved by (π/2)1−x (π/2)2x = (π/2)y − (1/4ν) − (π/2)−y
(11)
In principle however, the evolution under J-coupling during (1/4ν) would lead to some non-ideal characteristics [44], which is minimal in our system, since the ratio of maximum J-coupling to chemical shift frequency difference ∼ 1:80. This error is significantly less than the error introduced due to evolution under internal Hamiltonian during low power long duration qubit selective pulses. 6
After application of the quantum circuit in figure 3(a) on the initial state of I0z |00ih00|, the observer qubit was detected by a (π/2) pulse. From the obtained spectrum given in figure 5(a), one can identify the searched state (|xi) directly. The two-dimensional experiment for “spectral implementation” has the added advantage that the input and output can be identified in a single spectrum. The 2D experiment of figure 1(b) was carried out, where during the computation period, the quantum circuit of figure 3, was implemented on I1 and I2 . The resultant spectrum given in figure 5(b), shows the input and output in each case. For example, when |xi = |11i, a cross-peak at the frequency of |00i transition along ω1 to that of the |11i transition along ω2 , identifies the input as |00i and the output as |11i. The 2D spectra in figure 5(b) contains the initial state of |00i and the searched state of |00i, |01i, |10i and |11i. In the 1D spectrum of Fig. 5(a), the intial PPS state has to be ascertained independently prior to the implementation of search algorithm. IV. APPROXIMATE QUANTUM COUNTING
The search problem may be thought as finding k-entries out of N, which satisfy the condition f (x) = 1. For the other, N − k entries, f (x) = 0. While Grover’s search algorithm searches these k-items (one at a time), quantum counting finds out the value of k [9,10]. This has extreme importance because in case of multiple solutions, the required number of Grover’s iteration scales as q
O( N/k) [12]. Hence finding out the number of existing solutions speeds up the search procedure. Moreover, the fact that counting can find out whether the number of solutions is zero or finite, makes it applicable to the non-deterministic (NP)-complete search problems, where it is important to know whether solution exists for a given search problem [12]. Approximate quantum counting has been demonstrated using NMR by Jones and Mosca [43]. In this work we provide a “spectral implementation” of approximate quantum counting in the three qubit system of 4-fluro 7-nitro benzofuran, where the I 2 is the target qubit, I 1 the control qubit and the I 0 , the observed qubit. The working of counting algorithm, as detailed by Jones and Mosca [43], is as follows. Counting algorithm can be thought of as a method for estimating the eigenvalue of Grover’s iteration G = HU0 H −1 Uf , where U0 = I − 2|00..0ih00..0| and Uf transforms |xi to (−1)f (x)+1 |xi. Starting from the initial |00..0i state, an initial Hadamard on target qubit creates an uniform superposition √ H|00..0i=(|ψ+i + |ψ− i)/ 2, where |ψ+ i and |ψ− i are two eigenvectors of G [43]. These two eigen7
q
vectors are with eigenvalues of e±iφk , where sin(φk /2) =
k/N. An uniform superposition of the
control qubit is also created. The application of controlled G produces the result 1 |ψ+ i
iφk
= (|0i + e
q
(12)
q
(13)
|1i)|ψ+ i/ (2).
If r iterations are performed, then the state is r |ψ+ i = (|0i + eirφk |1i)|ψ+ i/ (2).
A second Hadamard gate on the control qubit produces |ψfr + i = [(1 + eirφk )|0i + (1 − eirφk )|1i]|ψ+ i/2.
(14)
A similar result will happen in the case of |ψ− i. At the end, the final state |ψf i will be an entangled state of the control and target qubits, except when k = 0 or k = N [9,10,43]. Jones et.al. have implemented the quantum circuit of figure 3(b) in a two-qubit system, measured the signal from control qubit, thereby tracing the target qubit, and shown that the signal assumes a sinusoidal behavior with r whose frequency depend on φk [43]. We have instead, started from the initial Iz0 |00ih00| state and inferred the result of counting from the spectrum of observer qubit. For a two qubit case only one Grover’s iteration is sufficient to get the result [43]. Given in Table 1 are the count k, their corresponding φ, the Uf operators and final state of the system for r = 1. Note that for k = 0, the final state is |ψf i = |00i and for k = N = 2 the final state is |ψf i = |10i. For k = 1 the output states are in entangled form of all the states, |00i, |01i, |10i and |11i.
Starting with the initial state of Iz0 |00ih00|, we implemented the quantum circuit of figure 4(b). The
controlled controlled U0 and controlled Uf01 have the same operator as that of two-qubit controlled phase gate U10 implemented in Grover’s algorithm (section II), whose corresponding pulse sequence is given in Eq. [11]. Uf10 has the same operator and pulse sequence as that of U11 in Eq. [11]. Uf11 is an identity operator and required no pulses. Uf00 required a (π)1z rotation. This (π)1z rotation was implemented with hard pulses and evolution under Zeeman Hamiltonian, 1,2 1,2 (π)1z = (1/4ν) − [(π/2)1,2 −y (π/2)x (π/2)y ].
(15)
During the delay (1/4ν) the system evolves under the Zeeman Hamiltonian to acquire a rotation of (π/2)1z (π/2)2−z . The subsequent composite z-pulse was applied on both qubits, (π/2)1,2 = z 1,2 1,2 (π/2)1,2 [(π/2)−y x (π/2)y ], which cancels the rotation of second qubit but adds to the rotation of first
8
qubit to give an effective (π/2)1z rotation. It may be noticed that there are two pseudo-Hadamard gates on second qubit which require spin-selective pulses since h=(π/2)y and h−1 =(π/2)−y . However, these pulses can also be performed by hard pulses and evolution under Zeeman Hamiltonian using the ”jump-and-return” logic [43]. 1,2 1,2 (π/2)2y = (π/2)1,2 x − (1/8ν) − (π/2)−x (π/4)y , 1,2 1,2 (π/2)2−y = (π/2)1,2 −x − (1/8ν) − (π/2)x (π/4)−y .
(16)
After implementing the quantum circuit of figure 3(b), the observer qubit was measured. The observer qubit’s spectrum given in figure 6(a), shows four lines for k = 1 (f01 and f10 ). For k = 0 (f00 ), only |00i transition and for k = 2 (f11 ), only |10i transition is observed. The 2D-spectrum of figure 6(b) contains correlation of the output state with the initial |00i pseudopure state, and confirms the same result. V. BERSTEIN-VAZIRANI PROBLEM
Berstein and Vazirani considered the problem of determining a n-bit string “a” [8]. Classically each query would yield one bit of information and hence would require n-queries to the database. However, Berstein and Vazirani showed that a quantum algorithm can solve the problem with one quantum query [8]. For this purpose, the oracle has to compute a function fa (x) = a.x . The scheme proposed by Berstein and Vazirani required an ancillary qubit and determined a n-qubit string with n+1 qubits, which has been demonstrated by NMR recently [36]. However, Du and his co-workers had simplified the scheme such that the ancillary qubit was not required [46]. We have implemented the Du-scheme, since it has the advantage of determining a n-qubit string with n-qubit system. The quantum circuit of a two-qubit implementation is given in figure 3(c). Starting from |0in , the Hadamard gates create an uniform superposition |ψ1 i =
1 2n/2
n −1 2X
x=0
|xi
(17)
The Ua operator transforms |xi → (−1)fa (x) |xi. The unitary operator Ua can be decomposed into direct products of single-qubit operations [46] Ua = U 1 ⊗ U 2 ⊗ ... ⊗ U n , 9
U i = I,
ai = 0
= σz , ai = 1 ! 1 0 , σz = I= 0 1
1
0
!
(18)
(−1)a.x |xi.
(19)
0 −1
Operation of Ua creates a new state |ψ2 i of the form, |ψ2 i = Ua |ψ1 i =
1 2n/2
n −1 2X
x=0
The final state after the subsequent Hadamard operation is n −1 2n −1 X 1 2X (−1)a.x (−1)x.y |yi |ψ3 i = H|ψ2 i = n 2 x=0 x=0
However, since
P2n −1 x=0
(20)
(−1)a.x (−1)x.y = δa,y [2], |ψ3 i = |ai [8,43].
The algorithm was implemented to determine a two-qubit string by “spectral implementation” using three qubit system of 4-fluro 7-nitro benzofuran. After creating POPS, followed by Hadamard pulses, the operator Ua was applied for |ai = |00i, |01i, |10i and |11i. U00 is unity operator and
does not require any pulse. U10 is σz1 , which requires a (π)1z rotation. Once again, the (π)1z rotation was implemented using the pulse sequence of Eq.[15]. Similarly, U01 was implemented by 1,2 1,2 1,2 1,2 (π)2z = (π)1,2 x (1/4ν)(π)x − [(π/2)−y (π/2)x (π/2)y ].
(21)
1,2 1,2 1,2 U11 is σz1 σz2 , which can be achieved by a composite z-pulse of (π)1,2 z = (π/2)−y (π)x (π/2)y . After
application of the final Hadamard pulses, the observer qubit was detection by a (π/2) pulse. The obtained spectrum given in figure 7(a), clearly determines the 2-bit string in each case. The result of 2D experiment is given in figure 7(b). The 2D spectrum correlates the input |00i to the output in each case. The above algorithm was also implemented to determine a three-qubit string by “spectral implementation” using a four-qubit system. The molecule 2-3 diflouro 6-nitrophenol (dissolved in CDCl3 +1 drop D2 O) has 4 weakly coupled spin-1/2 nuclei. The proton of the phenol group is exchanged with the D2 O. The two remaining protons and the two fluorine nuclei constitute the four-qubit system. The equilibrium spectrum of each nucleus is given in Fig. 8 (a). In a 500 MHz NMR spectrometer, the chemical shift difference between the two Fluorine spins is 16 kHz while that between the two protons is 560 Hz. The couplings range from 19.13 Hz to -2.4 Hz. 10
The operators and pulse sequences required for each string of a three qubit system is given in Table 2. Since the chemical shift difference between the two fluorine spins are considerably large (16kHz), selective pulses do not introduce significant errors. The pulses on fluorine spin I 3 were achieved by Gaussian shaped selective pulses of 12.5µs duration. The proton transmitter frequency was kept at the middle of the spectrum and the selective z-pulses on protons were applied in similar logic as in the two-qubit case (Eq. [15] and [21]). Hard pulses were applied when both protons had to be pulsed simultaneously. The algorithm was implemented starting from the initial state of Iz0 |000ih000| (figure 8(b)) and finally the observed qubit was measured by selective Gaussian shaped (π/2)y pulse. The only transition present in each spectrum given in figure 9(a) indicates the corresponding string. The 2D experimental spectra given in figure 9(b) verify the same results, correlating the input state of |000i in each case. VI. HOGG’S ALGORITHM
Satisfiability (SAT) problem is one of the nondeterministic polynomial (NP) combinatorial search problems [7]. SAT problem consists of a logical formula in n variables, V1 , V2 , ..., Vn [7]. One has to find an assigment (true or false) for each variable Vi , such that it makes the formula true. The logical formula can be expressed in various equivalent forms, as conjunction of clauses, where a clause in a disjunction of some variables. A clause with k variables is false for exactly one set of values for its variables but true for the other 2k − 1 sets. An example of clause for k=3 is V1 OR V2 OR V3 , where the clause is f alse for only V1 = V2 = V3 = f alse. Only the assignments which satisfy all the clauses are considered as solutions [7]. While the number of steps required by a classical algorithm increase linearly with the size of the variables [7], Hogg’s algorithm can solve 1-SAT and maximally constrained k-SAT problems in a single step, whatever be the size of the variable [7]. Hogg’s algorithm has been succesfully implemented by NMR in a three qubit system [45]. Here we demonstrate Hogg’s algorithm by “spectral implementation”. The Hogg’s algorithm starts by creating a uniform superposition of states by initializing from |ψ0 i = |0i⊗n and applying Hadamard gate on all qubits |ψ1 i = H ⊗n |ψ0 i = 2−n/2
P
s
|si. Let m be the number of clauses in the 1-SAT logical formula. Then the unitary
operations UR are consecutively applied to yield the final state |ψf i = UR|ψ1 i where U and R 11
defined as follows. R adjusts the phases of |si depending on the conflicts c of the different assignments in the superposition of s, ranging from 0 to m. R is a diagonal matrix of the form √ Rss = 2cos[(2c − 1)π/4], for even m = ic
for odd m
(22)
The operator U mixes the amplitudes from different assignments with elements Urs , depending the Hamming distance d between r and s. U is of the form Urs = Ud(r,s) = 2−(n−1)/2 cos[(n − m + 1 − 2d)π/4] = 2−n/2 eiπ(n−m)/4 (−i)d
for even m for odd m
(23)
where d = |r| + |s| − |r ∧ s| is the Hamming distance between r and s, i.e. number of positions at which their values differ. U can be decomposed into HΓH where H is the Hadamard matrix and Γ is a diagonal matrix of the form Γrr = γ(r) = γh =
√
2cos[(m − 2h − 1)π/4]
= ih e−iπm/4
for even m for odd m
(24)
where h = |r|, and hence Γrr depend on the number of 1-bits in each assignment. For a detailed description of the working of the algorithm see ref [7]. Hence the Hogg’s quantum starts with the initial |00i state and reaches the desired output state |ψf i by |ψf i = URH|00i
(25)
and the final step is to measure the output state |ψf i. We have observed the final state through detection of the observer qubit. The quantum circuit of Hogg’s algorithm for a three-qubit system is given in figure 3(d). While implementing the corresponding pulse sequence, the consecutive pulses of opposite phases cancel out, yielding a simplified sequence [45]. The m = 1 and 3 clauses, their logic formulae and the reduced pulse sequences are given in table 3 [45]. Only the m=1 and 3 cases are demonstrated here for ease of implementation. The selective pulses on fluorine spin were achieved using Gaussian shaped pulses. In protons, the selective pulses were achieved by hard pulses concatenated with Zeeman evolution (Eq. [10], [11] and [16]). For example, while implementing V1 , 12
1,2 1,2 V1 : [(π)1x ][(π/2)2y ][(π/2)3y ] = [(π/2)1,2 −y − 1/4ν − (π/2)y (π/2)x ] 1,2 1,2 3 [(π/2)1,2 −x − 1/8ν − (π/2)x (π/4)y ][(π/2)y ] 1,2 1,2 1,2 3 = [(π/2)1,2 −y − 1/4ν − (π/2)y − 1/8ν − (π/2)x (π/4)y ][(π/2)y ]
(26)
The spectra obtained by the one-dimensional experiment is given in figure 10 while the spectra obtained in 2D-experiment is given in figure 11. The spectra of observer qubit clearly identifies the desired outputs of table 3. For example, in the case of V1 , the output has all the states that satisfy the condition that 1st qubit is |1i or f alse; namely |001i, |011i, |101i and |111i (read the order of qubits from right to left). Similarly, for V3 ∧ V2 ∧ V1 , the output consists of the sole answer |111i, which satisfies the condition that all the qubits are in state |1i. VII. CONCLUSION
We have demonstrated “spectral implementation” of several quantum algorithms by one- and two-dimensional NMR. Provided future quantum computers run with high fidelity, “spectral implementation” delivers an aphoristic method of readout. Though it requires the use of an observer qubit, this qubit also helps in creating a pseudopure state by non-scalable and effective methods like POPS [38]. With the essentiality that the observer qubit has resolved spectrum, the principle of “spectral implementation” is applicable to higher qubit systems without increasing complexity. VIII. ACKNOWLEDGMENT
Useful discussions with Prof. G. S. Agarwal are gratefully acknowledged. The use of DRX-500 NMR spectrometer funded by the Department of Science and Technology (DST), New Delhi, at the Sophisticated Instruments Facility, Indian Institute of Science, Bangalore, is also gratefully acknowledged. AK acknowledges ”DAE-BRNS” for the award of ”Senior Scientists scheme” and DST for a research grant for ”Quantum Computing by NMR”.
[1] R.P. Feynman, Int J. Theor. Phys. 21, (1982) 467.
13
[2] J.
Preskill,
Lecture
notes
for
Physics
229:
Quantum
information
and
Computation,
http://theory.caltech.edu/people/preskill/. [3] S. Lloyd, Science 273, 1073 (1996). [4] D. Deutsch and R. Jozsa, Proc. R. Soc. Lond. A 400, 97 (1985). [5] L.K. Grover, Phys. Rev. Lett. 79, (1997) 325. [6] P.W.Shor, SIAM Rev. 41, 303-332 (1999). [7] T. Hogg. Phys. Rev. Lett. 80, 2473 (1998). [8] E. Berstein and U. Vazirani, SIAM J. Computin. 26, 1411 (1997). [9] M. Boyer, G. Brassard, P. Hoyer, and A. Tapp. Fortschr. Phys. 46, 493 (1998). [10] G. Brassard, P Hoyer and A. Tapp, in Automata, Languages, and Programming: Proceedings of the 25th International Colloquium, ICALP’98, Aalborg, Denmark, 1998 (Springer, Berlin, 197); quant-ph/9805082. [11] D. Bouwmeester, A. Ekert and A. Zeilinger, (Ed) The Physics of Quantum Information, Springer, 2000. [12] M.A. Nielsen and I.L. Chuang, Quantum Computation and Quantum Information, Cambridge University Press 2000. [13] D. G. Cory, A.F. Fahmy and T.F. Havel, Proc.Natl.Acad.Sci. USA 94, 1634 (1997). [14] N. Gershenfeld and I.L. Chuang, Science 275, 350 (1997). [15] D. G. Cory, M. D. Price and T.F. Havel, Physica D, 120, 82 (1998). [16] I. L.Chuang, L. M. K. Vanderspyen, X. Zhou, D.W. Leung, and S. Llyod, Nature (London) 393, 1443 (1998). [17] J. A. Jones and M. Mosca, J. Chem. Phys. 109, 1648 (1998). [18] I. L. Chuang, N. Gershenfeld, and M. Kubinec, Phys. Rev. Lett. 80, 3408-3411 (1998). [19] J. A. Jones, M. Mosca and R. H. Hansen, Nature 393 344 (1998). [20] Kavita Dorai, T. S. Mahesh, Arvind and Anil Kumar, Current Science, 79 (10) 1447 (2000). [21] Kavita Dorai, Arvind, Anil Kumar, Phys Rev A. 61, 042306 (2000). [22] N. Sinha, T.S. Mahesh, K.V. Ramanathan and Anil Kumar, J. Chem. Phys. 114, 4415 (2001). [23] Arvind, K. Dorai and Anil Kumar, Pramana 56 7705 (2001). [24] L.M.K. Vanderspyen, Matthias Steffen, Gregory Breyta, C.S.Yannoni, M.H. Sherwood and I.L. Chuang, Nature 414, 883 (2001). [25] Anil Kumar, K. V. Ramanathan, T. S. Mahesh, N. Sinha and K.V.R.M. Murali, Pramana 59 243 (2002).
14
[26] Ranabir Das and Anil Kumar, Phys. Rev. A. 68, 032304 (2003). [27] Ranabir Das, A. Mitra, S. Vijaykumar and Anil Kumar Int. Jour. of Quant. Infor. 1(3) 387 (2003). [28] Ranabir Das, Sukhendu Chakraborty, K. Rukmani and Anil Kumar, Phys. Rev. A. (in press). [29] J. A. Jones, chapter 5, page 181 of reference [11]. [30] I.L. Chuang, N. Greshenfeld, M.Kubinec, and D. Leung, Proc. R. Soc. Lond. A 454, 447 (1998). [31] Ranabir Das, T.S. Mahesh and Anil Kumar, Phys. Rev. A. 67, 062304 (2003). [32] Garett M. Leskowitz and Leonard J. Mueller, Phys. Rev. A. 69052302 (2004). [33] Z.L. Madi, R. Bruschweiler and R.R. Ernst, J. Chem. Phys. 109, 10603 (1998). [34] T. S. Mahesh, Kavita Dorai, Arvind, Anil Kumar, J. Mag. Res. 148, 95 (2001). [35] X. Peng, X. Zhu, X. Fang, M. Feng, X. Yang, M. Liu, and K. Gao, quant-ph/0202010. [36] X. Peng, X. Zhu, X. Fang, M. Feng, M. Liu, and K. Gao, J. Chem. Phys. 120, 3579 (2004). [37] R.R. Ersnt, G. Bodenhausen, and A. Wokaun, Principles of Nuclear Magnetic Resonance in One and Two Dimensions, Oxford university press 1987. [38] B. M. Fung, Phys. Rev. A 63, 022304 (2001). [39] Vladimir L. Ermakov and B. M. Fung, J. Chem. Phys. 118, 10376 (2003). [40] E. Knill, R. Laflamme, R. Martinez, and C.-H. Tseng, Nature (London) 404, 368 (2000). [41] R. Freeman, T.A. Frenkiel and M.H. Levitt, J. Mag. Res.44, 409(1981). [42] P. Plateau and M. Guron, J. Am. Chem. Soc. 104, 7310 (1982). [43] J. A. Jones amd M. Mosca, Phys. Rev. Lett. 83 1050 (1999). [44] H. K. Cummins C. Jones A. Furze, N. F. Soffe, M. Mosca, J. M. Peach and J. A. Jones, Phys. Rev. Lett 88 187901 (2002). [45] X. Peng, X. Zhu, X. Fang, M. Feng, M. Liu, and K. Gao, Phys. Rev. A. 65 042315 (2002). [46] J. Du, M. Shi, X. Zhou, Y. Fan, B. Ye, and R. Han, Phys. Rev. A. 64 042306 (2001).
15
Table 1 :The various possible the count k for a two-qubit system, their corresponding φ, the Uf operators and final state of the system |ψoutput i. k
0
φk
0
Uf00 =
Uf 1 0 0 1
0 0
1
π/2
Uf01 =
0 0
1 0
0
0 1
0
0
0
0 0 0
0
0
0 0 1 1 0 0 0
1
2
π/2
π
Uf10 =
Uf11 =
0
|00i
−1 0
0 −1 0
0
0
0 −1
0 1 0
1
0
0 0
|ψoutput i
|00i − |01i + |10i + |11i
|00i + |01i + |10i − |11i
0 0 −1 1 0 0 0
0 0
1 0 0 0 1 0
0 0 0 1
|10i
16
Table 2: The operators and pulse sequences required for determination of each string in a three qubit system string
Operator
Pulse sequence
|000i
I
no pulse
σz3
(π)3z
σz2
(π)2z
σz2 σz3
(π)2z (π)3z
σz1
(π)1z
σz1 σz3
(π)1z (π)3z
σz1 σz2
(π)1,2 z
σz1 σz2 σz3
3 (π)1,2 z (π)z
|001i |010i |011i |100i |101i |110i |111i
17
Table 3: Logic formulae for m=1 or m=3 in a 3-qubit system, corresponding pulse sequences, and theoritical solutions [45]. Read the order of qubits from right to left. m
1
3
Logic formula
Reduced pulse sequence
V1 V¯1
(π)1x (π/2)2y (π/2)3y (π/2)2y (π/2)3y
V2
(π/2)1y (π)2x (π/2)3y
V¯2
(π/2)1y (π/2)3y
V3 V¯3
(π/2)1y (π/2)2y (π)3x
V3 ∧ V2 ∧ V1 V3 ∧ V2 ∧ V¯1
1,2,3 (π/2)1,2,3 (π/2)1,2,3 −y (π/2)x x
V3 ∧ V¯2 ∧ V1 V3 ∧ V¯2 ∧ V¯1 V¯3 ∧ V2 ∧ V1
V¯3 ∧ V2 ∧ V¯1 V¯3 ∧ V¯2 ∧ V1
V¯3 ∧ V¯2 ∧ V¯1
(π/2)1y (π/2)2y 1,2,3 1,2,3 (π/2)1−x (π/2)2,3 x (π/2)−y (π/2)x 1,2,3 2 1,2,3 (π/2)1,3 x (π/2)−x (π/2)−y (π/2)x 1,2,3 3 1,2,3 (π/2)1,2 −x (π/2)x (π/2)−y (π/2)x 1,2,3 3 1,2,3 (π/2)1,2 x (π/2)−x (π/2)−y (π/2)x 1,2,3 2 1,2,3 (π/2)1,3 −x (π/2)x (π/2)−y (π/2)x 1,2,3 1,2,3 (π/2)1x (π/2)2,3 −x (π/2)−y (π/2)x 1,2,3 1,2,3 (π/2)1,2,3 −x (π/2)−y (π/2)x
18
Final state |ψf i |001i + |011i + |101i + |111i |000i + |010i + |100i + |110i |010i + |011i + |110i + |111i |000i + |001i + |100i + |101i |100i + |101i + |110i + |111i |000i + |001i + |010i + |011i |111i |110i |101i |100i |011i |010i |001i |000i
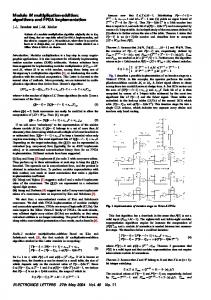
Figure Captions Figure 1. Experimental protocol for “spectral implementation” of quantum algorothms [33]. (a) One-dimensional experiment. The first stage is to create an subsystem pseudopure state of the type Iz0 I01 I02 ..I0N , followed by computation on I 1 ..I N qubits. Finally the transitions of the observer qubit I 0 are detected by a 90oy pulse. (b) Two-dimensional experiment. After the creation of initial Iz0 I01 I02 ..I0N subsystem PPS, the observer qubit is flipped by 90oy pulse to transverse magnetization and allowed to evolve for a time t1 . During t1 , the transitions of the observer qubit modulate with the frequencies characterized by the input state of the other N qubits. A subsequent 90o−y brings the magnetization back to longitudinal direction. The computation is performed on the I 1 ..I N qubits. The transitions of the observer qubit are finally detected by a 90oy pulse. A series of experiments are performed with systematic increment of the t1 period and the collected 2D data set s(t1 , t2 ) is Fourier transformed to get the 2D spectrum S(ω1 , ω2 ). Figure 2. Schematic diagram of the energy levels and the spectrum of the observer qubit at different stages of “spectral implementation”. (a) Deviation equlibrium populations. The dotted arrows denote the transitions of observer qubit. (b) Equilibrium spectrum of observer qubit shown by stick diagram. Each transition of the spectrum correspond to the state of other qubits, which are given above each line. (c) Deviation populations after creation of |00i subsystem pseudopure state by POPS. Populations of only |00i eigenstate is non-zero in the two distinct domains of energy levels, where observer qubit is respectively in state |0i and |1i. (d) Spectrum of observer qubit after creation of POPS. The dots denote null intensity. (e) Deviation populations after a typical computation whose output is |11i. (f) Spectrum of observer qubit after such a computation. Figure 3. The quantum circuits of various algorithms. (a) Quantum circuit for implementation of Grover’s search algorithm in a 2-qubit system. (b) Quantum circuit for implementation of approximate quantum counting in a 2-qubit system. (c) Quantum circuit for implementation of Berstein-Vazirani problem. (d) Quantum circuit for implementation of Hogg’s algorithm in a 3-qubit system. Figure 4. (a) Chemical structure and equilibrium spectrum of 4-fluro 7-nitro benzofuran. The J-coupling values are J01 = -3.84 Hz, J02 =8.01 Hz and J12 = 8.07 Hz. The peak denoted by asterisk (*) belongs to solvent. (b) Spectra after creation of POPS. A Gaussian shaped selective pulse of 500ms duration was applied on the |000i ↔ |100i transition and the resultant spectra is subtracted 19
from the equlibrium spectra of figure (a) to yield (b). [See figure 2(c)] Figure 5. (a) “Spectral implementation” of Grover’s search algorithm by 1D experiment. After computation, the observer qubit is detected by a non-selective pulse of 14 µs. 4×1024 data points were collected and zero-filled to 8×1024 before Fourier transform. The observer qubit’s spectra shows only the transition corresponding to the searched state (|xi) with non-zero intensity. (b) “spectral implementation” of Grover’s search algorithm by 2D experiment. A 2D data set of 256×16 (t2 × t1 )was collected and zero-filled to 1024×256. It may be noticed that the total size of the raw 2D dataset is of the same size as that of the 1D experiment. The doubly Fourier transformed spectra gives the input state along ω1 and output state along ω2 . Figure 6. (a) “Spectral implementation” of approximate quantum counting by 1D experiment. 4×1024 data points were collected and zero-filled to 8×1024 before Fourier transform. The observer qubit’s spectra show the transitions corresponding to the ouput state. Hence the various cases of k=0 (f00 ), k=1 (f01 and f01 ), and k=2 (f11 ) can be easily identified from the spectra. (b) “spectral implementation” of approximate quantum counting by 2D experiment. A 2D data set of 256×16 (t2 × t1 ) was collected and zero-filled to 1024×256. The Fourier transformed spectra gives the output state as well as the input state. Figure 7. (a) “Spectral implementation” of Berstein-Vazirani problem in a 2-qubit system. The observer qubit’s spectra shows the transitions corresponding to the bit string. The strings a = 00, a = 01, a = 10 and a = 11 can be identified directly from the spectra. (b) 2D “spectral implementation” of Berstein-Vazirani problem. A 2D data set of 256×16 (t2 × t1 )was collected and zero-filled to 1024×256 before Fourier transform. The Fourier transformed spectra gives the bit string against the input state in each case. Figure 8. (a) Chemical structure and equilibrium spectrum of 4-fluro 7-nitro benzofuran. The J-coupling values are J01 = 5.23 Hz, J02 = 8.85 Hz, J03 = 19.1 Hz, J12 = 9.76 Hz, J13 = -2.4 Hz and J23 = 6.81 Hz. (b) Spectra after creation of POPS. A Gaussian shaped selective pulse of 500ms duration was applied on the |0000i ↔ |1000i transition and the resultant spectra is subtracted from the equlibrium spectra of figure (a) to yield (b). Figure 9. (a) “Spectral implementation” of Berstein-Vazirani problem in a 3-qubit system. After computation, the observer qubit is detected by a selective pulse of 12.5us duration. The observer qubit’s spectra show the transitions corresponding to the bit string. The eight possible strings of a = 20
000, a = 001...a = 111 can be identified directly from the spectra. (b) 2D “spectral implementation” of Berstein-Vazirani problem in the three-qubit case. A 2D data set of 256×24 (t2 × t1 ) was collected and zero-filled to 1024×256 before Fourier transform. The Fourier transformed spectra give the various bit strings along with the input state in each case. Figure 10. One-dimensional “spectral implementation” of Hogg’s algorithm in a 3-qubit system. After computation, the observer qubit is detected by a selective pulse of 12.5 µs duration. The observer qubits spectra clearly show the output states corresponding to various logical formulae of table 3. (a) contains the spectra corresponding to m=1 and (b) to m=3. Figure 11. Two-dimensional “spectral implementation” of Hogg’s algorithm in a 3-qubit system. The two-dimensional spectra provides the output states corresponding to various logical formulae of table 3. (a) contains the spectra corresponding to m=1 and (b) to m=3.
(a)
Creation of sub−system PPS
Reading of Output states
Computation o
90 y
I0 Computation
I 1 ..I N
Creation of sub−system PPS
(b)
Labeling of states o
o
90 y
o
90 −y
90 y
t1
t2
I0 Computation
1
I ..I
Reading of Output states
Computation
N
21
Figure 1
22
1
011 2
1
010
10
110
2
2
001
1 01
101
10
01
111
11
11
(b)
0
00
(a)
00
100
3
000
10 10
010
11
101
0 01
110
−1
0
001
11
0
00
011
0 10
00
111
11
0
01
(d)
0
01
(c)
00
100
1
000 (e)
(f)
−1 11
1
011 0
0 10
101
0
001
111
010
01
0
110
0 00
100
0
000
Figure 2
23
Grover’s search algorithm
0
H
H
H
Ux 0
U00
H
H
H
Approximate quantum counting
0
H
0
H
H
Uf
h−1
U0
H
h
Berstein−Vazirani problem
0
H
H
Ua 0
H
H
24
(d) Hogg’s algorithm
0
H
0
H
0
H
U
R
Figure 3 (a)
I2
H
NO
I1 H F I0
I0
N O N
I2
I1
0
Hz
−330
−320
Hz
0
Hz
−330
−320
Hz
320
*
330
Hz
(b)
320
25
330
Hz
Figure 4
26
x
x
=|00 01
(a)
5
x
00
11
0
−5
00
11
0
−5
−10
01
Hz
5
x
=|10 01
5
=|01
10
01
Hz
5
(b)
27
11
0
−5
00
11
0
−5
10
−10
Hz
=|11
10
−10
00
10
−10
Hz
x
=|00
x
OUTPUT 01
00
11
=|01
10
OUTPUT 01
00
11
10
Hz
Hz 10
−5
11 00
0
ω1
01 5
0
−5
Hz
x
OUTPUT 00
11
−5
11 00
0
ω1
01
5
01
ω2 =|11
10
5 5
0
−5
00
11
10 Hz
10
INPUT (PPS)
10 −5
11 00
0
ω1
01
ω2
Hz
OUTPUT 01
Hz
INPUT (PPS)
x
ω2 =|10
INPUT (PPS)
INPUT (PPS)
10
0
−5
00
0
ω1
01
5 5
−5
11
ω2
Hz
Figure 5
28
5 5
0
−5
Hz
(a)
f00
01
5
f10
01
5
00
11
0
−5
00
11
0
−5
f01
10
−10
Hz
5
f11
10
−10
01
Hz
01
5
(b)
29
00
11
0
−5
00
11
0
−5
10
−10
Hz
10
−10
Hz
f 00
f 01
OUTPUT 01
00
11
10
OUTPUT 01
00
11
10
Hz
Hz 10
−5
11 00
0
01 0
−5
00
11
00
Hz
0 5 5
f 11
OUTPUT 01
−5
11
01
5 5
f 10
INPUT (PPS)
INPUT (PPS)
10
10
0
−5
OUTPUT 01
00
11
Hz
10 Hz
10
INPUT (PPS)
10
INPUT (PPS)
Hz
−5
11 00
0
01 0
−5
00
0
01
5 5
−5
11
Hz
5 5
Figure 6
30
0
−5
Hz
a
a
=|00 01
(a)
5
a
00
11
0
−5
00
11
0
−5
−10
01
Hz
5
a
=|10 01
5
=|01
10
01
Hz
5
(b)
31
11
0
−5
00
11
0
−5
10
−10
Hz
=|11
10
−10
00
10
−10
Hz
a
a
=|00
=|01
OUTPUT 01
00
11
OUTPUT 10
01
00
11
10
Hz
Hz 10
11
−5
00
0
INPUT (PPS)
INPUT (PPS)
10
01
11
−5
00
0
01 5 5
0
−5
Hz
5
a
=|10
0
01
00
11
−5
Hz
=|11
OUTPUT
OUTPUT 10
01
00
11
Hz
10 Hz
10
11
−5
00
0
INPUT (PPS)
10
INPUT (PPS)
a
5
01
11
−5
00
0
01 5 5
0
−5
5
Hz
5
Figure 7
32
0
−5
Hz
(a)
I0
OH
F
NO
I3 F H I2
I1
I0
20
H I1
I2
I3
0
Hz
270
280
Hz
−270
−280
Hz
−16
k Hz
0
Hz
270
280
Hz
−270
−280
Hz
−16
k Hz
(b)
20
Figure 8
33
34
Figure 9(a) 20
20
000
011
010 110
001
−10
−10
101
100
111
101 011
a = 000
0 001
0
110
10
010
000
a = 100
10
100
111
Hz 20
Hz 20
110
011
001
−10
−10
101
110
0
0 001
010
111
101
a = 001
100
010
10
000
100
a = 101
10
000
011 111
Hz 20
Hz 20 000
011
110
001
−10
−10
101
010
0
0 001
100
111
101 011
a = 010
110
10
010
000
a = 110
10
100
111
Hz 20
Hz 20 110
011
001
−10
−10
101
110
0
0 001
010
111
101 011 111
a = 011
100
010
10
000
100
a = 111
10
000
Hz
Hz
110
010
100
100
100
000
000
000 10
a
= 110
101
001 110
010
110
010
100 000
−10
Hz
111
011
101
110
010
100
0
001
001
000 10
111
000
111
011
101
010
001
100
Hz
= 111
101
000 −10
Hz
011
101
100
0
−10
111
000 10
0
OUTPUT
INPUT(PPS)
110
010
INPUT(PPS)
011
INPUT(PPS)
111
011
100
000
111
011
101
001
110
010
100
000
111
011
111
011
001
Hz
OUTPUT
111
101
−10
011
a
= 101
0
101
10
001
Hz
OUTPUT
101
001
110
010
100
−10
001
a
= 100
0
110
10
OUTPUT 000
35
Figure 9(b)
a
Hz
010
110
010
100
−10
110
001
000 0
100
000
111
011
101
001
010
001
101
110
110
010
011
101
010
110
010
001
111
100
001
101
= 011 OUTPUT
INPUT(PPS)
011
INPUT(PPS)
111
011
100
000
111
011
101
001
010
100
000
111
011
101
001
010
110
100
111
011 101
a
= 010 OUTPUT
111
10
INPUT(PPS)
a
= 001 OUTPUT
INPUT(PPS)
INPUT(PPS)
000
OUTPUT
110
a
= 000
110
a
10
0
−10
Hz
10
0
−10
Hz
36
Figure 10(a)
V1
V2 20
20
000 100
000 100
10
10
010 110
010 110
0
0
001 101
001 101
−10
−10
011 111
011 111
Hz
Hz
V1
V3 20
20
000 100
000 100
10
10
010 110
010 110
0
0
001 101
001 101
−10
−10
011 111
011 111
Hz
Hz
V2
V3 20
20
000 100
100
10
10
010 110
101
001 101
−10
−10
011
010 110
0
0
001
000
111
011 111
Hz
Hz
37
Figure 10(b) 20
20
000
101
001 101
−10
−10
011
110
0
0
001
010
111
011
V1^ V2^V3
110
000 100
10
10
010
V1^ V2^V3
100
111
Hz
Hz
20
20
000
101
001 101
−10
−10
011
110
0
0
001
010
111
011
V1^ V2^V3
110
000 100
10
10
010
V1^ V2^V3
100
111
Hz
Hz
20
20
000
101
001 101
−10
−10
011
110
0
0
001
010
111
011
V1^ V2^V3
110
000 100
10
10
010
V1^ V2^V3
100
111
Hz
Hz
20
20
000
101
001 101
−10
−10
011
110
0
0
001
010
111
011 111
V1^ V2^V3
110
000 100
10
10
010
V1^ V2^V3
100
Hz
Hz
INPUT(PPS)
Hz
110
010
10
100
000
20 10
0
−10
Hz
111
001
101 011
−10
Hz
111
OUTPUT
Hz
011
−10
101
001
0
110
010
10
100
000
20 10
0
−10
Hz
INPUT(PPS)
0
INPUT(PPS)
001
0
111
011
−10
101
110
10
V3
111
011
Hz
101 011
−10
OUTPUT 000
111
101 011
001
110
100
010
Hz
0
20
110
10
V3
111
000
001
Hz
10
000
−10
OUTPUT 000
38
Figure 11(a)
V2
0
010 100
20
100
10
0
110
010
000
20
010
000
111
101 011
110
001
100
110
000
10
010
100
010
001
100
10
0
110
−10
101
111
010
001
101 011
0
110
Hz
011
−10
101
001
001
OUTPUT
111
011
−10
101
INPUT(PPS)
INPUT(PPS)
Hz
111
011
INPUT(PPS)
010
000
111
101 011
001
110
010
100
000
Hz
111
V2
OUTPUT
100
V1
OUTPUT
100
V1
−10
101
001
0
110
010
10
100
000
20 10
0
−10
Hz
110
010
110
010 100
100
000
000
000
000
−10
Hz
20
10
0
−10
Hz
20
10
0
−10
Hz
20
10
0
001 110
010
101
001 110
010
100
100
100
000
000
−10
Hz
20
10
0
−10
Hz
101
001
110
010
000 0
110
001
100
10
010
101
000 20
100
000
111
011
101
001
110
011
INPUT(PPS)
110
010
101
Hz
111
011
INPUT(PPS)
001
010
111
011
INPUT(PPS)
011 101
100
000
111
011
101
001
110
010
100
000
111
OUTPUT
011
OUTPUT
101
OUTPUT
001
OUTPUT 110
V1^ V2^V3
100
V1^ V2^V3
000
Figure 11(b)
39
V1^ V2^V3
111
111
−10
V1^ V2^V3
111
011
101
001
010
110
010
100
0
110
001
100
10
100
000
111
011
101
001
010
110
001
101
111
110
010
001
011
101
011
001
101
111
INPUT(PPS)
101
INPUT(PPS)
011
100
000
111
011
101
001
010
110
111
011
20
INPUT(PPS)
100
000
111
011
INPUT(PPS)
111
010
INPUT(PPS)
111
OUTPUT
011
OUTPUT
101
OUTPUT
001
OUTPUT 010
V1^ V2^V3
110
V1^ V2^V3
100
V1^ V2^V3
000
V1^ V2^V3
20
10
0
−10
Hz
20
10
0
−10
Hz