J. Europ. Opt. Soc. Rap. Public. 7, 12017 (2012)
www.jeos.org
Spectral interferometry-based chromatic dispersion measurement of fibre including the zero-dispersion wavelength P. Hlubina
[email protected]
Department of Physics, Technical University Ostrava, 17. listopadu 15, 708 33 Ostrava-Poruba, Czech Republic
M. Kadulov´a
Department of Physics, Technical University Ostrava, 17. listopadu 15, 708 33 Ostrava-Poruba, Czech Republic
D. Ciprian
Department of Physics, Technical University Ostrava, 17. listopadu 15, 708 33 Ostrava-Poruba, Czech Republic
We report on a simple spectral interferometric technique for chromatic dispersion measurement of a short length optical fibre including the zero-dispersion wavelength. The method utilizes a supercontinuum source, a dispersion balanced Mach-Zehnder interferometer and a fibre under test of known length inserted in one of the interferometer arms and the other arm with adjustable path length. The method is based on resolving one spectral interferogram (spectral fringes) by a low-resolution NIR spectrometer. The fringe order versus the precise wavelength position of the interference extreme in the recorded spectral signal is fitted to the approximate function from which the chromatic dispersion is obtained. We verify the applicability of the method by measuring the chromatic dispersion of two polarization modes in a birefringent holey fibre. The measurement results are compared with those obtained by a broad spectral range (500–1600 nm) measurement method, and good agreement is confirmed. [DOI: http://dx.doi.org/10.2971/jeos.2012.12017] Keywords: spectral interferometry, Mach-Zehnder interferometer, holey fibre, chromatic dispersion, zero-dispersion wavelength
1 INTRODUCTION The chromatic dispersion, which is a significant characteristic of optical fibre, affects the bandwidth of a high speed optical transmission system through pulse broadening and nonlinear optical distortion. Chromatic dispersion of long length optical fibres is determined by two widely used methods [1]: the time-of-flight method which measures relative temporal delays for pulses at different wavelengths, and the modulation phase shift technique which measures the phase delay of a modulated signal as a function of wavelength. Recently, a rapid and accurate spectral interferometry-based measurement method using an asymmetric Sagnac interferometer has been presented [2]. White-light interferometry based on the use of a broadband source in combination with a standard Michelson or a MachZehnder interferometer [3] is considered as one of the best tools for dispersion characterization of short length optical fibres. White-light interferometry usually utilizes a temporal method [4] or a spectral method [5]–[13]. The spectral method is based on the observation of spectral fringes in the vicinity of a stationary-phase point [5]–[12] or far from it [13]. The feasibility of the interferometric techniques has been demonstrated in measuring the dispersion of holey fibres [14]–[16] usable for supercontinuum generation [17]. However, an accurate control of the chromatic dispersion is required for the application [18]. As an example, a highly-birefringent holey fibre [19] has been designed and fabricated with the zero-dispersion wavelength (ZDW) close to a 1064 nm of a microchip laser, enabling
Received March 14, 2012; revised ms. received April 23, 2012; published May 30, 2012
savings in size and cost of a supercontinuum source. Moreover, these broadband and high-power sources have enabled to increase the comfort of dispersion measurement [16]. In this paper, a simple technique, based on spectral interferometry and employing a NIR low-resolution spectrometer, is used for chromatic dispersion measurement of a short length optical fibre including the ZDW. The method utilizes a supercontinuum source, a dispersion balanced Mach-Zehnder interferometer and a fibre under test of known length placed in one arm of the interferometer while the other arm has adjustable path length. The method is based on resolving one spectral interferogram from which the fringe order versus the precise wavelength position of the interference extreme is obtained [20]. This dependence is fitted to the approximate function enabling to obtain the chromatic dispersion. We verify the applicability of the method by measuring the chromatic dispersion of two polarization modes in a birefringent holey fibre. Good agreement between the measurement results and those obtained by a broad spectral range (500–1600 nm) measurement method is confirmed.
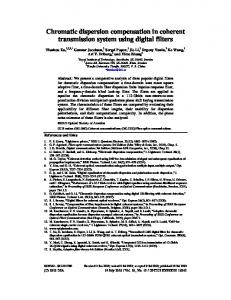
2 EXPERIMENTAL METHOD Consider a dispersion balanced Mach-Zehnder interferometer (see Figure 1) and a fibre under test of length z that supports two polarization modes over a broad wavelength range. The ISSN 1990-2573
J. Europ. Opt. Soc. Rap. Public. 7, 12017 (2012)
ESMF
P. Hlubina, et.al
BS1 FUT
C
MO1
P
where a1 = − A1 z, a2 = − A2 z, a3 = L − l − A3 z, a4 = − A4 z, and a5 = − A5 z. By a least-squares fitting of Eq. (7), the constants ai and m are determined, and knowing the fibre length z, the wavelength dependence of the group effective index Nx (λ) can be deduced from Eqs. (2) and (6). The chromatic dispersion Dx (λ) can be evaluated as
M1
SCS AL1
M3 M2 Spectral fringes
BS2
M4
Ap A
MO2 AL2
1 dNx (λ) c dλ 1 = (−20A1 λ−5 − 6A2 λ−3 − 2A4 λ − 12A5 λ3 ), c
MO3
Dx (λ) = FIG. 1 Experimental set-up for measuring the chromatic dispersion of a fibre under test.
fibre, which is characterized by the effective indices n x (λ) and ny (λ), is inserted into the first (test) arm of the interferometer and the other (reference) arm has the adjustable path length L in the air. If the analyser at the output interferometer discriminates the x polarization only, the optical path difference (OPD) ∆MZ (λ) between the beams in the interferometer is given by ∆MZ (λ) = L − l − n x (λ)z,
(1)
where l is the path length in the air in the test arm. The group g OPD ∆MZ (λ) is similar to Eq. (1), in which n x (λ) is replaced by the group effective index Nx (λ) given by the relation Nx (λ) = n x (λ) − λ
dn x (λ) . dλ
(2)
Next, consider that the spectral interference fringes can be resolved by a spectrometer used at the output of the MachZehnder interferometer. The spectral signal (interference fringes) recorded by the spectrometer of a Gaussian response function can be expressed as [12] g
SMZ (λ) =1 + V exp{−(π 2 /2)[∆MZ (λ)∆λR /λ2 ]2 }
× cos[(2π/λ)∆MZ (λ)],
(3)
where V is a visibility term and ∆λR is the width of the spectrometer response function. To resolve spectral fringes in a spectral range from λ1 to g λ2 , the group OPD ∆MZ (λ) must satisfy the condition g ∆MZ (λ) < λ21 /∆λR . We can resolve in the recorded spectral interferogram a suitable number of spectral fringes. The interference maximum (a bright fringe) satisfies the relation L − l − n x (λ)z = mλ,
(4)
where m is the order of interference of the fringes. After counting i bright spectral fringes in the direction of shorter wavelengths, Eq. (4) can be written as
[ L − l − n x (λ)z]/λ = m + i.
(5)
The wavelength dependence of the effective index n x (λ) can be well approximated by a modified Cauchy dispersion formula [21] n x ( λ ) = A 1 λ −4 + A 2 λ −2 + A 3 + A 4 λ 2 + A 5 λ 4 ,
(6)
where Ai are the coefficients. On substituting from Eq. (5) into Eq. (6), we obtain a1 λ−5 + a2 λ−3 + a3 λ−1 + a4 λ + a5 λ3 = m + i,
(7)
(8)
where c is the velocity of light in vacuum. The ZDW λ0x is given by Dx (λ0x ) = 0. Similarly, the dispersion slope Sx (λ) = dNx (λ)/dλ and its value Sx (λ0x ) at the ZDW λ0x can be determined. If the analyser at the output of the interferometer discriminates the y polarization only, the chromatic disy y persion Dy (λ), the ZDW λ0 given by Dy (λ0 ) = 0 and the disy persion slope Sy (λ0 ) of the y-polarization mode can also be measured. The method can also be applied for fibres with two ZDWs provided that a sufficient number of spectral fringes can be resolved in a measured spectral range. In addition, the degree of Laurent polynomial (a modified Cauchy dispersion formula) used in the data evaluation has to be chosen with respect to this fact.
3 EXPERIMENTAL CONFIGURATION The set-up for spectral interferometry-based measurement of the chromatic dispersion of the polarization modes supported by a fibre under test, including the ZDW, is shown in Figure 1. It consists of supercontinuum source SCS (SC450-4, Fianium) with a splitter (Splitter-900, Fianium) and endlessly single-mode fibre ESMF (FDS-PCF, Fianium), collimator C, polarizer P and analyser A (LPVIS050, Thorlabs), a bulk-optic Mach-Zehnder interferometer with plate beam splitters BS (BSW07, Thorlabs), a micropositioner connected to mirrors M3 and M4 of the interferometer, three microscope objectives MO (10×/0.30, Meopta), two achromatic lenses AL (74-ACR, Ocean Optics), aperture Ap, a fibre-optic spectrometer (NIR512, Ocean Optics) and a personal computer. The spectral signal is recorded by the spectrometer in the transmission mode after a dark spectrum and a reference spectrum (without the interference) are stored. The spectrometer has a spectral operation range from 850 to 1700 nm and its read optical fibre with a 50 µm core diameter results in a Gaussian response function of ∆λR ≈9 nm. In the test arm of the interferometer, a fibre sample of length z = (77640 ± 10) µm is placed. The fibre sample is a pure silica birefringent holey fibre similar to that analysed in a previous paper [9].
4 EXPERIMENTAL RESULTS AND DISCUSSION Prior to the measurement we utilized the main advantage of the set-up, which is in fibre connection of a light source (that can be varied) with the interferometer. We used a laser diode
12017- 2
J. Europ. Opt. Soc. Rap. Public. 7, 12017 (2012)
P. Hlubina, et.al
2
18
(a)
1.8
16
Interference Order
Spectral Signal
1.6 1.4 1.2 1 0.8 0.6
15 14 13 12 11 10
0.4
9
0.2
8
0 0.9
(a)
17
1
1.1
1.2
1.3
7 0.9
1.4
Wavelength (µm)
1
1.1
1.2
1.3
1.4
Wavelength (µm)
2
20
(b)
(b)
1.8 19
Interference Order
Spectral Signal
1.6 1.4 1.2 1 0.8 0.6
18 17 16 15
0.4 14 0.2 0 0.9
1
1.1
1.2
Wavelength (µm)
1.3
13 0.9
1.4
1
1.1
1.2
1.3
1.4
Wavelength (µm)
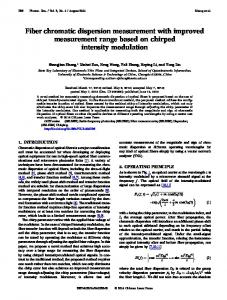
FIG. 2 Example of the recorded spectral signal (markers) together with a fit (solid curve): (a) x-polarization mode, (b) y-polarization mode.
FIG. 3 Fringe order (markers) as a function of wavelength retrieved from the recorded spectral signal shown in Figure 2: (a) x-polarization mode, (b) y-polarization mode. The solid lines correspond to the fit of Eq. (7).
(λ ≈ 670 nm) instead of the supercontinuum source to check the precise placement and alignment of the optical components in both arms of the interferometer by observing the interference pattern. The proper excitation of the fibre was also inspected [9], and in order to measure the chromatic dispersion of the x- or y-polarization mode, the polarizer and analyser need to be oriented along the short or the long axis of the far-field pattern [12]. In the chromatic dispersion measurement, such a path length in the reference arm of the interferometer was adjusted to resolve interference fringes in a spectral range as wide as possible. Figure 2(a) shows an example of the spectral signal recorded by the spectrometer for the x-polarization mode. It clearly shows the effect of the limiting resolving power of the spectrometer on the visibility of the spectral interference fringes [see Eq. (3)]. The visibility is the highest in the vicinities of two different equalization wavelengths at which the group OPD in the interferometer is zero. Between the two equalization wavelengths the minimum in the group effective index Nx (λ) or equivalently the ZDW is located. The procedure used to retrieve the chromatic dispersion Dx (λ) from the recorded spectral signal consists of two steps. In the first step, the wavelengths of interference maxima and minima are determined for the recorded signal. The spectral interference fringes are numbered in such a way that the
fringe order increases in the direction of longer wavelengths to the first equalization wavelength (≈ 0.95 µm), decreases to the second equalization wavelength (≈ 1.28 µm) and from it once again increases in the direction of longer wavelengths. Figure 3(a) shows by the markers the dependence of the fringe order on the wavelength obtained from the spectrum shown in Figure 2(a). In the second step, a least-squares fit of Eq. (7) is used to the dependence which gives the constants ai and m. Figure 3(a) shows the results of the fit by the solid line. Then the constants ai and the known fibre length z give the constants Ai needed in the determination of the chromatic dispersion Dx (λ) according to Eq. (8). It is shown in Figure 4(a) together with Dx (λ) measured in the same set-up by a broad spectral range (500–1600 nm) measurement technique presented in a previous paper [12]. It is clearly seen that both functions agree well in the vicinity of the ZDW. Their different courses, especially in a short-wavelength range, are caused by the approximation (6) used in this narrower spectral range. The constants ai obtained from a least-squares fit of Eq. (7) can serve as the first estimate in a least-squares fit of Eq. (3) to the recorded spectral signal. The result of the fit is shown in Figure 2(a) by the solid curve and it illustrates very good agreement. The corresponding ZDWs λ0x and the dispersion slopes Sx (λ0x ) are listed in Table 1. We estimate the error of determin-
12017- 3
J. Europ. Opt. Soc. Rap. Public. 7, 12017 (2012)
Fit of Eq. (3) Fit of Eq. (7) Method [12]
P. Hlubina, et.al
Sx (λ0x ) (ps km−1 nm−2 ) 0.161 0.162 0.168
λ0x (nm) 1097.4 1097.7 1097.4
y
λ0 (nm) 1083.6 1083.3 1084.0
y
Sy (λ0 ) (ps km−1 nm−2 ) 0.172 0.172 0.178
TABLE 1 The ZDW λ0 and the dispersion slope S(λ0 ) for x- and y-polarization modes.
−1
−1
Chromatic Dispersion (ps km nm )
40
tral interferometry employing a low-resolution NIR spectrometer, utilizes a supercontinuum source, a dispersion balanced Mach-Zehnder interferometer and a fibre under test placed in one arm of the interferometer and the other arm with adjustable path length. Within the method, the precise wavelength positions of the interference maxima and minima in one spectral interferogram are determined. These are used to retrieve the fringe order versus the wavelength which is fitted to the approximate function enabling to obtain the chromatic dispersion. We verify the applicability of the method by measuring the chromatic dispersion of two polarization modes in a birefringent holey fibre. The measurement results are compared with those obtained by a broad spectral range measurement method [12], and good agreement is confirmed. The use of the method, whose main advantage is in the measurement comfort, i.e. in rapid and accurate measurements of the ZDW and the dispersion slope, can be extended for fibres with the ZDW in the VIS spectral range. Moreover, in comparison with fibre-optic implementations of measuring setups the presented one is dispersion balanced and it enables an easy inspection of the optical field at the output of the test arm of the interferometer.
Y X
30 20 10 0 −10 −20 −30 −40 −50 0.9
(a) 1
1.1
1.2
1.3
1.4
Wavelength (µm)
−1
−1
Chromatic Dispersion (ps km nm )
40
Y X
30 20 10 0 −10 −20 −30
6 ACKNOWLEDGEMENTS
−40 −50 0.9
(b) 1
1.1
1.2
1.3
The research was partially supported by the Grant Agency of the Czech Republic through grant P102/11/0675 and by the regional grant CZ.1.05/2.1.00/01.0040.
1.4
Wavelength (µm) FIG. 4 Chromatic dispersion obtained from the fit shown in Figure 3: (a) x-polarization mode, (b) y-polarization mode. The dashed lines are the result of a broad spectral range measurement.
References
ing the ZDW, which is affected by the wavelength sampling of a low-resolution spectrometer [12], below 1 nm and the error of the dispersion slope below 10 fs km−1 nm−2 . It is supposed that the smaller error in determining the ZDW can be attained using an optical spectrum analyser with a denser wavelength sampling. Similar procedure with all the mentioned steps was used for the spectral signal shown in Figure 2(b), i.e., for the y-polarization mode. Figure 4(b) shows the chromatic dispersion Dy (λ) which is shifted to shorter wavelengths in comy parison with Dx (λ). Table 1 then lists the ZDWs λ0 and the y dispersion slopes Sy (λ0 ).
[1] L. G. Cohen, “Comparison of single-mode fibre dispersion measurement techniques,” J. Lightwave Technol. 3, 958–966 (1985).
5 CONCLUSIONS
[6] F. Koch, S. V. Chernikov, and J. R. Taylor, “Dispersion measurement in optical fibres over the entire spectral range from 1.1 µm to 1.7 µm,” Opt. Commun. 175, 209–213 (2001).
In this paper, a simple technique for chromatic dispersion measurement of short length optical fibres, including the ZDW, is presented. The technique, which is based on spec-
[2] L. Zong, F. Luo, S. Cui, and X. Cao, “Rapid and accurate chromatic dispersion measurement of fibre using asymmetric Sagnac interferometer,” Opt. Lett. 36, 660–662 (2011). [3] S. Diddams, and J. C. Diels, “Dispersion measurements with whitelight interferometry,” J. Opt. Soc. Am. B 13, 1120–1128 (1995). [4] M. Tateda, N. Shibata, and S. Seikai, “Interferometric method for chromatic dispersion measurement in a single-mode optical fibre,” J. Quantum Electr. 17, 404–407 (1981). [5] P. Merritt, R. P. Tatam, and D. A. Jackson, “Interferometric chromatic dispersion measurements on short lengths of monomode optical fibre,” J. Lightwave Technol. 7, 703–716 (1989).
[7] P. Lu, H. Ding, and S. J. Mihailov, “Direct measurement of the zerodispersion wavelength of tapered fibres using broadband-light in-
12017- 4
J. Europ. Opt. Soc. Rap. Public. 7, 12017 (2012)
P. Hlubina, et.al
terferometry,” Meas. Sci. Technol. 16, 1631–1636 (2005). [8] M. A. Galle, W. Mohammed, L. Qian, P. W. E. Smith, “Singlearm three-wave interferometer for measuring dispersion of short lengths of fiber,” Opt. Express 16, 16896–16908 (2007). [9] P. Hlubina, M. Szpulak, D. Ciprian, T. Martynkien, and W. Urba´nczyk, “Measurement of the group dispersion of the fundamental mode of holey fibre by white-light spectral interferometry,” Opt. Express 15, 11073–11081 (2007). [10] T. Zhang, Z. Yang, W. Zhao, Y. Wang, P. Fang, and C. Li, “Dispersion measurement of Yb-doped fiber by a spectral interferometric technique,” Chin. Opt. Lett. 8, 262–265 (2008). [11] T. M. Karda´s, and C. Radzewicz, “Broadband near-infrared fibres dispersion measurement using white-light spectral interferometry,” Opt. Commun. 282, 4361–4365 (2009). [12] P. Hlubina, D. Ciprian, and M. Kadulová, “Measurement of chromatic dispersion of polarization modes in optical fibres using white-light spectral interferometry,” Meas. Sci. Technol. 21, 045302 (2010). [13] J. Y. Lee, and D. Y. Kim, “Versatile chromatic dispersion measurement of a single mode fibre using spectral white light interferometry,” Opt. Express 14, 11608–11614 (2006). [14] D. Ouzounov, D. Homoelle, W. Zipfel, W. W. Webb, A. L. Gaeta, J. A. West, J. C. Fajardo, and K. W. Koch, “Dispersion measurements of microstructure fibres using femtosecond laser pulses,” Opt. Commun. 192, 219–223 (2001).
[15] Q. Ye, C. Xu, X. Liu, W. H. Knox, M. F. Yan, R. S. Windeler, and B. Eggleton, “Dispersion measurement of tapered air-silica microstructure fibre by white-light interferometry,” Appl. Optics 41, 4467–4470 (2002). [16] L. Labonté, P. Roy, F. Pagnoux, F. Louradour, C. Restoin, G. Mélin, and E. Burov, “Experimental and numerical analysis of the chromatic dispersion dependence upon the actual profile of small core microstructured fibres,” J. Opt. A-Pure App. Op. 8, 933–938 (2006). [17] J. M. Dudley, G. Genty, and S. Coen, “Supercontinuum generation in photonic crystal fibre,” Rev. Mod. Phys. 78, 1135–1185 (2006). [18] R. Buczynski, D. Pysz, R. Stepien, R Kasztelanic, I. Kujawa, M. Franczyk, A. Filipkowski, A. J. Waddie, and M. R. Taghizadeh, “Dispersion management in nonlinear photonic crystal fibres with nanostructured core,” J. Eur. Opt. Soc. Rap. Public. 6, 11038 (2011). [19] C. Xiong, and W. J. Wadsworth, “Polarized supercontinuum in birefringent photonic crystal fibre pumped at 1064 nm and application to tuneable visible/UV generation,” Opt. Express 16, 2438–2445 (2008). [20] P. Hlubina, and D. Ciprian, “Birefringence dispersion in a quartz crystal retrieved from a channelled spectrum resolved by a fibreoptic spectrometer,” Opt. Commun. 284, 2683–2686 (2011). [21] P. Hlubina, and D. Ciprian, “Absolute phase birefringence dispersion in polarization-maintaining fibre or birefringent crystal retrieved from a channeled spectrum,” Opt. Lett. 35, 1566–1568 (2010).
12017- 5