Spectral Selection for a Biometric Recognition System Based on Hand Veins Detection Through Image Spectrometry F. Cortés, J. M. Aranda, R. Sanchez–Reillo1, J. Meléndez, F. López Infrared Laboratory (LIR). Physic Department / Instituto Pedro Juan de Lastanosa 1 University Group for Identification Technologies Universidad Carlos III de Madrid Avda. Universidad, 30; 28911 – Leganes (Madrid)
[email protected]
Abstract: This paper presents the result of a work orientated to the spectral optimization of the acquisition devices in vascular biometrics systems. Spectral windows are proposed which will allow to design a multispectral system with a few and well defined bands, obtaining a more robust and reliable device, compared with the standard single band systems. This is in accordance to general trend of electro-optical and infrared acquisition systems in the field of the detection and remote sensing, where the work focus is on obtaining optimized bands. To carry out this work a Hyperespectral Imaging System (HIS) has been used as the acquisition system. In order to analyze the large amount of information and to select the spectral bands, a Principal Component Analysis (PCA) has been done.
I.
INTRODUCTION
The need of implementing biometric systems in different scenarios of our daily life derives from the importance of making an automatic, objective and reliable recognition or authentication. In this context, vascular systems appear as one of most safe and difficult to be corrupted. Some authors point out that the one of the major drawbacks of vascular biometric acquisition system is his response in outdoor environments [1]. Others study which are the ideal environmental conditions in terms of humidity and temperature [2]. In any case, the acquisition system must be as robust as possible, independently of the different environment conditions, light intensity, etc, in order to provide the same signal for the same pattern.
81
Optical Properties of the Skin
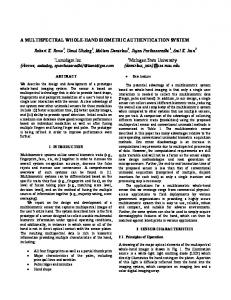
Figure 1.- Main phenomena in the light-tissue interaction [4].
When the radiation interacts with the tissue, a series of process take place which depend on the wavelength and the size of the skin particles. In the case of Visible (VIS) and Near InfraRed (NIR) wavelengths the scattering coefficient is an order of magnitude larger than the absorption coefficient, so the predominant phenomenon will be scattering [3]. There are three principal components in the hand: tissue, veins and in many cases fuzz. Of all of those components the veins have the larger absorption coefficient due to the presence of haemoglobin (Hb and HbO2) (figure 2) [4]. For that reason it seems reasonable to easy think that the veins should present a contrast with the tissues of the neighbourhood.
Figure 2.- Curve of the absorption coefficient of the skin componets. The shape HbO2 show a high absorption coefficient between 400 and 550 nm [4].
82
Spectral Selection: Hyper and Multi Spectral Systems The trend of the electro-optical acquisitions systems in diverse fields dealing with detection is to work in a few different bands in order to optimize operative detection making up systems able to give the main information to make a decision in seconds [5]. These few bands must be well selected depending of the application, varying in the centre wavelength and bandwidth. This is what is known as Multispectral Systems. In contrast, Hyperspectral Imaging (HIS) has a very high spectral resolution, and is used here in order to provide spectral optimization of the multispectral system. From a high spatial and spectral resolution hyperespectral image is possible to define the univocal information, eliminating the non-valid or redundant spectral information. That resultant information could be given in terms of number of bands, centre wavelength and bandwidth. Our aim in this work is to follow this methodology to design a multispectral instrument optimized in bands to detect the pattern veins of a hand. The HIS used in this paper is made up by an optics which focuses the light coming from the scenario, a Michelson interferometer as a device to provide spectral resolution and finally a Focal Plane Array (FPA) detector which is sensitive to the wavelength corresponding to the visible (VIS) and the near infrared (NIR) that confers to the system the spatial resolution.
II. IMAGING SPECTROMETRY: SPECTRAL RANGE
SELECTION OF THE
The study presented in this paper has been done in the VIS (0.4 - 0.75μm) and NIR (0.75 - 1.1 μm) spectral region. In the state of the art revision, some works had been revised with cameras at different regions, as middle wavelength infrared (MIR) from 1.5 to 5 μm, or thermal infrared (TIR) from 7 to 14 μm, and the most relevant conclusions were that the most appropriate region is the VIS-NIR, because this is the region where environmental conditions are not so influent [6]. The principle to generate the image is different in the case of the VIS-NIR range than in the MIR or TIR cases [7]. In the latter ones, the image is formed by temperature contrast due to the self emission of radiance of the body by the fact to be over 0 K, so it is not necessary to illuminate. But in the case of a VIS or NIR sensor, due to Wien Law that describes the displacement of the wavelength . (see figure 3), the of peak emission as a function of the temperature body temperature is not enough to emit a signal large enough to be read by a VIS-NIR sensor. For that reason is necessary to illuminate the scenario with an external light source. This is one of the main drawbacks of the VIS-NIR range versus the MIR or TIR window.
83
VIS-NIR region
TIR region
MIR region
Human skin temperature Black body 500 K Black body 1000 K
-1
Spectral Radiance [W/sr m cm ]
10000
2
1000
100
10
1
1
10
100
Wavelength [μm]
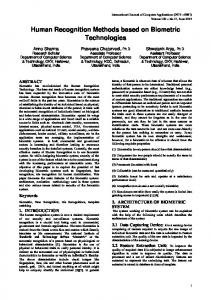
Figure 3.- Planck’s Law for black bodies at different temperatures. It shows that the curve corresponding to the human body emission (black curve) is not enough to emit detectable signal in the VIS-NIR region.
According to the illumination, the sun was chosen as the light source, because his spectra cover the entire VIS-NIR region. A previous simulation of the sun irradiance has been performed. That simulation was made with Modtran software [8]. 6 ,0
45 , 5 43 , 53 2 , 5
2
W a v e le n g th ( μ m )
1 ,5
1
0 ,5
2
-1
Solar Irradiance (μW/cm cm )
5 ,5 5 ,0 4 ,5 4 ,0 3 ,5 3 ,0 2 ,5 2 ,0 1 ,5 1 ,0 0 ,5 0 ,0
3000
6 000
900 0
120 00
1 5000
W a v e N u m b e r (c m
180 00 -1
21000
24 000
)
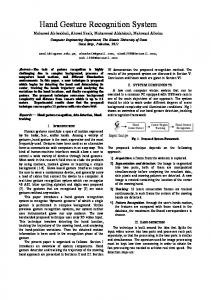
Figure 4. – Sun irradiance simulation in the earth surface with MODTRAN software for 0.4 to 5 μm.
The output obtained is shown in figure 4. The sun light covers the entire VIS-NIR region with the exception of some zero valleys that are not very relevant for that paper. The sun allows two different possibilities for illumination: direct or diffuse emission. The direct illumination was obtained by exposing the hand skin directly to the sun rays. To obtain the diffuse illumination the hand was placed in a shadowed place.
84
The HIS used in this paper is a Fourier Transform spectroradiometer based on a Michelson interferometer with a charge coupled device (CCD) sensor doped with Si to work in the VIS and NIR spectral regions (figure 5). The main characteristics are shown in table I. Table I. - Sensor characteristics used in this paper
Spectral Range, and Resolution 0.4-1.1μm, 0.1μm
Array Size 1280 x 1024
Sensing Technology FOV CCD, 12 bits
15 mrad
Focal Distance 50mm
Figure 5. - Layout of the Michelson Interferometer of the System used.
Spectral resolution is obtained by means of a Michelson interferometer, which produces constructive or destructive interference for the different wavelengths as a function of the sweep of a mirror, focusing the image in the detector matrix conforming so, as a function of time, an interferogram at each detector. Over that interferogram the Fast Fourier Transform (FFT) is applied to obtain the spectra cube image, where, instead of time, the z axes correspond to wavelength [9].
85
colums
lines λ (μm)
Figure 6.- Data cube of a hand acquired with the Spectral Imaging.
The result is a cube image from 0.4 to 1.1 μm as show in figure 6, are units digital counts in the case of working in emitance mode. The instrument allows obtaining reflectance, absorbance or emitance spectra. In the case of reflectance or absorbance spectra is necessary to have a reference or background in order to generate them. In the case of emitance spectra, the instrument measures the received signal. In this paper the emitance mode has been used, eliminating so the possible errors with the background reference. Obviously, the data cube image obtained in this mode is a composition of different reflectance or absorbance spectra due to the different characteristics of the surface skin.
III.
METHODOLOGY AND PROCEDURES DESCRIPTION
After selection of the VIS-NIR spectral window to perform the study, the methodology followed started by preparing a measure campaign considering the coverage of many different illumination cases, and capturing different hands and different parts of the hand. After that, a post-process of the datacube was necessary, in order to adapt the datacube to the analysis algorithm. Finally, the spectral characterization of the scenario (veins, hand skin and others) has been done demonstrating a qualitative different between both spectral characteristics. In order to have enough images to validate the study, different parts of the hands were acquired, such as the palm, back of the hand and wrist. All of them were taken with different illumination conditions (diffused and direct).
86
In order to study and extract the correct information, Principal Component Analysis (PCA) was applied in the datacube [10]. With hyperspectral images that tool is useful due to the big amount of different information (spatial and spectral) within a datacube. Also the PCA is a very powerful tool in some applications where reducing the amount of data is critical, keeping only the necessary information and discarding the redundant, noisy, or simply the non-valid information. PCA is an algebraic technique that diagonalizer the covariance matrix of the data. For a database of m bands, it provides an eigenvector matrix of mxn elements. This matrix provides a method to analyze efficiently the datacube spectra. The first eigenvector corresponds to the maximum covariance eigenvalue. The linear combination of bands formed with their components as coefficient is the first principal component (PC 1), an image that accounts for the maximum variance of data. The second column of the matrix is the eigenvector of the PC 2 containing the maximum variance after the PC 1, and so on for the rest of the PC’s. The study of the PC’s provides a systematic means to distinguish the main target of interest under study (i.e. the veins). Usually, the PC1 image is “mean” images that contain the overall variations due to illumination (shade, bright areas, etc.). The successive PC contains fine information related to the different responses of the object in the scenario; and it is to be expected that some of them provide an enhanced “vein image”. The eigenvector associated will have a specific special shape and when that spectral shape is defined, it will be possible to define suitable spectral bands for a multispectral system for vein detection. In this study, the spectral bands have been created by a synthetic image composed by an average of the spectral images dictated by the spectral shape defined in the PCA study.
IV.
EXPERIMENTAL RESULTS
In the first measurement campaign the main different possibilities were covered: Diffuse and direct radiation, and palm, back of the hand and wrist.
12000000
Eigenvalue
10000000 8000000 6000000 4000000 2000000 0 0
60
70
80
90
100
110
120
130
Bands
Figure 7.- PC eigenvector representation.
87
140
All the datacubes are composed of 127 spectral bands from 400 to 1100 nm. In order to study the spectra and reduce the amount of information, the PCA was performed. In the figure 7 the value of the each eigenvalues are represented in decrease order. The study of this graph let to know how many of eigenvalue, that will be correspond with the number of PC bands, which will be necessary for dispose of the entire information. According to the graph to recompose the most of the information is possible, using only two or three bands. In the figure 8 is shown the obtained image for all the spectral range of the system (400 – 1100 nm) and the three firsts PC’s bands of a datacube. The PC 1 is an image composed by contributions of the almost all the bands; we can appreciate that is very similar to the broadband image. The PC 2 causes the enhancement of the veins with a negative contrast between veins and the tissue. Finally, the PC 3 shows other objects in the scenario as fuzz and skin texture. This information is not relevant for our proposes but could be useful for other application. The following PC’s have not been shown because they only contain noises, redundant or non valid information for our study, as show the PC 4. Broadband
PC 2
PC 1
PC 3
PC 4
Figure 8. – Top: left the broadband image from 400 to 1100 nm; right: the PC 1. Bellow is showed the rest PCA’s.
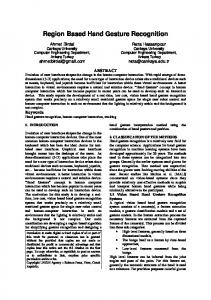
The main conclusion is that PC 2 is where the information related to vein detection is contained. In order to study the PC 2 and extract the most information as we can, the eigenvector components corresponding to that PC was represented in a graph as a function of wavelength of each of 127 bands of the HIS. The result is shown in figure 9, where results are represented. That correlation values present a singular shape, and that shape is kept for all the datacube acquired.
88
PC 1 PC 2 PC 3
Eigenvalues
0,2
0,1
0,0
-0,1
-0,2 400
500
600
700
800
900
1000
1100
Wavelenght (nm)
Figure 9. – Eigenvalues of the three first PC’s of the datacube showed.
That composition of PC 2 band can be divided in three different regions: •
Region I: 400 – 600 nm: A valley is appreciated with negative values.
•
Region II: 650 – 850 nm: The eigenvector components take positive values in the shape of a crest.
•
Region III: 700 – 1100 nm: The eigenvector components are close to zero.
The contrast in the value of eigenvector components between the region I and II reflects the spectral contrast in haemoglobin absorption that can be seen in Figure 2 where the absorption coefficients [in cm-1] of the main components of the tissue are represented, haemoglobin has a high absorption coefficient around 475 nm [4]; that means; that the high concentration of haemoglobin (150 g/l), increases the radiation absorption of the veins at that wavelengths. This is in agreement with the results in terms of spectral windows.
V.
DATA PROCESSING
After the spectral pre-selection was done, the next step was to perform a data processing based on techniques of enhancement of the target versus background, in order to validate the result. Firstly, a synthetic image composed from hyperspectral images was created to simulate a broadband image, obtained with a suitable optical filter. This technique trying to simulate a real image, acquired with a real camera with a certain broadband. The synthetic image corresponding to the first broadband selection was created getting the mean of all the bands from 400 to 600 nm (band 1). The second synthetic image generated was the corresponding to the mean of all the bands from 650 to 850 nm (band 2), as is shown in the figure 10. With those processed images a bi-spectral system is simulated.
89
Figure 10.- Left: synthetic image between 400 to 600 nm (band 1); right: synthetic image between 650 to 850 nm (band 2).
Applying PCA over synthetics images generated is obtained two new PC images (figure 11) where is possible to appreciate the enhancement of the veins at the PC 2. 400 ‐ 600 image
650 ‐ 850 image
Figure 11.- PCA with the two synthetic images B1 and B2. In the PC 2 is possible to distinguish the veins with high contrast
Comparing the veins contrast in the PC 2 obtained with the images of the HIS with PC 2 obtained with the synthetic images we can appreciate that the contrast is very similar or even better in the case of the PC 2 of the synthetic image as show the figure 12.
Figure 12.- Right: PC 2 obtained with the two synthetic images; left: PC 2 obtained with the images of the HIS
90
VI.
CONCLUSIONS AND FUTURE WORKS
This paper describes the procedure to perform the spectral selection for a bi-spectral imaging system for vascular biometrics in the VIS-NIR region. The instrument used for this study has been a hyperspectral camera in the VIS-NIR region with a high spectral resolution in order to perform a detailed spectral analysis. Hyperspectral images have made possible to define two bands which optimize the detection of the dorsa veins of the hands by means of principal component analysis. This selection has demonstrated to be robustness with respect to environment conditions because the hand was illuminated with the sunlight, what means that there was no control over the illumination. The requirement of controlled illumination was one of the main drawbacks of the previous sensors for vein pattern recognition. In spite of this, our aim for a future research work is a system based on illumination with a more powerful light than the sun in order to be able to detect the veins of the palm, that have not been seen with the sun illumination. The incident sun irradiance is quite low, and this implies that the light cannot penetrate very deeply into the skin, as in the cases where the illumination is performance with devices such as LED matrix, xenon lamps, etc. Another future work proposed is to perform an experimental validation with the defined optical filter in a standard camera.
VII. ACKNOWLEDMENTS The authors acknowledge the financial supported by Ministerio de Educación of Spain and Instituto Pedro Juan de Lastanosa.
VIII. REFERENCES [1] R. Sanchez-Reillo, B. Fernandez Saavedra, J. Liu-Jimenez, C. Sanchez-Avila. “Vascular Biometric Systems and Their Security Evaluation” [2] W. Lingyu, G. Leedham, “Near- and Far- Infrared Imaging for Vein Pattern Biometrics”, Proceedings of the IEEE International Conference on Video and Signal Based Surveillance (AVSS'06), IEEE, 2006. [3] Tuchin, Valery. ‘‘Handbook of Optical Biomedical Diagnostics’’. SPIE Press Bellingham, WA, (USA) 2002. [4] Soto Thompson, Marcelo “Photodynamic Therapy utilizing Interstitial Light Delivery Combined with Spectroscopic Methods”, Doctoral thesis, Lund Institute of Technology, Sweden, 2005 [5] S. Briz, A. J. de Castro, J. M. Aranda, J. Meléndez and F. López. “Reduction of false alarm rate in automatic forest fire infrared surveillance system”, Remote Sensing of the Environment. Vol. 86, pp. 19-29, Ed. Elseiver Science Inc., 2003.
91
[6] Kuo-Chin, Chih-Lung Lin, “The Using of Thermal Images of Palm-dorsa Veinpatterns for Biometric Verification”, Proceedings of the 17th International Conference on Pattern Recognition (ICPR’04), IEEE, 2004 [7] Holst, Gerald C. ‘‘Common Sense Approach to Thermal Imaging’’. JCD Publishing and SPIE Optical Engineering Press, 1st ed., Florida and Washinton (USA) 2000. [8] Ontar Corporation. “PcModWin3 Manual”, Ontar Corporation, North Andover, Massachusetts, January, 1996. [9] Chang, Chein-I, “Hyperspetral Imaging: techniques for spectral detection and classification”, 2003 [10] Richards, J.A.; Jia, Xiuping. “Remote Sensing Digital Image Analysis”. 3rd ed. Springer-Verlag, Berlin, Germany, 1999.
92