Spectrum of Pitch Differences Models the Perception of Octave. Ambiguous Tones. Immanuel Normann, Hendrik Purwins, and Klaus Obermayer. {immanuel ...
Spectrum of Pitch Differences Models the Perception of Octave Ambiguous Tones Immanuel Normann, Hendrik Purwins, and Klaus Obermayer {immanuel,hendrik,oby}@cs.tu-berlin.de, Technische Universit¨at Berlin, http://ni.cs.tu-berlin.de
Abstract
Spectra of Stimuli (in dB SPL) 50
1 .Tone
0
Circular structures A relation ‘ ’ is termed circular, if there are elements ��������� ��
� ��� with ��� ���
�
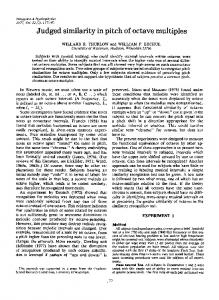
��� . In contrast to a linear order ‘ ’ is not transitive. The paradox of our experiments is based on this circularity and intransitivity of pitch relation. According to common notion any tone is assigned to one pitch on a linear scale. Pitch relation is thus identified with ‘ � ’ resp. ‘ � ’ for real numbers. But this order is linear and transitive and thereby - as we will see - in contradiction to our experiments. Description of the Experiment The stimuli consist of ��� � ������� ��� tone pairs. Six tone pairs form a logical block. To each tone pair there exists another tone pair in reverse order. In addition every tone pair exists in 9 transpositions. One block contains six distinct harmonic complex tones (cf. Figure 1). Those are combined to six tone pairs: 1 with 2; 2 with 3; ... ; 5 with 6; 6 with 1. Each of the 18 subjects has to give a judgment on pitch comparison to each tone pair: 1) ‘first tone higher’, 2) ‘second tone higher’, 3) ‘both tones are equal’, 4) ‘undecidable’. The sequence of tone pairs is presented in random order. Result A subject has perceived six tones of a block paradoxically, if there is at least one ascending tone pair and all
2 .Tone
C
0
d
50
3 .Tone
0 50
D
Ab
E
4 .Tone
0
f#
50
5 .Tone
0
ab
50
0
Bb e
6 .Tone
F#
0
1000bb
500
1500
2000
2500
Frequency (Hz)
Figure 1: The harmonic complex tones of a block differ in amplitude of the even and the uneven partials (left). The timbre manipulation leads to an octave uncertainty that enables paradoxical, namely circular pitch perception (right). others are perceived ascending as well or equal in pitch. An analogous formulation holds for paradoxically descending tones of one block. This result (Figure 2) supports the assumption, that musically experienced listeners tend to paradoxical perception. Naive listeners rather guess and distinguish less between pitch and brilliance. Histogram of Different Degrees of Paradoxial Perception
Histogram of Different Degrees of Paradoxial Perception
100
7
90 6
80 5
70
No. of Subjects
Experiment: Judgment on Pitch Comparison
c
50
% of Paradoxically Perceived Blocks
In the experiment we proof the paradoxical perception of pitch. A tone sequence demonstrates this paradox: the sequence is perceived as descending, although the first and last tone are identical. The intransitivity of pitch perception generalizes (Shepard 1964). It applies also to harmonic complex tones with variate amplitude envelope and partials that are arranged in intervals different from octaves. The paradox perception in this experiment as well as in the Shepard scale is modeled by a formula (spectrum of pitch differences) that extends the virtual pitch algorithm (Terhardt 1998) to pitch intervals.
60
50
40
30
4
3
2
20 1
10
0
2
4
6
8
10
12
Subject Index
14
16
18
0
0−10
10−20 20−30 30−40 40−50 50−60 60−70 70−80 80−90 90−100
% of Blocks Paradoxically Perceived Pitch
Figure 2: 11 out of 18 subjects perceive at least 70% of all blocks paradoxically. For all the subjects equivalent statements hold for mostly 30% of all blocks (left). The result is a bimodal distribution that indicates the different types of listeners (right).
Specific Loudness and Pregnance The specific Loudness JLK is linearly interpolated from the equal loudness contours (Fletcher and Munson 1933) (Cf. ‘ M ’ in left column in Figures 3 – 4). J K From the specific loudness of all partials, the pregnance NCO/P (Cf. ‘ Q ’ in the left column of Figure 3 - 4) of the R -th partial is calculated:
N O/P
V
P
J P �
� K
P[Z]\ 15���TS log �7�CUWVYX :
P=^ _ �
_ ����egacfib=h d jlk K =P m ��� ge a fib�h n j
8`� 8 �
N�KAo N K@s p
o
�
J K
JLK � 1
��t \
o P K 1qp WU r 1 r Z :`uv:;�@w 2 UWr
K
1 r
P Z
^ �Hz K � J K \ \ �yx I k �C |U { u�2�} r Z � q 1 �C
u :~ :`u�:�Cw 2�
�
Spectrum of Pitch Differences In our approach to each compared pair of complex tones, we assign a spectrum of pitch difference (SPD). In this mathematical framework, pitch comparison is an operator that maps two functions - the spectra of the compared complex tones - to another function of Z pitch differences � . U � denotes the intensity of the perceived pitch difference . A pair of complex tones with a global ambiguous pitch relation should lead to a SPD with two or more peaks at the same level. Whereas distinct global pitch differences should show a single significant peak in the SPD (e.g. when pure tones are compared).
(in dB/phon)
Sinusoidal masking is displayed in the bark-phon plane:
PD Max
VP PromVP HSC
0.1
0.5
Log. Freq. (kHz)
2
0.1
0.5
Log. Freq. (kHz)
2
Strength
Model: Spectrum of Pitch Differences
60 40 20 0 60 40 20 0 60 40 20 0 60 40 20 0 60 40 20 0 60 40 20 0 60 40 20 0 60 40 20 0 60 40 20 0 60 40 20 0 60 40 20 0 60 40 20 0
Virtual Pitch
Statistical Formulation and Evaluation For the -th block, define a binary random variable !#" : !#"$�%� , if the -th block is perceived paradoxically descending, otherwise ! " �&� . Be '�( ' ( ! " �)��*+�-,/.�� ! " �0� *+�)�$1&,/. , for subject 2 . Under the simplifying assumption of stochastic independence 3 �76 . �54 "98/� !#" is binomially :;�76=< >@?A1 distributed. The uniformly best, randomized Neymann-Pearson test for two-sided test problems to error level B%�)�C �=D yields, that at least 39 % of the subjects have a paradoxical pitch perception (‘, . �E�C D ’; for comparison ‘wild guess’ would yield ,F�G�C �H��I ).
−1 −0.5 0 0.5 1 SPD (in Oct.)
Figure 3: Pitch determination of the chromatic Shepard scale. In the left column we see scaled intensities (bars), loudness ( M ), specific loudness (dashed), pregnance ( Q ) of the Shepard tones, and the hearing threshold (line). In the middle column virtual pitches (dotted) are indicated including the six most prominent virtual pitches ( ). The right column displays the spectrum of pitch differences (SPD) of complex tones belonging to this and the subsequent row. The most prominent value of SPD is indicated by . The SPD in the last row belongs to the complex tones of the last and the first row. The being always on the same side of the vertical zero line throughout the right column indicates circular pitch perception.
60 40 20 0
VP PromVP HSC
Thresh dB Phon Preg.
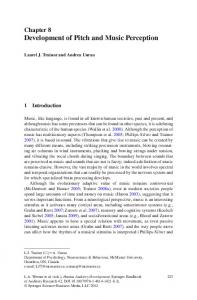
amount of the subjects judgments ‘the first tone is lower then the second’ in the experiment (resp. �y��� with ‘the first tone is higher then the second’). Both tone sequences are paradoxically ascending meaning that most subjects judged the tone of the 2 -th row lower then k � -th row and the last tone lower then the first that of the 2 one. These results are consequently reflected by the corresponding SPD: Each SPD has its absolute maximum for a �¦�§� . Thus the SPD describes the experimentally found circular structure of pitch relations. Amplitudes of two subsequent tones according to Figure 1 yield an octave ambiguous interval perception. The octave ambiguity is apparent in the two most prominent peaks in the right column of Figure 4.
PD Max
60 40 20 0 60 40 20 0 60 40 20 0
60 40 20 0 0.1
0.5
Log. Freq. (kHz)
2
Strength
Virtual Pitch
(in dB/phon)
60 40 20 0
0.1
0.5
Log. Freq. (kHz)
2
−1
−0.5
0
0.5
1
SPD (in Oct.)
Figure 4: Pitch determination of the stimuli in the experiment (cf. Figure 1, cf. Figure 3 for explanation). The formula models the perception of a circular sequence of harmonic complex tones. Formal Description The formula for calculating virtual pitch in (Terhardt 1998) p.362-364 is adapted to pitch intervals:
_ _ p@]p`. Z U SPD � ] v@� �i���< � ? X � log e 7?= Z Z where { � U{ � � � � { and { [� U{ � � �
� { ¡ are the specZ tral frequencies of the two complex tones. pl� U p � � � ��7p Z resp. p � U p � � � ��cp ¡ are their associated weights (according to (Terhardt 1998): S.362). For each partial { of the first tone { , the spectral weight pCu of the subharmonic { u is compared to the spectral weight p/. u of the subhar monic { . u of each partial { . of the second tone { .1 Pairs of subharmonics are£ added, if they all have the same pitch differ ence �¢� log £ ? � . A reversed order of pitch comparison X ZC¤ 1� Z leads to a mirrored SPD ( U � ). U U � CZ
�
Description of Paradox Tone Sequences by Spectrum of Pitch Differences (Cf. Figure 4) For a qualitative description of the experiments by the SPD, the SPD must be interpreted: Identify the maximum of for y�¥� with the 1 This idea is inspired by Terhardt’s principle of subharmonic coincidence for calculation of virtual pitch ((Terhardt 1998): S.363-364). Though we do not determine virtual pitch explicitly, the SPD-formula can be considered to some extent a comparison of virtual pitches.
Conclusion and Outlook So far the SPD is interpreted only qualitatively for experiments of binary pitch relation judgments. Our primary goal was to find a formula which expresses the circularity of paradox sound sequences. The SPD formula holds for our experiments as well as for the experiment in (Shepard 1964). But the SPD is not limited to describe ‘lower/higher’ pitch relations. It provides more detailed information of pitch distance and significance. An appropriated experiment to test SPD in detail is not designed so far. A next step is also a biological motivated differentiation. One idea is to embed the term ¨ . into a model of spiking neurons, in which coincidence detection weights periodicity. Acknowledgment We thank the subjects, Ulrich Kockelkorn for advice, Folkmar Hein for support with facilities. The second author would like to thank B. Kroupa so much for directions. We are grateful for financial support by ‘Axel Springer Stiftung’ and the ‘National German Merit Foundation’.
References Fletcher, H. and W. A. Munson (1933). Loudness, its definition, measurment and calculation. J. Acoust. Soc. Am. 5, 82–108. Shepard, R. N. (1964). Circularity in judgments of relative pitch. Journal of the Acoustical Society of America 36, 2346–2353. Terhardt, E. (1998). Akustische Kommunikation. Springer.