software defined radio,â Ph.D. dissertation, Royal Institute of Tech- nology, Sweden ... [9] J. Benko, âA PHY/MAC Proposal for IEEE 802.22 ... Presentation.ppt.
SPECTRUM SENSING WITH FORWARD METHODS Janne J. Lehtom¨aki, Johanna Vartiainen, Markku Juntti, and Harri Saarnisaari ∗ Centre for Wireless Communications (CWC) University of Oulu Oulu, Finland
ABSTRACT New technologies will require effective spectrum use. Opportunistic spectrum usage that is one application of so called cognitive radio techniques enables the use of unused frequencies. One possible way to locate these free frequency bands is to use so called spectrum sensing. In this paper, energy detection based spectrum sensing methods called the forward consecutive mean excision (FCME) and forward cell averaging (CA) methods are studied in the situations where the noise power is unknown. The detection and false alarm probabilities of the studied methods are also of interest. Numerical results show that the investigated approaches have good performance.
INTRODUCTION Cognitive radios are smart radios which can adapt to the environment. One application of cognitive radio technologies is opportunistic spectrum usage. Therein, unused frequencies in spectrum are identified and used for transmission. The unused frequencies may be located in frequencies allocated to some licensee (primary user), for example, in the television (TV) frequencies [1]. According to several measurements, large amounts of spectrum are unused at a particular moment. There are several methods for identifying the unused spaces [1–3]. Reliable methods are required for identifying unused spectrum so that harmful interference is not caused to the licensee. For example, it is possible to use geo-location techniques to find the location of the device. Then a database is queried to find the allowed frequencies in that location. Secondly, it is possible to rely on a beacon approach where device is allowed to transmit when it hears a beacon from the licensee. More generally, a control signal can be used for identifying vacant frequencies [1]. Thirdly, it is possible to use spectrum sensing where the available ∗ This work was supported by the Finnish Defence Forces Technical Research Centre, Nokia, the Finnish Funding Agency for Technology and Innovation, and Elektrobit. The work of J. Lehtom¨aki and J. Vartiainen was supported by the Nokia Foundation.
frequencies are determined using signal detection methods. For example, cordless telephones must use automatic channel selection mechanism to prevent using any occupied frequency [2]. Similarly, unlicensed Personal Communication Service (PCS) equipment is required to monitor the spectrum before transmitting [2]. Shure’s ULX wireless microphones use automatic frequency selection for finding open TV channels [4]. Monitoring is also required for devices operating in the 5 GHz (U-NII) band to avoid interference to radar signals; therein the term Dynamic frequency selection (DFS) is used. More generally, DFS can be viewed to be a mechanism to select frequency based on some specific condition, such as location [2]. Also the term Listen-before-talk (LBT) may be used to describe sensing before transmission. Approaches similar to LBT are used in some (unlicensed band) IEEE standards such as 802.11 and 802.15.4, as a part of carrier sense multiple access with collision avoidance (CSMA-CA). For example, IEEE 802.15.4 devices perform clear channel assessment (CCA) with energy detection or carrier sense before transmission. In addition to frequency agility and spectrum sensing described above, cognitive radio technologies include, for example, adaptive modulation and transmit power control [5]. ”Full” cognitive radios may employ the cognition cycle, which includes Observe, Orient, Plan, Learn, Decide, and Act phases [6]. In [1], the Federal Communications Commission (FCC) is proposing to allow unlicensed operation in the TV spectrum at locations where the spectrum is unused. For personal/portable devices, a control signal based approach is proposed. For fixed access devices, geo-location and database based approach is suggested. Comments are requested about permitting the usage of spectrum sensing as an alternative approach. Currently, the IEEE 802.22 working group is developing a standard for fixed access wireless regional area networks (WRAN)1 using vacant TV channels. Therein, a base station (BS) controls Customer Premise Equipment (CPE). The base station may use database based approach supplemented by distributed spectrum sensing [7].
1 of 7
1
http://www.ieee802.org/22/
There are several possible sensing and signal detection methods such as the powerful cyclostationary approach [8– 11], energy detection [9–13], fast Fourier transform (FFT) detection [9, 14, 15], and correlation detection [9, 14]. The hidden terminal problem may cause issues when using sensing. It refers to situation where unlicensed device has large path loss to the licensed transmitter, and therefore is not able to detect it, but the path loss to the licensed receiver is not so large. Due to this problem high sensitivity detectors or distributed spectrum sensing may be required. Different approaches have different benefits and drawbacks. For example, energy detection is very simple to implement but it also lacks the capability to differentiate between different signal types and it may have limited sensitivity thus requiring long integration times. Energy detection performance may be improved by using narrowband filters centered on known locations of pilots or carriers. The false alarm probability PFA is the probability of finding a channel occupied when it is actually vacant. The detection probability PD is the probability of finding a channel occupied when it really is occupied. Traditionally, requirements have first specified the false alarm probability. Then the optimal Neyman-Pearson (NP) detector is the one with the highest detection probability. In practice, in spectrum sensing, the detection probability may be viewed to be more important than the false alarm probability, since it is important to limit interference to the licensee. It is possible to have requirements on both the false alarm probability and the detection probability. For example, in the IEEE 802.22, the requirements are PFA ≤ 0.1 and PD ≥ 0.9 [16]. Let us assume that the value of PFA is fixed, for example to 0.1 and that threshold based detection is used. With known noise power it would be possible to use an ideal detection threshold so that the samples above the threshold correspond to occupied frequency bands. An ideal threshold refers to a threshold selected so that PFA has the desired value. For example, in [13], the ideal threshold was used with energy detection, so that the detector is able to maintain the false alarm probability in all cases. However, as mentioned in [10, 11,13], using the ideal threshold suffers from the uncertainty in noise power [17]. Noise uncertainty originates from, e.g., calibration error and from changes in the thermal noise level [16]. In some cases it may be possible to estimate noise using guard bands of the primary signal [11]. Similar approach based on estimating noise power using a known vacant channel was suggested in [9]. Therein, disconnecting the antenna
was also suggested. However, depending on the frequency and other conditions such as the required accuracy, this approach may have problems because noise external to the receiver is ignored. When sensing TV signals, it is possible to calculate the ratio of pilot component to another component, therefore avoiding estimation [18, p. 88]. Additional interference at that particular component may cause missed detections as in those cases the ratio will be smaller than otherwise. Use of some order statistics instead of fixed component might improve performance. In [19], we proposed that a two-stage detection approach can be applied in the context of the energy detector. However, the twostage approach is computationally intensive because every sample is separately tested. It would also be possible to perform temporal averaging of the noise level using a forgetting factor method [20] (also [9, p. 42]). That approach has a low complexity. However, depending on the parameters used, it reacts rather slowly to changes in the noise level and it may also have problems with slowly increasing signal level. There exist also alternative methods for dealing with the noise uncertainty such as eigenvalue based sensing algorithms [21, 22]. In FFT based sensing, it is possible to take average of the magnitude-squared values corresponding to different frequencies and to use scaled average for threshold setting, as in cell averaging (CA). Additionally, variance may be also used in threshold setting [14]. In this type of approaches interference will be included in the threshold (the average is based on all values), so performance depends on the relative amount of interference. In this paper, we investigate the joint forward methods for spectrum sensing. The methods are based on the set of energy measurement samples, i.e., energy detection. Pure energy detection may not always have the required performance. However after energy detection it is possible to perform fine/feature detection on the found unoccupied channels [9]. Similar methods as energy detection can be applied in FFT based detection. Threshold is selected to have PFA equal to (or less than) the desired value. The joint forward methods do not require the knowledge of the noise level, but that is adaptively estimated. Furthermore, they do not require fixed vacant channels nor signal-free guard bands. The proposed approach does require a few vacant channels but they do not have to be at fixed frequency bands. Forward methods have previously been used for outlier detection, impulse detection, and interference suppression [23, 24]. Note that although not covered here, it is possible to perform further processing on the frequency bands energy detection finds occupied, e.g., separating licensed users from unlicensed ones.
2 of 7
SYSTEM MODEL
The sensing device is assumed to perform energy measurements of the candidate frequencies. The resulting samples containing only noise are assumed follow the central chisquare distribution with 2M degrees of freedom, where M is the time-bandwidth product (or the number of real valued pairs), i.e., the product of the measurement duration and the measurement bandwidth [25]. To be more specific, the energy of bandpass white noise process n (t) with one-sided RT bandwidth W in time T , V = 0 n2 (t) dt, can be modelled using M = T W , which is assumed to be an integer, and variance per dimension σ 2 = N0 /2, where N0 is the one-sided noise power spectrum density [25]. The measurement bandwidth does not have to be equal to the channel bandwidth. For example, it can be concentrated on frequencies where the signal is expected to have significant features such as Advanced Television Systems Committee (ATSC) pilot (11.3 dB below average power) and National Television Standards Committee (NTSC) carriers. The case M = 1 corresponds to exponential distribution. The exponential distribution can be used to model the magnitude-squared outputs of FFT of complex white Gaussian noise [26]. More generally, the sum of M magnitude-squared FFT outputs can be modelled by using M equal to number of entries summed. The samples containing signal components are assumed to follow the non-central chi-square distribution with 2M degrees of freedom, with non-centrality parameter 2Υ, where Υ is the signal-to-noise ratio [25]. The noncentral chi-square distribution is widely used to describe the outputs of a radiometer when a non-fading signal is present in addition to white Gaussian noise process. For example, the energy of a bandpass radio signal r (t) with one-sided bandwidth W and RT duration T is V = 0 r2 (t) dt and can be closely modelled using M = T W , σ 2 = N0 /2, and λ = E, where λ is the non-centrality Rparameter and E is the signal energy. Scaled T energy V = c 0 r2 (t) dt, where c is the scaling factor, can be modelled using σ 2 = N0 /2c and λ = Ec. By choosing c = 2/N0 we get the widely used normalized model with σ 2 = 1 and λ = 2Υ, where Υ = E/N0 [25]. In fading channels, the SNR is a random variable.� Let us ¯ , where denote the distribution of the SNR with g Υ; Υ ¯ Υ is the � average � SNR. In�the� Rayleigh fading channel, ¯ = 1 Υ ¯ exp −Υ Υ ¯ [27]. If M = 1, the reg Υ; Υ sulting distribution reduces to exponential distribution after averaging over all possible values of instantaneous SNR.
The channels are assumed to have independent SNRs. Note that the models presented above assume that the noise variance is normalized to one. However, the methods that will be studied are in no way limited by the actual noise variances because they do not depend on it. This type of invariance is crucial for forward methods to work well.
FORWARD METHODS Denote the samples ordered in an ascending order with Q(i) , i = 1, · · · , N , where N is the number of samples. The forward consecutive mean excision (FCME) algorithm begins by assuming that the I smallest samples are caused by only noise. Then, the following test is performed with k = I [24] Q(k+1) > Tk
k X
Q(i)
(1)
i=1
where Tk are scaling factors that define the properties of the forward method. If the test (1) is true, the algorithm stops and Q(k+1) , · · · , Q(N ) are decided to contain signal components. In spectrum sensing, the corresponding frequency channels are decided to be occupied. Otherwise the test is performed again with k incremented by 1. This is continued until the test is true for some value of k or when k = N which implies that no outliers are detected. In the forward CA method [19], Tk = FINV (1 − Pr , 2M, 2M k)/k
(2)
where FINV is the inverse of the F (Fisher) cumulative distribution function and Pr is the desired clean sample rejection rate (corresponds to the false alarm probability). In the FCME algorithm, Tk = TCME /k and TCME is the FCME parameter. Usually, TCME is the solution to [24, Eq. (2)] Pr = e−TCME M
M −1 X k=0
1 (TCME M )k . k!
(3)
NUMERICAL RESULTS In spectrum sensing Pr is usually rather large. In these cases, the difference between the desired and achieved clean sample rejection rates may be too large. If the achieved value is higher than desired value then several vacant channels will be classified as occupied. On the other hand, if the achieved value is too small then the detection performance suffers. Therefore, the desired Pr should be changed so that
3 of 7
0
10
Table I
CA, N=32, I=8, M=5, 10 Outliers CA, N=32, I=8, M=5, 20 Outliers
N 16 16 16 32 32 32
I 1 4 4 8 12 12
M 20 5 20 5 5 20
Desired Pr 10−2 10−1 −2.07 −1.27 −2.09 −1.31 −2.06 −1.24 −2.07 −1.27 −2.06 −1.27 −2.05 −1.21
Table II C ORRECT THRESHOLD PARAMETER TCME
N 16 16 16 32 32 32
I 1 4 4 8 12 12
M 20 5 20 5 5 20
Obtained clean sample rejection rate
C ORRECT log10 (Pr ) FOR THE FORWARD CA METHOD
Ideal result
−1
10
−2
FOR
10
FCME
Desired Pr 10−2 10−1 1.73 1.45 2.53 1.95 1.64 1.40 2.43 1.85 2.43 1.84 1.62 1.38
−20
−10
0 10 SNR [dB]
20
30
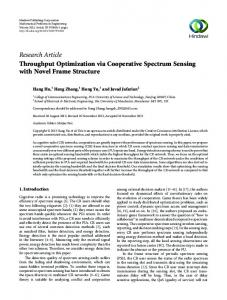
Figure 1. False alarm rates of the forward cell averaging detector with N = 32 channels, I = 8, M = 5, and desired Pr = 10−1 , Rayleigh fading. The number of occupied channels: 10 and 20.
the obtained clean sample rejection rate matches the real desired value. This has to be done only once for a given set of parameters. Correct values for different sets of parameters were found using simulation and are presented in Tables I and II. Results for the CA method are shown in Table I. It can be seen that there is not significant variation in the correct values, which for Pr = 10−2 , are around 10−2.05 . When Pr = 10−1 , there is remarkable more variation. For example, for parameters N = 32, I = 8 and M = 5, one should use Pr = 10−1.27 instead of Pr = 10−1 . Table II shows the corresponding results for the FCME algorithm. Therein, the correct TCME values are presented. For example, to achieve the desired clean sample rejection rate in noise-only case, for parameters N = 32, I = 12, M = 5 and Pr = 10−2 , the correct TCME value is 2.43. In this case, the original FCME parameter given by (3) is 2.32. In addition to the clean sample rejection rates in noise-only case, we have investigated false alarm and detection probabilities when samples containing signal components are present. Figs. 1 and 2 show the false alarm and detection rates for the forward CA when N = 32, I = 8, M = 5, Pr = 10−1 , and there are either 10 or 20 occupied channels amongst the set of 32 sensed channels. It can be seen
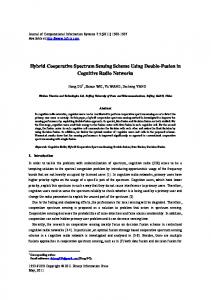
that even if more than half of the channels (20 out of 32) are occupied, the false alarm rates still stay rather close to the desired value. When outliers are weak, they do not have significant effect on the false alarm probability even when they are not found by the detection algorithm. When outliers become stronger and, consequently, easier to find, false alarm approach the desired value. The local minimum around 5 dB occurs between these two cases, since outliers are still rather weak and not detected but, on the other hand, they have enough power to affect the false alarm probability. The detection probabilities are only slightly, about 1–2 dB, smaller than those in the ideal case with known noise power. Figs. 3 and 4 show the corresponding results for the FCME algorithm. It can be seen that there are only small differences between the false alarm rates of the forward CA and the FCME methods. Detection performances are similar. In the case that there are not enough vacant channels, i.e., the assumed initial clean set is not actually clean, the theoretical upper limit on detection probability is N − I divided by the number of occupied channels. This upper limit is illustrated in Fig. 5. The corresponding false alarm probabilities were much smaller than the desired value. However, according to the NP approach, this is better than having too large false alarm probabilities. Note also that, in practice, decisions about occupied channels will be made based on several measurements so that even these limited
4 of 7
0
1
10
FCME, N=32, I=8, M=5, 10 Outliers FCME, N=32, I=8, M=5, 20 Outliers Obtained clean sample rejection rate
0.9 0.8 0.7 Detection rate
0.6
CA, N=32, I=8, M=5, 10 Outliers CA, N=32, I=8, M=5, 20 Outliers
0.5 0.4 0.3 Ideal threshold with known noise level
0.2
Ideal result
−1
10
0.1 0
−2
0
5
10
15 20 SNR [dB]
25
30
35
10
−20
−10
0 10 SNR [dB]
20
30
Figure 2. Detection rates of the forward cell averaging detector with N = 32 channels, I = 8, M = 5, and desired Pr = 10−1 , Rayleigh fading. The number of occupied channels: 10 and 20.
Figure 3. False alarm rates of the FCME algorithm with N = 32 channels, I = 8, M = 5, and desired Pr = 10−1 , Rayleigh fading. The number of occupied channels: 10 and 20.
detection probabilities may be sufficient. It is also possible to make measurements using several devices performing distributed/cooperative sensing. This also helps against the hidden terminal problem. If this is not the case, the approach has to be supplemented with additional protections against these possibilities, such as using known vacant channels. The problem of too large a number of occupied channels can also be alleviated by using a smaller initial set size, such as even a single sample. In this case, the theoretical limit on detection probability for N = 16 is 15/16 = 0.9375. Fig. 6 shows results with N = 16, I = 1, and M = 20. It is seen that the ideal theoretical value is not reached. Instead, the upper limit around 0.9 is achieved. These results are for channels with independent Rayleigh fading. In non-fading channels the performance was very poor when all samples were from occupied channels. Intuitively, this is because in non-fading channels there is not enough small values to form the initial set.
REFERENCES [1] FCC, “Notice of proposed rule making: Unlicensed operation in the TV broadcast bands,” ET Docket No. 04-186, May 2004. [2] ——, “Notice for proposed rulemaking: Facilitating opportunities for flexible, efficient, and reliable spectrum use employing cognitive radio technologies,” ET Docket No. 03-108, Dec. 2003. [3] T. X. Brown, “An analysis of unlicensed device operation in licensed broadcast service bands,” in Proceedings of the IEEE International Symposium on Dynamic Spectrum Access Networks, Baltimore, Maryland, Nov. 2005, pp. 11–29. [4] Shure, “ULX wireless system specification sheet.” [Online]. Available: http://www.shure.com/ProAudio/Products/ WirelessMicrophones/ssLINK/us pro ulx-specsheet [5] FCC, “Report and order: Facilitating opportunities for flexible, efficient, and reliable spectrum use employing cognitive radio technologies,” ET Docket No. 03-108, Mar. 2005. [6] J. Mitola III, “Cognitive radio: An integrated agent architecture for software defined radio,” Ph.D. dissertation, Royal Institute of Technology, Sweden, 2000. [7] C. R. Stevenson, G. Chouinard, and W. Caldwell, “Recommended practice for the installation and deployment of ieee 802.22 systems.” [Online]. Available: http: //www.ieee802.org/22/Rec-Practice 802.22 Tutorial.ppt
CONCLUSIONS Forward methods were studied for spectrum sensing based on a set of energy measurements. The noise power was assumed to be unknown. The results showed that the approach works as long there are at least few vacant channels amongst the set of sensed channels. 5 of 7
[8] W. A. Gardner, “Signal interception: a unifying theoretical framework for feature detection,” IEEE Trans. Commun., vol. 36, no. 8, pp. 897–906, Aug. 1988. [9] J. Benko, “A PHY/MAC Proposal for IEEE 802.22 WRAN Systems, Part 1: The PHY,” IEEE 802.2206/0004r1, Feb. 2006. [Online]. Available: http://www.ieee802.
sues in spectrum sensing for cognitive radios,” in Proceedings of the Annual Asilomar Conference on Signals, Systems and Computers, vol. 1, Pacific Grove, CA, Nov. 2004, pp. 772–776.
1 0.9
[11] A. Sahai, D. Cabric, N. Hoven, R. Tandra, S. Mishra, and R. Brodersen, “Spectrum sensing: fundamental limits and practical challenges,” in Proceedings of the IEEE International Symposium on Dynamic Spectrum Access Networks, Baltimore, Maryland, Nov. 2005. [Online]. Available: http://www.eecs.berkeley.edu/ ∼sahai/Presentations/
0.8 0.7 Detection rate
0.6 FCME, N=32, I=8, M=5, 10 Outliers FCME, N=32, I=8, M=5, 20 Outliers
0.5
[12] J. Lehtom¨aki, “Analysis of energy based signal detection,” Ph.D. dissertation, Faculty of Technology, University of Oulu, Finland, Dec. 2005. [Online]. Available: http://herkules.oulu.fi/ isbn9514279255/
0.4 0.3 Ideal threshold assuming known noise level
[13] A. Ghasemi and E. S. Sousa, “Collaborative spectrum sensing for opportunistic access in fading environments,” in Proceedings of the IEEE International Symposium on Dynamic Spectrum Access Networks, Baltimore, Maryland, Nov. 2005, pp. 131–136.
0.2 0.1 0
0
5
10
15 20 SNR [dB]
25
30
35
Figure 4. Detection rates of the FCME algorithm with N = 32 channels, I = 8, M = 5, and desired Pr = 10−1 , Rayleigh fading. The number of occupied channels: 10 and 20.
[15] J. Vartiainen, J. J. Lehtom¨aki, and H. Saarnisaari, “Doublethreshold based narrowband signal extraction,” in Proceedings of the IEEE Vehicular Technology Conference, vol. 2, Stockholm, Sweden, May 30–June 1 2005, pp. 1288–1292.
org/22/Meeting documents/2006 Mar/22-06-0004-02-0000 ETRI-FT-I2R-Motorola-Philips-Samsung-Thomson PHY Spec. doc [10] D. Cabric, S. M. Mishra, and R. W. Brodersen, “Implementation is-
[16] S. Shellhammer and G. Chouinard, “Spectrum sensing requirements summary,” July 2006. [Online]. Available: http://www.ieee802.org/22/Meeting documents/2006 Sept/ 22-06-0089-05-0000-Spectrum-Sensing-Requirements-Summary. doc
1
1
0.9
0.9 12/15
0.8 0.7
0.7
Theoretical limit: 12/14
0.6 Detection rate
12/16
0.5 0.4 CA, N=16, I=4, M=20, 14 Outliers CA, N=16, I=4, M=20, 15 Outliers CA, N=16, I=4, M=20, 16 Outliers
0.3 0.2 0.1 0
5
10
15 20 SNR [dB]
25
30
0.5 CA, N=16, I=1, M=20, 10 Outliers CA, N=16, I=1, M=20, 14 Outliers CA, N=16, I=1, M=20, 16 Outliers
0.4 0.3 0.2 0.1
Ideal threshold assuming known noise level 0
Theoretical limit: 15/16
0.8
0.6 Detection rate
[14] C. Cordeiro, “A cognitive PHY/MAC proposal for IEEE 802.22 WRAN systems,” IEEE 802.22-05/0105r1, Nov. 2005. [Online]. Available: www.ieee802.org/22/Meeting documents/ 2005 Nov/22-05-0105-01-0000 Philips-FT PHY-MAC Proposal Presentation.ppt
35
Figure 5. Detection rates of the forward cell averaging detector with N = 16 channels , I = 4, M = 20, and desired Pr = 10−1 , Rayleigh fading. The number of occupied channels: 14, 15 and 16.
0
Ideal threshold assuming known noise level 0
5
10
15 20 SNR [dB]
25
30
Figure 6. Detection rates of the forward cell averaging detector with N = 16 channels , I = 1, M = 20, and desired Pr = 10−1 , Rayleigh fading. The number of occupied channels: 10, 14 and 16.
6 of 7
35
[17] A. Sonnenschein and P. M. Fishman, “Radiometric detection of spread-spectrum signals in noise of uncertain power,” IEEE Trans. Aerosp. Electron. Syst., vol. 28, no. 3, pp. 654–660, July 1992. [18] S.-Y. Chang, W. Hu, R. Khalona, and E. Sofer, “IEEE 802.22 WRAN merger framework,” IEEE 802.22-06/0030r4, Mar. 2006. [Online]. Available: http://www.ieee802.org/22/Meeting documents/2006 Mar/ 22-06-0030-04-0000 Huawei-NextWave-Runcom-STMicro PHY-MAC Proposal Presentationl.ppt [19] J. Lehtom¨aki, M. Juntti, and H. Saarnisaari, “CFAR strategies for channelized radiometer,” IEEE Signal Processing Lett., vol. 12, no. 1, pp. 13–16, Jan. 2005. [20] R. Nitzberg, “Clutter map CFAR analysis,” IEEE Trans. Aerosp. Electron. Syst., vol. 22, no. 4, pp. 419–421, July 1986. [21] Y. Zeng and Y.-C. Liang, “Eigenvalue based sensing algorithms,” IEEE 802.22-06/0118-00-0000, July 2006. [Online]. Available: www.ieee802.org/22/Meeting documents/2006 July/ 22-06-0118-00-0000 I2R-sensing.doc [22] M. P. Olivieri, G. Barnett, A. Lackpour, A. Davis, and P. Ngo, “A scalable dynamic spectrum allocation system with interference mitigation for teams of spectrally agile software defined radios,” in Proceedings of the IEEE International Symposium on Dynamic Spectrum Access Networks, Baltimore, Maryland, Nov. 2005, pp. 170–179. [23] A. S. Hadi, “Identifying multiple outliers in multivariate data,” J. Royal Stat. Soc – Series B, vol. 54, no. 3, pp. 761–771, 1992. [24] H. Saarnisaari, P. Henttu, and M. Juntti, “Iterative multidimensional impulse detectors based on the classical diagnostic methods,” IEEE Trans. Commun., vol. 53, no. 3, pp. 395–398, Mar. 2005. [25] H. Urkowitz, “Energy detection of unknown deterministic signals,” Proc. IEEE, vol. 55, no. 4, pp. 523–531, Apr. 1967. [26] Z. Wang and P. K. Willett, “All-purpose and plug-in power-law detectors for transient signals,” IEEE Trans. Signal Processing, vol. 49, no. 11, pp. 2454–2466, Nov. 2001. [27] F. F. Digham, M.-S. Alouini, and M. K. Simon, “On the energy detection of unknown signals over fading channels,” in Proceedings of the IEEE International Conference on Communications, vol. 5, Anchorage, AK, May 2003, pp. 3575–3579.
7 of 7