J. King Saud Univ., Vol. 19, Eng. Sci. (1), pp. 95-133, Riyadh (1427H./2006)
Speech and Music Classification and Separation: A Review Abdullah I. Al-Shoshan Department of Computer Science, College of Computer, Qassim University, Saudi Arabia
[email protected] (Received 04 August 2003; accepted for publication 16 April 2006)
Abstract. The classification and separation of speech and music signals have attracted attention by many researchers. The purpose of the classification process is needed to build two different libraries: speech library and music library, from a stream of sounds. However, the separation process is needed in a cocktail-party problem to separate speech from music and remove the undesired one. In this paper, a review of the existing classification and separation algorithms is presented and discussed. The classification algorithms will be divided into three categories: time-domain, frequency-domain, and time-frequency domain approaches. The time-domain approaches used in literature are: the zero-crossing rate (ZCR), the short-time energy (STE), the ZCR and the STE with positive derivative, with some of their modified versions, the variance of the roll-off, and the neural networks. The frequency-domain approaches are mainly based on: spectral centroid, variance of the spectral centroid, spectral flux, variance of the spectral flux, roll-off of the spectrum, cepstral residual, and the delta pitch. The time-frequency domain approaches have not been yet tested thoroughly in literature; so, the spectrogram and the evolutionary spectrum will be introduced. Also, some new algorithms dealing with music and speech separation and segregation processes will be presented.
1.
Introduction
The problem of distinguishing speech from music has become increasingly important as automatic speech recognition (ASR) systems and it has been applied to more and more “real-world” multimedia domains [1-6]. If we wish to build systems that perform ASR on soundtrack data, for example, it is important to be able to distinguish which segments of the soundtrack contain speech [7]. Humans can separate speech from music easily in their mind without any influence of the mixed music [8-23]. Due to the new techniques of analysis and synthesis of speech signals, the musical signal processing has gained particular weight [16, 24], and therefore, the classical sound analysis techniques are used in processing music signals. Music art has a long and distinguished history. It goes back to the time of Greek and is developed through centuries in both the musical instruments and melodies [25-28]. There are many kinds of music such as: Classical, 95
Abdullah I. Al-Shoshan
96
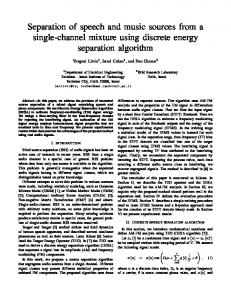
Rock, Pop, Disco, Jazz, Country, Latin, Electronic, Arabic, etc. [29]. Figure 1 shows the hierarchy of sound type signals [30]. Sound Music
Speech Jazz
Female
Rock
Hip Hop
Disco
Classical
Others
Country
String Quartet
Choir
Orchest
Piano
Sport Announcer
Male
Others
Others Fig. 1. The hierarchy of sound.
Audio signals change continuously and non-deterministically with time. Consequently, they are usually characterized as time averages, and their relative amplitude and frequency contents can be easily specified. As an example, speech and music typically have strong low-frequency energy and progressively weaker highfrequency content [31, 32]. Hence, generalized time and frequency audio signal spectra plots might look like those in Fig. 2 [33]. The frequency fmax varies according to audio signal kind; fmax equals 4 kHz in telephone transmitting quality, 5 kHz in monoloudspeaker recording, 6 kHz in stereo or multi-loudspeaker recording, 11 kHz in FM stereo broadcasting, and 22 kHz in CD quality recording. A m p li tu d e
A m p lit u d e
A m p litu d e
Or 2 .5 k
fm ax
A u d io s ig n a l sp ectru m
f
fm ax
f
fm ax
T w o k in d s o f a u d io fr e q u e n c y s p e c t r u m id e a l iz a t io n
Fig. 2. Generalized frequency spectrum for audio signal.
f
Speech and Music Classification and Separation: A Review
97
Acoustically, audio signals can be classified into the following classes: 1) Speech signal compounded of single talker in specific time period. 2) Completely music signal without any speech component. 3) Mixture of single talker speech and background music. 4) Songs; mixture of music with a singer voice. 5) Singing without music. 6) Abnormal music; uses acclaim cadence, single word cadence, human whistle sound, opposite reverberation or any non-music sound that has been inserted as a basic tone of the music melody. These cadences cannot be generated by any of the ordinary musical instrument except modern Organ and mainly processed by a major help of computers [4, 34-37]. 7) Speech signal compounded of two or more speakers talking simultaneously in a specific time period. A good algorithm for separating the sounds of two talkers taking simultaneously is using the cepstrum analysis proposed by Subbs and Summerfield [8]. 8) Non-speech and non-music signals: like car, motor, fan sounds, etc. 9) Complex sound mixture like multi-speakers or multi-singers with multi-music sources. Many systems exist for content-based classification and retrieval of images; however, little work has been done on the audio portion of the multimedia stream [31, 32]. Although all fields of signal processing have attracted a considerable number of researchers and have enjoyed success in recent years, and as new software techniques ride the surging waves of ever faster computers [34-38], a few of them have touched the discrimination and separation of music and speech signals. The rest of this paper is organized as follows. In Section 2, an introduction to the analysis and properties of speech and music signals is given, with a summary of the characteristics and differences between the two types of signals. In Section 3, the main algorithms for discriminating speech from music are summarized. In Section 4, two approaches to the separation of speech from music are introduced. 2.
Analysis of Speech and Music Signals
2.1. Speech signal 2.1.1. Representation of speech It is almost impossible to tackle the speech classification problem without first establishing some way of representing the spoken utterances by some group of symbols representing the sounds produced [39-43]. The letters symbols we use for writing are obviously not adequate, as the way they are pronounced varies; for example, in English, the letter "o" is pronounced differently in words "pot", "most" and "one". One way of representing speech sounds is by using phonemes. Formally, we can define the phoneme as a linguistic unit such that, if one phoneme is substituted for another in a word, the meaning of that word could change. This will only hold for a set of phonemes in one language; within a single language, a finite set of phonemes will therefore exist.
Abdullah I. Al-Shoshan
98
However, when different languages are compared, there are differences; for example, in English, /l/ and /r/ (as in "lot" and "rot") are two different phonemes, whereas in Japanese, they are not. Similarly, the presence of individual sounds, such as the "clicks" found in some sub-Saharan African languages, or the velar fricatives (introduced later) found in Arabic, are readily apparent to listeners fluent in languages that do not contain these phonemes. Still, as the vocal apparatus used in the production of languages is universal, there is much overlap of the phoneme sets, and the total number of phonemes is finite. Table 1 shows how the phonemes are subdivided into groups based on the way they are produced [44]. The variation between different sets will be dealt with later. It is also possible to distinguish between speech sounds based solely on the way they are produced. The units in this case are known as the phones. There are many more phones than phonemes, as some of them are produced in different ways depending on context. For example, the pronunciation of the phoneme /l/ differs slightly when it occurs before consonants and at the end of utterances (as in "people"), as opposed to other positions (e.g. in "politics"). The two phones are called the valorized and the non-valorized "l" respectively. As they are both different forms of the same phoneme, they form a set of allophones. Any machine-based speech recognizer would need to be aware of the existence of allophone sets [45]. Table 1. Phoneme categories of British English and examples of words in which they are used [44]
sail ship funnel thick hull zoo azure that valve
Affricates:
Fricatives:
was ran lot yacht
Plosives:
Semivowels:
bay by bow bough beer doer boar boy bear
Nasals:
Diphthongs:
Vowels: heed hid head had hard hod hoard hood who'd hut heard the
am an sang
bat disc goat pool tap kite
jaw chore
It is not just the speech organs involved that influence the way an utterance is spoken and subsequently interpreted. The stress, rhythm and intonation of speech are its prosodic features [39-44]. Stress is used at two levels: in sentences, it indicates the most important words, while in words it indicates the prominent syllables. For example, the word "object" could be interpreted as either a noun or a verb, depending on whether the stress is placed on the first or second syllable. Rhythm refers to the timing aspect of utterances. Some languages (e.g., English) are said to be stress-timed, with approximately equal time intervals between stresses (experiments have shown that,
Speech and Music Classification and Separation: A Review
99
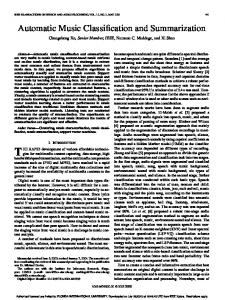
objectively, there is merely a tendency in this direction). The portion of an utterance beginning with one stressed syllable and ending with another is called a foot (by analogy with poetry). So, a four-syllable foot (1 stressed, 3 unstressed) would be longer than a single (stressed) syllable foot, but not four times longer. Other languages, such as French, are described as syllable-timed. Intonation, or pitch movement, is very important in indicating the meaning of an English sentence. In tonal languages, such as Mandarin and Vietnamese, the intonation also determines the meaning of individual words [46, 47]. 2.1.2. Speech production The range of sounds that we can produce is limited [39-44]. The pressure in the lungs is increased by the reverse process, which pushes the air up the trachea (wind pipe). The larynx, a bony structure covered by skin containing a slit-like orifice, the glottis (vocal cords), is situated at the top of the trachea. As the air flows through the glottis, local pressure falls, and eventually allows the laryngeal muscles to close the glottis, interrupting the flow of air. This in turn causes the pressure to rise again, forcing the vocal cords apart. The cycle repeats itself, producing a train of pulses. This process is known as phonation. The rest of the vocal tract, the oral and the nasal passages, acts as a filter, allowing the harmonics of the glottal waveform, which lie near the natural resonant frequencies of the tract to pass, whilst attenuating the others. Indeed, reasonable acoustic models of speech production have been created consisting of an excitation source driving a series of filters. So, what we get as a result of the above process is the acoustic wave radiated from the lips. To produce different sounds, we change the shape of the vocal tract by moving the jaw, tongue and lips so that the natural resonance occurs at different frequencies. In normal speech, the fundamental frequency will thus be changing all the time. However, the components of the larynx tone are always harmonics of the fundamental, and the effect of the resonance is to produce peaks in the spectrum of the output at the harmonics, which are the closest to the true resonance. This ensures that the spectrum of the resulting sound always has the same envelope (or general outline), although the fundamental frequency is continually changing. Thus, a certain sameness of quality is heard in a range of sounds with different fundamentals. If this was not the case, speech sounds could not fulfill the linguistic function that they in fact have. The peaks in the spectra described above thus correspond to the basic frequencies of the vibration of air in the vocal tract. These peaks depend on the shape of the vocal tract, and regions around them are called formants. Formants are most easily seen in sonograms (also called spectrograms and spectrographs). Sonograms represented an important breakthrough in speech research when they were invented, because they could conveniently represent the way speech spectra vary with time. They are basically plots of frequency versus time, with the darkness of the trace showing the intensity of the sound at a particular frequency. Figure 3 shows a sonogram for the four semivowels /w/, /r/, /l/ and /j/, as in the syllables "wer", "rer", "ler" and "yer". It can be seen that all initial semivowels have a rising first formant. The second formant of /w/ rises, while that of /j/ falls. Different groups of phonemes (as shown in Table 1) produce different sonograms, but phonemes within a
100
Abdullah I. Al-Shoshan
given group will usually have similar formants. These groups may be used to distinguish between different languages by considering the frequency of occurrence of phones, which will vary for identical phones in different languages.
Fig. 3. A sonogram for the four semivowels /w/, /r/, /l/ and /j/ [43].
2.1.3. Speech perception In speech research, a lot of effort has considered studying the way we as humans recognize and interpret speech [16, 39-43], which makes sense since the best and most accurate speech recognition (and language identification, for that matter) system in existence today is that which most of us possess. This field of study is still to answer many crucial questions, but a lot has been achieved to date. Research has shown that the two lowest formants are necessary to produce a complete set of English vowels, as well as that the three formants lowest in frequency are necessary for good speech intelligibility. More formants give more natural sounds. The situation is made more complex when dealing with continuous speech, as the speed at which some articulators can move is limited by their inertia. Consequently, there is sometimes no time for a steady vowel configuration to be reached before the tract must be changed for the next consonant, and the formants don't reach their target values. Other factors found to influence the perception of phonemes include duration and the frequency of the formants in the preceding utterance. Also, an interesting phenomenon, which has been called the “cocktail party effect”, has been investigated. When a number of conversations are being carried on simultaneously, it is usually possible to follow one, even if the total loudness of the others seems greater. Experiments have shown that the continuity of the fundamental frequency group’s events occurring at different times into the speech of a single speaker, and also that a common fundamental is a necessary (though not sufficient) condition for sounds to be grouped together as a stream. 2.1.4. History of speech identification Over the past few decades, there have been important changes in the way the problem has been approached. They are briefly summarized below [39-44]. The acoustic approach (pre-1960) The patterns of formant movements were analyzed in an attempt to recognize a word from a limited, predefined vocabulary (e.g., digits between 1 and 10). The systems performed well, but only when used by the speaker they were designed for. The usefulness of this method was limited by the fact that acoustic patterns of a word spoken on different occasions differs in duration and intensity, and the same
Speech and Music Classification and Separation: A Review
101
word produced by different persons produces patterns differing in frequency content as well. The pattern-recognition approach (1960-1968) Attempts were made to normalize the speech waveform in some way, so that comparisons with pre-defined patterns (words) could be made for a range of speakers. In particular, it was noted that the fundamental frequency could be used to normalize formant frequencies. Also, ways of normalizing the duration of patterns were investigated. The problem was still that such systems were only adequate for limited vocabularies. The linguistic approach (1969-1976) Early recognizers neglected the fact that, when two people communicate using speech, they must both use the same language. There are many sources of linguistic knowledge, which could be used to enhance various systems, such as pre-stored dictionaries, and the varying probabilities of a particular phoneme or word occurring after another one. This is referred to as phonotactics. Phonotactics deals with the rules that govern the combinations of the different phones in a language. There is a wide variance in such rules across languages. For example, the phone clusters /sr/ and /schp/ are common in Tamil and German respectively, but do not exist in English. The pragmatic approach (1977-1980's) The major advance that took place in isolated word recognizers was the use of dynamic programming algorithms, which enabled optimum non-linear timescale distortions to be introduced in the matching process. This improved the accuracy. Also, a number of more mathematically sophisticated algorithms were devised for other methods. A simplified representation of the complete physiological mechanism for producing speech can be found in [44]. The lungs and the associated muscles act as the source of air for exciting the vocal mechanism [24, 33, 39-43]. The muscle force pushes air out of the lungs (shown schematically as a piston pushing up within a cylinder) and through the bronchi and trachea. When the vocal cords are tensed, the air flow causes them to vibrate, producing so-called voiced speech sound. When the vocal cords are released in order to produce a sound, the air flow either must pass through a constriction in the vocal tract and thereby become turbulent, producing so-called unvoiced sound, or it can build up pressure behind a point of total closure within the vocal tract, and when the closure is opened, the pressure is suddenly and abruptly released, causing a bright transient sound. 2.1.5. Speech properties Speech is produced by the airflows from the lungs through the vocal folds and moves the larynx tube and vocal cords. Everyone has his own sound according to his organs physical dimensions. Using our human ear, we can distinguish between two
102
Abdullah I. Al-Shoshan
talkers talking simultaneously and may recognize them. Speech signal can be characterized by rapid rate of change of speech sounds. In other way, it can be considered as a noise like signal containing consonants [16, 33, 39-43]. We can figure out the speech signal as a continuous random signal [25]. Usually, 95% of the speech power is concentrated in frequencies below 4 kHz, and then it falls very fast through low-frequency values, and any components higher than 8 kHz [48]. 2.2. Music signal 2.2.1. Music generation Tone is the most basic component in music sound. There are two kinds of tone structures: a simple tone formed of single sinusoidal waveform and a complex tone formed of more than one harmonic [30, 49-51]. The tone quality depends on how little of non-harmonic frequency components. All classical musical tones come from a resonance frequency of moving or frictional parts of the musical instrument and some tones come from resonance tube except electronic music that produces its tone depending on electromagnetic force. Partials are any non-harmonic frequency components not a multiple of the fundamental frequency. Musical instrument manufacturers try to reduce partials. They try to make all musical sounds constructed of only harmonics with less-partial tones by producing wide band tones, covering all audible bands. Even though, all musical instruments usually produce partials that are not harmonically related to the fundamental frequency [52]. Furthermore, in correlating sound, spectra with instruments have led to another concept to explain differences in tone quality. This concept assumes that a given instrument has a sound spectrum characterized by a particular harmonic structure, which would ideally be the same for each tone of the instrument. Instead, the alternative new concept suggests that an instrument has a certain fixed frequency region or regions in which harmonics of a tone are emphasized, regardless of the frequency of the fundamental or partial components. A fixed frequency region of this kind is called a formant, and it is the location of these formant regions that characterizes the instrument [25]. However, there is no musical instrument restricting its formants boundaries. Finally, the most common concept of tone quality depends on subjective acoustic properties careless of partials or formants. For example, the violinists adjust the tension of violin’s chord manually to reach the desired tone by just hearing, so there is no useful meaning of harmonics or fundamental frequency in this case [53, 54]. Musical production depends deeply on the musical instrument kind. The common kinds of music instruments can be summarized as follows: 1)
2)
String instruments: Their tones come from vibrating chords made from horsetail hair, cat’s small intestine or other manufactured material like plastic or copper. This vibration is achieved by direct swing like guitar or by drawing, across chords, a properly constructed bow in a certain angle like violin. Every chord has a certain fundamental frequency so that a single musical instrument covers all audible bands. This kind produces complex tones. Woodwind instruments: Mainly woodwind instruments consist of an open
Speech and Music Classification and Separation: A Review
3)
4)
5)
6)
103
cylindrical tube at both ends like flute. Openings in this kind’s wall define the length of the standing resonance wave and allow it to radiate the sound. Some woodwind instruments use small-vibrated copper piece to produce musical tones like accordion. This kind of instrument produces harmonic tones. Brass instruments: This kind depends on blowing like woodwind, but two main differences characterize these two kinds: the first difference is that the brass kind has a shape of animal horn like tuba; however, the second difference is that woodwind kind depends on the pressure of blowing to produce various tones while brass kind depends on manual valves to control cavity size like trumpet or special handle to vary tube length like trombone. Brass kind has a huge number of non-harmonics existed in its spectrum. Piano family instruments: This kind uses vibrating strings as tone source by kicking it with a wooden hammer controlled by keyboard. Every single button of the keyboard is designed to produce a single tone. The tone amplitude depends on kicking force by pianist finger. Some manufactures put copper vibrating bars instead of strings. Pure harmonics have the majority of produced tone power. Percussion instruments: Like drums, copper tam-tam, vibrating bars or carillon, kicking with baton plays all. Baton is a special wooden, plastic or metal rod. Specifications of the produced tones depend on the physical dimensions and the strength and position of the baton kick. Most of the power of tones produces nonharmonic components. Electronic production of music: Organ is the most qualified, robust and accurate musical instrument; it has so many buttons in its large keyboard. Also, it has a memory in which it can store any note and use it frequently as a basic cadence or tone. It can play continually a background melody to let the music player add only some musical touches to complete the main melody. Rock, pop, disco and jazz cannot stand without organ help [29, 35, 36]. Although all organ special cadences are built up using computers after very precise calculations [34, 37], any sound from anywhere can be recorded then be used as a basic cadence. Although organ is the biggest and the most expensive musical instrument, it is not the only electronic musical producer. There are many of those instruments kinds with many sizes, names and brands in the market so that any person can easily buy and play his own electronic melodies. Finally, it is very important to mention that there is no need to think about harmonics or fundamental frequency to measure tone quality if the electronic musical instruments are used for music production.
2.2.2. Music properties Music spectrum has twice the bandwidth of speech spectrum. In general, most of the signal power in audio waveform (speech or music) is concentrated at lower frequencies. Music specifications depend on the kind of played musical instruments and its physical dimensions. Musicians and melodists divide musical minor to eight parts, each part named octave and each octave is divided into seven parts (tones) [30]. These tones are named (Do, Re, Me, Fa, So, La and Se) or simply (A, B, C, D, E, F and G).
Abdullah I. Al-Shoshan
104
This deviation is made according to the tone frequency. For different instrument, a tempered scale is shown in Table 2. The tone (A1) at the first octave has the fundamental frequency of the first tone in each octave, that means every first tone takes the reduplicate frequency of the first tone of previous octave, (i.e., An = 2nA1 or Bn =2n B1) and so on where n∈{2, 3, 4, 5, 6, 7}. In one octave, every tone has its own frequency and the musical instrument has to produce a tone around its specific frequency. Looking at the tempered scale shown in Table 2, we note that the highest tone C8 is at the frequency of 4186 Hz, which is the highest frequency used in human sound. This means that musical instrument manufactures try their best to bound music frequency to the human’s sound limits to achieve strong concord [34, 53, 54]. In the actual world, the musical instruments cover more than audible band (approximately 20 kHz). Table 2. Frequencies of notes in the tempered scale [3] A Hz A 1 27.5 A 2 55 A 3 110 A 4 220 A 5 440 A 6 880 A 7 1760 A 8 3520
B Hz B 1 30.863 B 2 61.735 B 3 123.47 B 4 246.94 B 5 493.88 B 6 987.77 B 7 1975.5 B 8 3951.1
C Hz C 1 32.703 C 2 65.406 C 3 130.81 C 4 261.63 C 5 523.25 C 6 1046.5 C 7 2093 C 8 4186
D Hz D 1 36.708 D 2 73.416 D 3 146.83 D 4 293.66 D 5 587.33 D 6 1174.7 D 7 2349.3
E Hz E 1 41.203 E 2 82.407 E 3 164.81 E 4 329.63 E 5 659.26 E 6 1318.5 E 7 2637
F Hz F 1 43.654 F 2 87.307 F 3 174.61 F 4 349.23 F 5 698.46 F 6 1396.9 F 7 2793
G Hz G 1 48.999 G 2 97.999 G 3 196 G 3 4 92 G 5 783.99 G 6 1568 G 7 3136
2.3. Characteristics and differences between speech and music The speech signal is a slowly time varying signal in the sense that, when examined over a sufficiently short period of time “between 5 and l00 msec,” its characteristics are fairly stationary; however, over long periods of time (on the order of 1/5 seconds or more), the signal characteristics change to reflect the different speech sounds being spoken. A typical example of speech signal is shown in Fig. 4, which shows the time waveform corresponding to the sounds in the phrase ". . . very good night . . ." as spoken by a male speaker.
Speech and Music Classification and Separation: A Review
105
A m p litu d e
1 0 -1
0
(a )
2 S econ ds
A m p litu d e
0
(b )
22 kH z
(c)
22kH z
P h a se (r a d ia n s)
5 0 -5
0
Fig. 4. A typical example of speech signal of speaking the two-second long phrase “very good night”: (a) Time domain (b) Spectrum, and (c) Phase.
Figure 5 is a typical example of music portion; it is clear from the spectrum that it is possible to distinguish if the spectrum is originally speech or music. 1
A m p litu d e
0 0
(a )
2 S econ d
A m p litu d e
0 5
(b )
22 kH z
(c)
22 kH z
P h a se R a d ia n s
0 -5
0
Fig. 5. A typical example of music signal for two-second long: (a) Time domain, (b) Spectrum, and (c) Phase.
The frequency spectrum and the evolutionary spectrum of the average of 500 different speech and music specimens are shown in Figs. 6 and 7, respectively.
Abdullah I. Al-Shoshan
106 A m p lit u d e
1
0 4 k H z
8 k H z
2 2 k H z
(a )
A m p lit u d e
0 .7 5
0
(b )
1 7 k H z
2 2 k H z
Fig. 6. Speech and music spectrum computed from averaging 500 different specimens: (a) Speech, (b) Music.
(a)
(b)
Fig. 7. Evolutionary spectrum of speech and music computed from averaging 500 different specimens: (a) Speech, (b) Music.
In this section, we will briefly discuss some of the main differences between speech and music. These differences can be summarized as follow: Tonality: Tone means pure sinusoidal waveform, or a single harmonic, without pitches, of a periodical signal. Music tends to be composed of a multiplicity of tones, each with a unique distribution of harmonics. This pattern is consistent regardless of the type of music or instruments [47, 52, 55-57], while in speech care much about his voice tonality. Alternative sequence: Speech exhibits an alternating sequence of noise-like segment while music alternates in more tonal shape. In other words, speech signal is distributed through its spectrum more randomly than music does.
Speech and Music Classification and Separation: A Review
107
Bandwidth: Speech has usually 90% of its power concentrated in frequencies lower than 4 kHz (and limited to 8 kHz), whereas music can extend through the upper limits of the ear's response at 20 kHz. In general, most of the signal power in music waveforms is concentrated at lower frequencies [52, 58]. Power distribution: The power distribution in the power spectral density of speech signal is different from music signal; usually the power of speech concentrates at low frequencies then collapses very fast trough the higher values of frequency without DC value while there is no specific shape of the music spectrum and perhaps it contains DC. Therefore, we can say that the power of the speech concentrates at some areas different than the case of music [59]. Fundamental frequency: If a specific person talks alone, we configure almost accurate fundamental frequency. However, it is not the case for a specific music instrument. Dominant frequency: For a specific person talking alone, we can accurately assign his unique dominant. In a single play of a specific musical instrument, we can only determine average dominant. That is because the amplitude reaches its maximum in wide spectrum range. The case will be worst for multi-musical instruments. Excitation patterns: The excitation signals (pitch) for speech are usually existed only over a span of three octaves, while the fundamental music tones can span up to six octaves [60]. Tonal duration: The duration of vowels in speech is very regular, following the syllabic rate. Music exhibits a wider variation in tone lengths, not being constrained by the process of articulation. Hence, tonal duration would likely be a good discriminator. Energy sequences: A reasonable generalization is that speech follows a pattern of high-energy conditions of voicing followed by low-energy conditions, which the envelope of music is less likely to exhibit. Zero crossing rate (ZCR): The ZCR in music is grater than that in speech. We can use this idea to design a discriminator [60]. Consonants: Speech signal contains too many consonants while music is usually continuous through the time [33]. We can easily note that the strong temporal variation is the amplitude of the speech signals. Also, the short-terms (peaks and valleys) change over a short period of time. The main differences between speech and music signals can be summarized in Table 3.
Abdullah I. Al-Shoshan
108
Table 3. The main differences between speech and music signals Key difference Speech Phonemes Units of analysis •
Spectral structure
• • • •
Temporal structure
• • • • •
Syntactic/Semantic structure
Largely harmonic (vowels, voiced consonants). Tend to group in formants. Some inharmonic stops. Short (40ms–200ms). More steady state than dynamic. Timing unstrained but variable. Amplitude modulation rate for sentences is slow (~ 4 Hz) Symbolic, Productive, Can be combined in grammar
Music Notes Finite •
Largely harmonic, some inharmonic (percussion).
•
Longer (600-1200 ms). Mix of steady-state (strings, winds) and transient (percussion). Strong periodicity. Symbolic Productive, Combined in a grammar
•
• • • •
Overlap in speech and music signal is, in general, very strong so that there is no ordinary filter that can separate them from each other. Speech covers the spectrum from near zero to 3.5 kHz with an average dominant frequency =1.8747 kHz. However, from the classical theorem of music, the lowest fundamental frequency (A1) is about 27.5 Hz and the highest tone C8 is around the frequency of 4186 Hz. Therefore, a musical instrument manufacture tries to bound music frequency to the human’s sound limits to achieve strong consonant and also strong frequency overlap. Moreover, music propagates over all the audible spectrum and covers more than audible band (20 kHz), with an average dominant frequency = 1.9271 kHz. Also, a music instrument in general has many fundamental frequencies while the speech of a specific person has only unique fundamental frequency, and we can assign more accurately a dominant frequency for a specific person speech while it is not the case in a specific music instrument. For a music instrument, every tone kind (i.e., A) has a special fundamental and for a peace of music played by many instruments we will get too many fundamentals. So, we cannot think about reconstructing the music sound by depending only on fundamentals [25]. 3.
Speech and Music Classification
In this section, the main classification approaches are discussed. These approaches can be classified into three categories: (1) time-domain, (2) frequency domain, and (3) time-frequency domain types. El-Maleh [61, 62] has developed a two-level music and speech classifier and used long-term features such as differential parameters, variance, time-averages of spectral parameters, and zero crossing rate (ZCR). Saunders [60] has also proposed a two-level algorithm for discrimination based on the average ZCR and the short-time energy (STE) features, and applied a simple threshold procedure. Matityaho and Furst [63] have developed a neural network based model for classification of music type. They have designed their model based on human cochlea functional
Speech and Music Classification and Separation: A Review
109
performance. Hoyt and Wecheler [64] have developed a neural network base model for speech detection, but they have used the Hamming filter, Fourier transform and a logarithmic function as pre-processing before neural network input and used a simple threshold algorithm to detect speech from music, traffic, wind or any interfering sound. Also, they have suggested another wavelet transform feature as an option of preprocessing to improve the performance. Their work is similar to the work done by Matityaho and Furst’s [63]. Scheirer and Slaney [65] examined 13 features, some of them are modifications of each other intended to measure conceptually distinct properties of speech and/or music signals, and combined them in several multidimensional classification frameworks. For the datasets they used, the best classifier classifies with 5.8% error on a frame-by-frame basis, and 1.4% error when integrating long (2.4 seconds) segments of sound. Using long-term features, like cepstrum pitch or spectral centroid, consumes large delay without worth increase in overall discrimination precision. It was observed that the most powerful discrimination features are the ZCR and the STE; therefore, they will be discussed in more details. In general, the music and speech discrimination process found in literature can be classified into the following algorithms: I.
II.
Time-domain approaches: 1) The ZCR [38, 60-62, 65, 66, 124-130]: (a) Standard deviation of first order difference of ZCR. (b) Third central moment about the mean of ZCR. (c) Total number of zero crossing exceeding a threshold. 2) The STE [60, 62, 65, 66]. 3) ZCR and STE positive derivative [66]. 4) Variance of the roll-off feature [31, 59]. 5) Pulse metric [31, 59, 67-69]. 6) Number of silent segments [32]. 7) Hidden Markov Model (HMM) unit [70-72]. 8) Neural networks [12, 49, 58, 63, 72-108]. 9) Number of silent segments [60, 62, 65, 66]. Frequency-domain approaches [31, 32, 59, 99, 100, 109, 124-130]: 1) Spectrum: (a) Spectral centroid. (b) Mean and variance of the spectral flux. (c) Mean and variance of the spectral centroid. (d) Variance of the spectral flux. (e) Roll-off of the spectrum. (f) Bandwidth of signal. (g) Amplitude. (h) Delta amplitude. 2) Cepstrum [110]: (a) Cepstral residual [111, 112]. (b) Variance of the cepstral residual [111, 112].
Abdullah I. Al-Shoshan
110
III.
(c) Cepstral feature [111, 112]. (d) Pitch [82, 95, 96, 105-107, 113, 114]. (e) Delta pitch [76, 107]. Time-frequency domain approaches: 1) Spectrogram [13, 19, 74, 115]. 2) Evolutionary spectrum [116, 117].
3.1. Time-domain approaches 3.1.1. The zero crossing rate The ZCR of the time domain waveform is one of the most indicative and robust measures to discern voiced speech. It has widely used in practice as a strong measure to discern fricatives from voiced speech [38]. The ZCR is simply the count of crossing the zero throw fixed window size. It is said to occur if successive samples have different algebraic signs. Equation (1) defines the required computation for ZCR. Zn =
1 2N
N
∑
| sgn[x(m)] − sgn[x(m − 1)] |
(1)
m = n − N +1
where Zn is the ZCR, sgn[x(n)] = 1 when x(n) > 0, sgn[x(n)] = -1, when x(n) < 0, and N is the number of samples in one window. Obviously, the ZCR is a time-domain algorithm and it deeply depends upon the frequency of the input signal x(n). Moreover, the sampling rate should be high enough to illustrate any crossing through zero. In addition, the most important thing that must be thought about before starting counting the crossing is normalizing the signal so that the amplitude average through the window should be equal to zero using constant shift to every sample in the amplitude axis. This constant should be equal to the actual amplitude average [38]. That means readjusting the balance of the ZCR. This will ensure that every widow has only one specific ZCR. From Eq. (1), it is clear that the ZCR is proportional to the dominant frequency of x(n), so it can be concluded that the ZCR of music is usually bigger than that of speech. However, there is an abrupt increase of ZCR in speech due to strongly unvoiced speech. This is a pitfall in this informer because, in some regions, the ZCR of speech exceeds the ZCR of music. Properties of the ZCR: The ZCR of a signal has many properties [38], which can be summarized as follows: 1) The dominant frequency (DF) principle: If a signal is a pure sinusoidal waveform, the dominant frequency is the only one in the spectrum. This frequency equals the number of zero crossings of the signal in one second. In other words, it equals the value of the ZCR if the rate is taken every second. For non-sinusoidal periodic waveform, the dominant frequency has the largest amplitude. An accurate dominant frequency (w0) can be calculated using the formula:
Speech and Music Classification and Separation: A Review
wo =
π E{Do } N −1
111 (2)
where Do is the ZCR per second, N is the number of intervals and E{.} always denotes the expected value. 2) Highest frequency detection: Since D0 denotes the ZCR of a discrete-time signal Z(i), let us assume that D1 is the ZCR of the first derivative of Z(i), and Dn denotes the ZCR of the nth derivative of Z(i). The highest frequency Wmax in the signal can be approached using the following equation:
W max = lim
i→ ∞
πE{D i } N −1
(3)
where N is the number of samples. If the index i reaches 10, then the change in Wmax can be ignored if the sampling rate equals 11 kHz. 3) Lowest frequency detection: In discrete-time signals, an approximate derivative ∇ of a signal Z(i) can be evaluated by simply subtracting the amplitude of a sample from the amplitude of the previous sample, assuming that the time between any two samples is normalized to unity, so:
∇Z(i) = Z(i) – Z(i–1) Let Dn denotes the ZCR of the nth derivative of Z(i). If we define ∇ + as the positive derivative operator, then ∇ + [Z(i)] can be defined as:
∇ + [Z(i)] = Z(i) + Z(i–1)
(4)
Also, let nD be the ZCR of the nth positive derivative of the signal Z(i). Then the lowest frequency Wmin of a signal can be described as:
lim i →∞
πE{ iD} =Wmin N −1
(5)
From the previous information about dominant, maximum and minimum frequencies of a signal, we can have a brief shape of the signal spectrum. 4) Periodicity measure: A signal is said to be purely periodic if and only if: E{ 1 D} E{ 2 D} = N −1 N −1
(6)
Abdullah I. Al-Shoshan
112
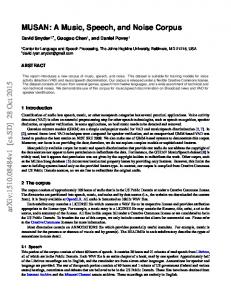
and as these two sides close to each other as the signal becomes more periodic. Using this measure, music was found to be more periodic or more tonal than speech [46, 47, 55-57, 118]. High zero-crossing rate ratio (HZCRR) The ZCR has proved to be very useful in characterizing different audio signals. It was used in many previous speech/music classification algorithms. It was experimentally found [66] that the variation of the ZCR is more discriminative than the exact value of the ZCR, so the HZCRR can be considered as one feature. The HZCRR is defined as the ratio of the number of frames whose ZCR are above 1 fold average zerocrossing rate in one-second window, and can be expressed as:
HZCRR =
1 2N
N −1
∑[sgn(ZCR(n) − ZCR
av
n=0
) +1
N −1
ZCRav = ∑ ZCR (n)
(7)
(8)
n=0
where n is the frame index, N is the total number of frames in a one-second window, sgn[.] is a sign function and ZCR(n) is the zero-crossing rate at the nth frame. In general, speech signals are composed of alternating voiced sounds and unvoiced sounds in the syllable rate, while music signals do not have this kind of structure. Hence, for speech signal, the variation of the ZCR (or the HZCRR) will be greater than that of music, as shown in Fig. 8.
Fig. 8. Music and speech sharing some values [65].
Speech and Music Classification and Separation: A Review
113
3.1.2. Short-time energy The amplitude of the speech signal varies appreciably with time. In particular, the amplitude of unvoiced segments is generally much lower than the amplitude of voiced segments. The short-time energy (STE) of the speech signal provides a convenient representation that reflects these amplitude variations. Since the music signal does not contain unvoiced segments, its STE is usually bigger than that in speech case [60]. Given a discrete-time signal s(n), we define its energy as:
ES =
∞
∑
s(n)
2
(9)
n = −∞
The power of a discrete-time signal s(n) is defined as: N 1 | s ( n) 2 | ∑ N →∞ 2 N + 1 n=− N
Ps = lim
(10)
Table 4. Types of signals Energy 0