N.J. Nalini et.al / International Journal of Engineering and Technology (IJET)
Speech Emotion Recognition Using Residual Phase and MFCC Features N.J. Nalini1, S. Palanivel2, M. Balasubramanian3 1,2,3
Department of Computer Science and Engineering, Annamalai University Annamalainagar – 608 002. Tamilnadu, India. 1
[email protected] 2
[email protected] 3
[email protected]
Abstract--The main objective of this research is to develop a speech emotion recognition system using residual phase and MFCC features with autoassociative neural network (AANN). The speech emotion recognition system classifies the speech emotion into predefined categories such as anger, fear, happy, neutral or sad. The proposed technique for speech emotion recognition (SER) has two phases : Feature extraction, and Classification. Initially, speech signal is given to feature extraction phase to extract residual phase and MFCC features. Based on the feature vectors extracted from the training data, Autoassociative neural network (AANN) are trained to classify the emotions into anger, fear, happy, neutral or sad. Using residual phase and MFCC features the performance of the proposed technique is evaluated in terms of FAR and FRR. The experimental results show that the residual phase gives an equal error rate (EER) of 41.0%, and the system using the MFCC features gives an EER of 20.0%. By combining the both the residual phase and the MFCC features at the matching score level, an EER of 16.0% is obtained. Keyword—Mel frequency cepstral coefficients, Residual phase, Autoassociative neural network, Speech emotion recognition. I. INTRODUCTION Speech recognition is an area of great interest for human-computer interaction. Today’s speech systems may reach human equivalent performance only when they can process underlying emotions effectively [1]. Recognizing emotions from speech signal may not be straightforward due to the uncertainty and variability in expressing emotional speech. One should appropriately utilize the knowledge of emotions while developing the speech systems (i.e. Speech recognition, speaker recognition, speech synthesis and language identification). It is essential to have a framework that includes various modules like, feature extraction, feature selection and classification of those features to identify the emotions. The classifications of features involve the training of various emotional models to perform the classification appropriately. Another important aspect to be considered in emotional speech recognition is the database used for training the models. Then the features selected for classification must be salient to identify the emotions correctly. The integration of all the above modules provides us with an application that can recognize the emotions. Emotion recognition is used in various applications such as on-board car driving system [2], call center applications [3] and has been employed as a diagnostic tool in medicine [4]. Interactive movie, storytelling and E-tutoring applications [5] would be more practical, if they can adapt themselves to listeners’ or students emotional states. The emotions in speech are useful for indexing and retrieving the audio/video files from multimedia [6]. Emotion analysis of telephone conversation between criminals would help crime investigation department. In speech production mechanism, one can review the speech as the joint contribution of both vocal tract system and excitation source [7], [8]. This indicates that the information present in the speech such as: message, language, speaker and emotion is present in both excitation source and vocal tract characteristics. The perceptual study has been carried out to analyze the presence of emotion-specific information in (1) excitation source, (2) the response of vocal tract system and (3) combination of both. Among the different speech information sources, excitation source information is treated almost like a noise and not contain information beyond the fundamental frequency of speech (because it mostly contains unpredictable part of the speech), and grossly ignored by speech research community. However, systematic study has not been carried out on speech emotion recognition using excitation information. The linear prediction (LP) residual represents the prediction error in the LP analysis of speech, and it is considered as the excitation signal to the vocal tract system, while producing the speech and their residual phase (RP) is defined as the cosine of the phase function of the analytic signal derived from the LP residual of speech signal.
ISSN : 0975-4024
Vol 5 No 6 Dec 2013-Jan 2014
4515
N.J. Nalini et.al / International Journal of Engineering and Technology (IJET)
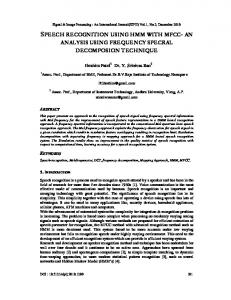
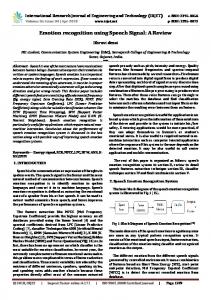
Many features have been used to describe the shape of the vocal tract during emotion speech production. Mel frequency cepstral coefficients (MFCC) and linear prediction cepstral coefficient (LPCC) are commonly used spectral features to contain vocal tract information. In this work, residual phase and MFCC features are used for recognizing the emotions. The rest of the paper is organized as follows: A review of literature for emotion recognition is given in Section II. Section III explains the proposed speech emotion recognition system. The extraction of residual phase and the MFCC features are described in Section IV. Section V gives the details of AANN model used for emotion recognition. Experiments and results of the proposed work are discussed in Section VI. Summary of the paper is in Section VII. II. RELATED RESEARCHES: A REVIEW Emotion recognition is a pattern classification problem consists of two major steps, feature extraction and classification. In this section, features and models used for emotion recognition are described. Chauhan, A. et al [9] have explored the linear prediction (LP) residual of speech signal for characterizing the basic emotions. The emotions considered are anger, compassion, disgust, fear, happy, neutral, sarcastic and surprise. LP residual mainly contains higher order relations among the samples. For capturing the emotion specific information from these higher order relations, autoassociative neural network (AANN) and Gaussian mixture models (GMM) are used. The emotion recognition performance is observed to be about 56.0%. Shashidhar G. Koolagudi et al [10] have presented the importance of epoch locations and LP residual for recognizing the emotions using speech utterances. Epoch locations are obtained from zero frequency filtered speech signal and the LP residual is obtained using inverse filtering. AANN model are used to capture emotion specific information from excitation source features Four emotions considered are anger, happy, neutral and sad. A semi-natural database is used for modeling the emotions. Average emotion recognition of 66% and 59% is observed respectively for the epoch based and entire LP residual samples. Yongjin Wang et al [11] have explored a systematic approach for recognition of human emotional state from audiovisual signals. The audio characteristics of emotional speech are represented by the extracted prosodic, Mel-frequency Cepstral Coefficient (MFCC), and formant frequency features.. The visual information is represented by Gabor wavelet features. The characteristics of individual emotion, a novel multiclassifier scheme is proposed to boost the recognition performance. Set of six principal emotions: happiness, sadness, anger, fear, surprise, and disgust were considered. The multiclassifier scheme achieves the best overall recognition rate of 82.14%. Shasidhar G. Koolagudi et al [12] explores short term spectral features for Emotion Recognition. Linear predictive cepstral coefficients (LPCC), mel frequency cepstral coefficients (MFCC) and log frequency power co-efficients (LFPC) are explored for classification of emotions. The short-term speech features vector quantizer (VQ) models used in this paper. Indian Institute of Technology, Kharagpur-Simulated Emotion Speech Corpus (IITKGP-SESC) was used for emotion recognition task. The emotions considered are anger, compassion, disgust, fear, happy, neutral, sarcastic and surprise. The recognition performance of the developed models was observed to be 60.0%. In some previous studies, significant research has been carried out on emotion recognition including using some of the known features such as pitch, duration, energy, articulation, MFCC, linear prediction and spectral shapes. Nicholson et al used prosodic and phonetic feature for recognizing eight emotions using a neural network classifier and reported 50.0% accuracy [13].. Eun Ho Kim et al achieved 57.2% recognition rate with a spectral flatness measure to a spectral center (RSS) and hierarchal classifier [14]. There are several pattern classifiers being used for developing speech system. In this study autoassociative neural network (AANN) is used. In excitation source features higher order relations are present which is highly nonlinear in nature. The intension is to capture the higher order relationships through AANN model. In our study residual phase with MFCC features and AANN classifier is used to recognize the emotions III. PROPOSED SPEECH EMOTION RECOGNITION SYSTEMS The proposed work has the following steps and it is shown in Fig. 1. •
The excitation source and spectral features such as residual phase and MFCC are extracted from the speech signals.
•
Distribution of residual phase and mfcc features is captured using autoassociative neural networks for each emotion such as anger, fear, happy, neutral or sad.
•
The performance of the speech emotion recognition system is evaluated in terms of FAR, FRR and accuracy.
ISSN : 0975-4024
Vol 5 No 6 Dec 2013-Jan 2014
4516
N.J. Nalini et.al / International Journal of Engineering and Technology (IJET)
Classified emotion
Speech data Fig. 1. Proposed speech emotion recognition system.
IV. FEATURE EXTRACTION Feature extraction involves analysis of speech signals. Speech signals are produced as a result of excitation of the vocal tract by the source signal. Speech features can therefore be found both in vocal tract as well as in the excitation source signal. In this paper residual phase and MFCC are used as an excitation source and vocal track features A. Residual Phase (RP) In a linear prediction analysis [15] each sample is predicted as a linear combination of past p samples. According to this model the nth sample of speech signal can be approximated by a linear weighted sum of p previous samples. Let us define the prediction error E (n ) as the difference between speech signal sample M s (n ) and its predicted value Mˆ s (n) is given by p
a
Mˆ s (n) = −
k
M s (n − k )
(1)
k =1
Where, p is the order of prediction, a k ,1 ≤ k ≤ p is a set of real constants representing the linear predictor coefficients (LPCs). Energy in the prediction error signal is minimized to determine the weights called the LP coefficients (LPC's). The difference between the actual value and the predicted value is called the prediction error signal or the LP residual. The LP residual E (n ) is given by:
E(n) = M s (n) − Mˆ s (n) Where,
(2)
Ms (n) is actual value, Mˆ s (n) is predicted value
From (2), p
E ( n) = M s ( n ) +
a
k M s (n − k )
(3)
k =1
The residual phase is defined as the cosine of the phase function of the analytic signal derived from the LP residual of a speech signal. Hence, we propose to use the phase of the analytic signal derived from the LP residual. The analytic signal E a (n ) corresponding to E (n ) is given by E a ( n) = E ( n) + jE h ( n)
Where,
(4)
Eh (n) is the Hilbert transform of E (n ) and is given by E h (n) = IFT [ R h (ω )]
(5)
Where − jR (ω ), 0 ≤ ω < π R h (ω ) = jR (ω ),0 > ω ≥ −π
Where R (ω ) is the Fourier transform of E (n ) , and IFT denotes the inverse Fourier transform. The magnitude of the analytic signal
Ea (n) is given by
E a (n) =
ISSN : 0975-4024
E 2 (n) + E h 2 (n)
Vol 5 No 6 Dec 2013-Jan 2014
(6)
4517
N.J. Nalini et.al / International Journal of Engineering and Technology (IJET)
and the cosine of the phase of the analytic signal cos(θ ( n )) =
E a (n ) is given by
Re( E a ( n)) E ( n) = E a (n) E a ( n)
(7)
Where, Re( E ( n )) is real part of E (n ) . A segment of speech signal, its LP residual, the Hilbert transform of the LP residual, the Hilbert envelope, and residual phase is shown in Fig. 5. During LP analysis only the second-order relations are removed, the higher order among the samples of the speech signal are retained in residual phase. It is reasonable to expect emotion specific information on the higher order relations among the samples is complementary to the spectral features. In LP residual the region around the glottal closure (GC) instants used for extracting the information contains speech emotions. This information about the glottal closure (GC) is used for selecting residual phase segments among the speech samples. B. Mel Frequency Cepstral Coefficients (MFCC) Mel frequency cepstral coefficients (MFCC) [19] have proven to be one of the most successful feature representations in speech related recognition tasks. The mel-cepstrum exploits auditory principles, as well as the decorrelating property of the cepstrum. Computation of MFCC features for a segment of speech signal which is explained as follows: 1) Pre-emphasis: The aim of pre-emphasis is to compensate the high frequency part that was suppressed during the sound production mechanism of humans. Also, it can amplify the importance of high-frequency formants. The speech sample signal is given in the form of the wave file M s (n ) is sent to the high pass filter. M
p
( n ) = M s ( n ) − a * s ( n − 1)
(8)
Where, M p (n ) is the output pre-emphasis signal. 2) Frame blocking: After pre-emphasis, the input speech signal is segmented into frames with optimal overlap of the frame size. 3) Hamming windowing: In order to keep the continuity of the first and last points in the frame, each frame has to be multiplied with a hamming window. If the speech signal of a frame is illustrated by M s (n), n = 0,1,...N − 1 , then the signal after hamming window windowing is M s ( n ) * W ( n ) and it is defined by W ( n , a ) = (1 − a ) − a cos( 2 pn /( N − 1)),
0 ≤ n ≤ N −1
(9)
4) Fast Fourier Transform: Spectral analysis illustrates that different feature from speech signals corresponds to the different energy distribution over frequencies. Therefore we usually perform FFT to obtain the magnitude frequency response of each frame. When we perform FFT on a frame, we assume that the signal within a frame is periodic, and continuous when wrapping around. 5) Triangular Band pass filter: We multiple the magnitude frequency response by a set of 20 triangular band pass filters to get the log energy of each triangular band pass filter. The positions of these filters are equally spaced along the Mel frequency, which is related to the common linear frequency f by the following equation: (10) mel ( f ) = 1125 * ln(1 + f / 700 ) Mel-frequency is proportional to the logarithm of the linear frequency, reflecting similar effects in the human's subjective aural perception. 6) Mel-scale cepstral coefficients: In this step, we apply discrete cosine transform on the 20 log energy Ek obtained from the triangular band pass filters to have L mel-scale cepstral coefficients. The mel-scale cepstral coefficients obtained by following a formula: C m = S k −1 N cos[ m * (k − 0.5) * p / N ]E k
m = 1,2,...L
(11)
where, N is the number of triangular band pass filters, L- is the number of mel-scale cepstral coefficients.
ISSN : 0975-4024
Vol 5 No 6 Dec 2013-Jan 2014
4518
N.J. Nalini et.al / International Journal of Engineering and Technology (IJET)
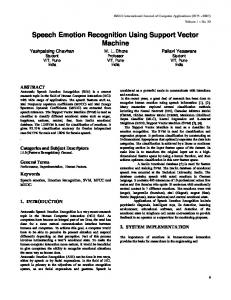
V. AANN MODEL FOR SPEECH EMOTION RECOGNITION Neural network models can be trained to capture the non-linear information present in the signal. In particular AANN models are basically feed forward neural network (FFNN) models which try to map an input vector onto itself [17], [18]. It consists of an input layer, an output layer and one or more hidden layers. The number of units in the input and output layers are equal to the size of the input vectors. The number of nodes in the middle hidden layer is less than the number of units in the input or output layers. The middle layer is also the dimension compression hidden layer. The activation function of the units in the input and output layers are linear (L), whereas the activation function of the units in hidden layer can be either linear or nonlinear (N). Studies on three layer AANN models show that the nonlinear activation function at the hidden units clusters the input data in a linear subspace [19]. Theoretically, it was shown that the weights of the network will produce small errors only for a set of points around the training data. When the constraints of the network are relaxed in terms of layers, the network is able to cluster the input data in the nonlinear subspace. Hence a five layer AANN model as shown in Fig. 2 is used to capture the distribution of the feature vectors in our study. 2
4
Layer 1 3
5
/
/ / /
/
Output layer
/ Input layer Compression layer Fig. 2. Five layer autoassociative neural network
The performance of AANN models can be interpreted in different ways, depending on the problem and the input data. If the data is a set of feature vectors in the feature space, then the performance of AANN models can be interpreted either as linear and nonlinear principal component analysis (PCA) or distribution capturing of the input data [20], [21]. Emotion recognition using AANN model is basically a two stage process namely, (i). Training phase and (ii). Testing phase. During training phase, the weights of the network are adjusted to minimize the mean square error obtained for each feature vector. If the adjustment of weights is done for all feature vectors once, then the network is said to be trained for one epoch. During testing phase (evaluation), the features extracted from the test data are given to the trained AANN model to find its match.
ISSN : 0975-4024
Vol 5 No 6 Dec 2013-Jan 2014
4519
N.J. Nalini et.al / International Journal of Engineering and Technology (IJET)
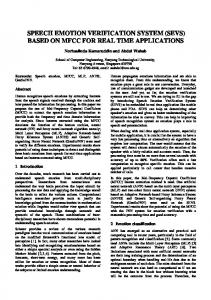
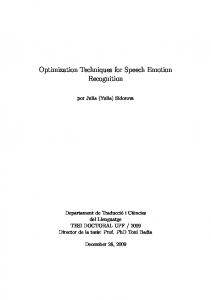
Fig. 3. AANN training error Vs. number of epochs for each emotion.
VI. RESULTS AND DISCUSSION The proposed method for speech emotion recognition is experimented with the speech emotion dataset and the performance is evaluated in terms of FAR, FRR and accuracy. A. Performance Metrics The performance of emotion recognition is assessed in terms of two types of errors namely false acceptance (type I error) and false rejection (type II error). A false acceptance rate (FAR) is defined as the rate at which an emotion model gives high confidence score when compared to the test emotion model. A false rejection rate (FRR) is defined as the rate at which the respective model for the test emotion gives low confidence score when compared to one or more other emotion models Also, Accuracy is defined as
Accuracy=
Number of correctly predicted Total number of testing
B. Speech Corpus Speech corpus for developing emotional speech system can be divided into three types namely simulated, elected, and natural emotional speech. The database used in this work is simulated emotion speech corpus recorded in Tamil language with 8 KHz sampling frequency and 16 bit monophonic PCM wave format. The sentences used in daily conversation are used for recording. The speech signals are recorded using shure dynamic cardioids microphone in the same environment. There are 15 speech samples recorded for each emotion using male and female speakers and the sample signal for each emotion is shown in Fig. 4.
ISSN : 0975-4024
Vol 5 No 6 Dec 2013-Jan 2014
4520
N.J. Nalini et.al / International Journal of Engineering and Technology (IJET)
(a)
(b)
(c)
(d)
(e)
Fig. 4. Five speech emotion signals. (a) Anger. (b) Fear. (c) Happy. (d) Neutral. (e) Sad.
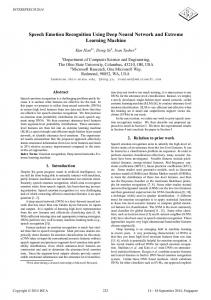
C. Speech Emotion Recognition using Residual Phase 1) Extraction of Residual Phase: The residual phase obtained from the LP residual is described in Section IV- A. In our work speech signal sampled at 8 KHz and the LP order 12 for deriving the LP residual. A segment of speech file from sad emotion, its LP residual, the Hilbert transform of the LP residual, the Hilbert envelope, and residual phase are shown in Fig. 5. The residual phases extracted from various emotions are shown in Fig. 6.
(a)
(b)
(c)
(d)
(e)
Fig. 5. Extraction of residual phase from the segment of sad emotion. (a) Speech signal. (b) LP residual. (c)Hilbert transform of the LP residual. (d) Hilbert envelope. (e) Residual phase
ISSN : 0975-4024
Vol 5 No 6 Dec 2013-Jan 2014
4521
N.J. Nalini et.al / International Journal of Engineering and Technology (IJET)
1 0 -1
(a) 0
50
100
150
200
250
300
350
400
450
500
1 0
Amplitude
-1
(b) 0
50
100
150
200
250
300
350
400
450
500
0
50
100
150
200
250
300
350
400
450
500
0
50
100
150
200
250
300
350
400
450
500
0
50
100
150
200
250
300
350
400
450
500
1 0 -1
(c)
1 0 -1
(d)
1 0 -1
(e) samples
Samples Fig. 6. Extraction of residual phase from five different emotions. (a) Sad. (b) Neutral. (c) Happy. (d) Fear. (e) Anger.
2) Training and Testing of Residual Phase Features using AANN: The residual phase features from each emotions are given to AANN for training and testing. The training and testing phase is shown in Fig. 3. During the training phase a single AANN is trained separately for each emotion. The five-layer architecture used is shown in Fig. 2. The AANN structure 40L 60N 20N 60N 40L achieves an optimal performance in training and testing the residual phase features for each emotion. The structure is obtained from the experimental studies. The residual phase feature vectors are given as both input and output. The weights are adjusted to transform input feature vector in to the output. The number of epochs needed depend upon the training error. In this work the network is trained for 1000 epochs, but there is no major change in training error after 500 epochs and it is shown in Fig. 3. During testing phase the residual phase features of test samples are given as input to the AANN and the output is computed. The output of each model is compared with the input to compute the normalized squared 2
error. The normalized squared error (e) for the feature vector y is given by, e = y - o , where o is the output 2 y vector is given by the model. The error e is transformed into a confidence score (s) using s=exp (-e). The average confidence score is calculated for each model. The category of the emotion is decided based on the highest confidence score. The performance of the speech emotion recognition using residual phase features is shown in Fig. 7. By evaluating the performance in terms of FAR and FRR, an equal error rate (EER) of 41.0% is obtained. D. Speech Emotion Recognition using MFCC 1) Extraction of MFCC: The procedure for extracting MFCC features from the speech signal is discussed in Section IV- B. The MFCC features (first ten coefficients) for fear and happy emotions are shown in Figs. 8(a) and 8(b), respectively
ISSN : 0975-4024
Vol 5 No 6 Dec 2013-Jan 2014
4522
N.J. Nalini et.al / International Journal of Engineering and Technology (IJET)
Fig. 7. Emotion recognition performance using residual phase features.
Fig. 8(a). MFCC features of emotional speech (fear)
ISSN : 0975-4024
Vol 5 No 6 Dec 2013-Jan 2014
4523
N.J. Nalini et.al / International Journal of Engineering and Technology (IJET)
Fig. 8(b). MFCC features of emotional speech (happy)
2) Training and Testing of MFCC Features using AANN: The AANN structure used for training and testing is 39L 50N 16N 50N 39L and it achieves optimal performance. During training phase, the MFCC feature vectors are given to the AANN and the epochs taken to train the structure is 1000 epochs but there is no considerable weight adjustment after 500 epochs. The network is trained until the training error is considerably less. During testing the MFCC features of test samples are given to the trained AANN. The squared error between MFCC and the output of AANN is computed. The squared error is converted into confidence score.
Fig. 9. Emotion recognition performance using MFCC features
By evaluating the performance in terms of FAR and FRR an equal error rate of 20.0% is obtained and it is shown in Fig. 9. E. Combining MFCC and Residual Phase Features (Score level fusion) The excitation and spectral features are combined at the matching score level because of its complementary nature using (12) c = ws 1 + (1 − w ) s 2 where s1 and s2 are the confidence scores for residual phase and MFCC features, respectively. It is observed that an EER of about 16.0% for the combined features and is shown in the Fig.10.
ISSN : 0975-4024
Vol 5 No 6 Dec 2013-Jan 2014
4524
N.J. Nalini et.al / International Journal of Engineering and Technology (IJET)
.. ..
Fig. 10. Performance of emotion recognition using combined features at score level.
The confusion matrix for the emotion recognition system obtained by combining the evidences of MFCC and residual phase features and overall recognition performance of 86.0% is obtained is shown in Table I TABLE I Confusion Matrix for Emotion Recognition by Combining the Features
Emotion Recognition Performance ( in%) Anger
Fear
Happy
Neutral
Sad
Anger
93.5
2.5
1.0
2.0
1.0
Fear
4.0
89.0
3.0
1.5
2.5
Happy
3.0
5.0
79.5
2.0
10.5
Neutral
2.0
4.0
5.0
86.0
3.0
Sad
1.0
2.0
7.0
8.0
82.0
Overall recognition performance = 86.0% The class-wise emotion recognition performance using spectral , excitation source and combined features are shown in Fig.11.
ISSN : 0975-4024
Vol 5 No 6 Dec 2013-Jan 2014
4525
N.J. Nalini et.al / International Journal of Engineering and Technology (IJET)
Fig. 11. Class wise emotion recognition performance using spectral,excitation source and combined features.
VI. SUMMARY AND CONCLUSION The objective of this paper, is to demonstrate that the residual phase feature contains emotion specific information when combined with the conventional based spectral features like MFCC improves the performance of the system. The proposed technique of speech emotion recognition (SER) is done in two phases: i) Feature extraction, and ii) Classification. The experimental studies are conducted using Tamil database recorded at 8 KHz with 16 bits per sample in linguistics laboratory. Initially, the speech signal is given to feature extraction phase to extract residual phase and MFCC features and then, it is effectively combined at the matching score level. Based on the feature vectors extracted from the training data, Autoassociative neural networks (AANN) are trained and it is used to classify the emotions such as anger, fear, happy, neutral or sad. Finally, EER is computed based on the performance metrics FAR and FRR. The experimental results show that the combined SER system is having better performance when compared to individual systems. REFERENCES [1] [2]
[3] [4] [5] [6] [7] [8] [9] [10]
[11] [12] [13] [14] [15] [16]
Shaughnessy D.O, “Speech communication human and machine”, Addison-Wesley publishing company, 1987. Schuller B, Rigoll G, and Lang M, “Speech emotion recognition combining acoustic features and linguistic information in a hybrid support vector machine-belief network architecture”, in Proc. IEEE International conference on acoustics speech signal processing, IEEE press, pp: 577-580, May 2004. Lee C.M, Narayanan S.S, “Toward detecting emotions in spoken dialogs”, IEEE Transaction on Speech Audio Process, 13(2): 293303, March 2005. France D.J, Shiavi R. G, Silverman S, Silverman M, Wilkes M, “Acoustical properties of speech as indicators of depression and suicidal risk”, IEEE Transaction on Biomedical Engg. 7: 829-837, July 2000. Hasegawa-Johnson, M., Levinson, S., Zhang, T., “Children’s emotion recognition in an intelligent tutoring scenario”. In: Proc. Interspeech, 2004. Arun Chauhan, Shashidhar G. Koolagudi, Sabin Kafley and K. Sreenivasa Rao, "Emotion Recognition using LP Residual," Proceedings of the 2010 IEEE Students' Technology Symposium,3-4 April 2010 S.R. Krothapalli and S.G. Koolagudi, “Emotion Recognition using Speech Features” SpringerBriefs in Electrical and Computer Engineering, 2013 Yegnanarayana, B., Murty, K.S.R., “Event-based instantaneous fundamental frequency estimation from speech signals”. IEEE Trans. Audio, Speech, and Language Processing 17(4), 614–624 (2009) Arun Chauhan, Shashidhar G. Koolagudi, Sabin Kafley and K. Sreenivasa Rao, "Emotion Recognition using LP Residual,"Proceedings of the 2010 IEEE Students' Technology Symposium ,3-4 April 2010. Shashidhar G. Koolagudi, Swati Devliyal, Nurag Barthwal, and K. Sreenivasa Rao. “Emotion Recognition from Semi Natural Speech Using Artificial Neural Networks and Excitation Source Features”,IC3 2012, CCIS 306, Springer-Verlag Berlin Heidelberg 2012,pp. 273–282, 2012. Yongjin Wang, Ling Guan, “Recognizing Human Emotional State From Audiovisual Signals”, IEEE transactions on multimedia, August 10(5): 936-946, 2008. Nicholson K, Takahashi and Nakatsu R, “Emotion recognition in speech using neural networks”, In 6th International conference on neural information processing, ICONIP-99, pp: 495-501, July 1999. Eun Ho Kim, Kyung Hak Hyun, Soo Hyun Kim, and Yoon Keun Kwak, “Improved Emotion Recognition With a Novel SpeakerIndependent Feature”, IEEE/ASME Transactions on Mechatronics, 14(3): 317-325, June 2009. Shashidhar G Koolagudi, Sourav Nandy , Sreenivasa Rao K, “Spectral Features for Emotion Classification”, IEEE International advance computing conference (IACC 2009) Patiala, India, pp:1292-1296, March 2009. I. Makhoul, "Linear prediction: A tutorial review." Pmc. IEEE. vol. 63, pp. 561-580, Apr. 1975. Dhanalakshmi P, Palanivel S, Ramalingam V, “Classification of audio signals using SVM and RBFNN”, Expert Systems with Applications, 36:6069-6075, April 2009.
ISSN : 0975-4024
Vol 5 No 6 Dec 2013-Jan 2014
4526
N.J. Nalini et.al / International Journal of Engineering and Technology (IJET)
[17] Palanivel S, “Person authentication using speech, face and visual speech”, Ph.D. Thesis, Department of Computer Science and Engineering, Indian Institute of Technology, Madras, 2004. [18] Yegnanarayana B, Kishore S.P, “AANN: an alternative to GMM for pattern recognition”, Neural Networks, 15: 459-569, April 2002. [19] Bianchini M, Frasconi P, Gori M, “Learning in multilayered networks used as autoassociators”, IEEE Transaction on Neural Networks, 6: 512-515, March 1995. [20] Kishore S.P, Yegnanarayana B, “Online text independent speaker verification system using autoassociative neural network models”, In proc. International Joint Conference on Neural Networks, Washington, DC, USA, April 2001. [21] Yegnanarayana B, Kishore S.P, “AANN: an alternative to GMM for pattern recognition”, Neural Networks, 15: 459-569, April 2002.
ISSN : 0975-4024
Vol 5 No 6 Dec 2013-Jan 2014
4527