nized in the signal window of duration tCVS, and tV is the duration of all the ...... 109â131, 2002. [5] S. S. Chen and P. S. Gopalakrishnan, âSpeaker, environment.
Hindawi Publishing Corporation EURASIP Journal on Applied Signal Processing Volume 2006, Article ID 90495, Pages 1–13 DOI 10.1155/ASP/2006/90495
Speech/Non-Speech Segmentation Based on Phoneme Recognition Features ˇ Janez Zibert, Nikola Paveˇsi´c, and France Miheliˇc Faculty of Electrical Engineering, University of Ljubljana, Trˇzaˇska 25, Ljubljana, 1000, Slovenia Received 16 September 2005; Revised 7 February 2006; Accepted 18 February 2006 Recommended for Publication by Hugo Van hamme This work assesses different approaches for speech and non-speech segmentation of audio data and proposes a new, high-level representation of audio signals based on phoneme recognition features suitable for speech/non-speech discrimination tasks. Unlike previous model-based approaches, where speech and non-speech classes were usually modeled by several models, we develop a representation where just one model per class is used in the segmentation process. For this purpose, four measures based on consonant-vowel pairs obtained from different phoneme speech recognizers are introduced and applied in two different segmentation-classification frameworks. The segmentation systems were evaluated on different broadcast news databases. The evaluation results indicate that the proposed phoneme recognition features are better than the standard mel-frequency cepstral coefficients and posterior probability-based features (entropy and dynamism). The proposed features proved to be more robust and less sensitive to different training and unforeseen conditions. Additional experiments with fusion models based on cepstral and the proposed phoneme recognition features produced the highest scores overall, which indicates that the most suitable method for speech/non-speech segmentation is a combination of low-level acoustic features and high-level recognition features. ˇ Copyright © 2006 Janez Zibert et al. This is an open access article distributed under the Creative Commons Attribution License, which permits unrestricted use, distribution, and reproduction in any medium, provided the original work is properly cited.
1.
INTRODUCTION
Speech/non-speech (SNS) segmentation is the task of partitioning audio streams into speech and non-speech segments. While speech segments can be easily defined as regions in audio signals where somebody is speaking, non-speech segments represent everything that is not speech, and as such consist of data from various acoustical sources, for example, music, human noises, silences, machine noises, and so forth. A good segmentation of continuous audio streams into speech and non-speech has many practical applications. It is usually applied as a preprocessing step in real-world systems for automatic speech recognition (ASR) [28], like broadcast news (BN) transcription [4, 7, 34], automatic audio indexing and summarization [17, 18], audio and speaker diarization [12, 20, 24, 30, 37], and all other applications where efficient speech detection helps to greatly reduce computational complexity and generate more understandable and accurate outputs. Accordingly, a segmentation has to be easily integrated into such systems and should not increase the overall computational load.
Earlier work on the separation of speech and non-speech mainly addressed the problem of classifying known homogeneous segments as speech or music and not as a non-speech class in general. The research focused more on developing and evaluating characteristic features for classification, and systems were designed to work on already-segmented data. Saunders [26] designed one such system using features pointed out by Greenberg [8] to successfully discriminate speech/music in radio broadcasting. He used time-domain features, mostly derived from zero crossing rates. Samouelian et al. [25] also used time-domain features, combined with two frequency features. Scheirer and Slaney [27] investigated features for speech/music discrimination that are closely related to the nature of human speech. The proposed features, that is, spectral centroid, spectral flux, zero-crossing rate, 4 Hz modulation energy (related to the syllable rate of speech), and the percentage of low-energy frames were explored in the task of discriminating between speech and various types of music. The most commonly used features for discriminating between speech, music, and other sound sources are the cepstrum coefficients. Mel-frequency cepstral
2 coefficients (MFCCs) [21] and perceptual linear prediction (PLPs) cepstral coefficients [11] are extensively used in speaker-and speech recognition tasks. Although these signal representations were originally designed to model the shortterm spectral information of speech events, they were also successfully applied in SNS discrimination systems [2, 4, 7, 9] in combination with Gaussian mixture models (GMMs) or hidden Markov models (HMMs) for separating different sound sources (broadband speech, telephone speech, music, noise, silence, etc.). The use of these representations is a natural choice in the systems based on ASR, since the same feature set can be used later for speech recognition. These representations and approaches focused on the acoustic properties of data that are manifested in either the time and frequency or spectral (cepstral) domains. All the representations tend to characterize speech in comparison to other non-speech sources (mainly music). Another view of the speech produced and recognized by humans is to see it as a sequence of recognizable units. Speech production can thus be considered as a state machine, where the states are phoneme classes [1]. Since other non-speech sources do not possess such properties, features based on these characteristics can be usefully applied in SNS classification. The first attempt in this direction was made by Greenberg [8], who proposed features based on the spectral shapes associated with the expected syllable rate in speech. Karneb¨ack [13] produced low frequency modulation features in the same way and showed that in combination with the MFCC features they constitute a robust representation for speech/music discrimination tasks. A different approach based on this idea was presented by Williams and Ellis [33]. They built a phoneme speech recognizer and studied its behavior on different speech and music signals. From the behavior of a recognizer, they proposed posterior probabilitybased features, that is, entropy and dynamism. In our work, we explore this idea even further in a way to analyze the output transcriptions of such phoneme recognizers. While almost all the mentioned studies focused more on discriminating between speech and non-speech (mainly music) data on separate audio segments, we explore these representations in the task of segmenting continuous audio streams where the speech and non-speech parts are interleaving randomly. Such kinds of data are expected in most practical applications of ASR. In our research, we focus mainly on BN data. Most recent research in this field addresses this problem as part of a complete ASR system for BN transcription [4, 7, 29, 34] and speaker diarization or tracking in BN data [12, 20, 30, 36, 37]. In most of these works, cepstral coefficients (mainly MFCCs) are used for segmenting, and GMMs or HMMs are used for classifying the segments into speech and different non-speech classes. An alternative approach was investigated in [16], where the audio classification and segmentation was made by using support vector machines (SVMs). Another approach was presented in [1], where speech/music segmentation was achieved by incorporating GMMs into the HMM framework. This approach is also followed in our work. In addition, we use it as a baseline segmentation-classification method when comparing it with
EURASIP Journal on Applied Signal Processing another method based on acoustic segmentation obtained with the Bayesian information criterion (BIC) [5] followed by SNS classification. This paper is organized as follows: in Section 2 the phoneme recognition features are proposed. We give the basic ideas behind introducing such a representation of audio signals for SNS segmentation and define four features based on consonant-vowel pairs produced by a phoneme recognizer. Section 3 describes the two SNS segmentation approaches used in our evaluations, one of which was specially designed for the proposed feature representation. In the evaluation section, we present results from a wide range of experiments on several different BN databases. We try to assess the performance of the proposed representation in a comparison with existing approaches and propose fusion of the selected representations in order to improve the evaluation results. 2. 2.1.
PHONEME RECOGNITION FEATURES Basic concepts and motivations
The basic SNS classification systems typically include statistical models representing speech data, music, silence, noise, and so forth. They are usually derived from training material and then a partitioning method detects speech and nonspeech segments according to these models. The main problem in such systems is the non-speech data, which are produced by various acoustic sources and therefore possess different acoustic characteristics. Thus, for each type of such audio signals, one should build a separate class (typically represented as a model) and include it into a system. This represents a serious drawback in SNS segmentation systems, which need to be data independent and robust to different types of speech and non-speech acoustic sources. On the other hand, the SNS segmentation systems are meant to detect speech in audio signals and should discard non-speech parts regardless of their different acoustic properties. Such systems can be interpreted as two-class classifiers, where the first class represents speech samples and the second class everything else that is not speech. In that case, the speech class defines non-speech. Following this basic concept, one should find and use those characteristics or features of audio signals that better emphasize and characterize speech and exhibit the expected behavior on all other nonspeech audio data. While most commonly used acoustic features (MFCCs, PLPs, etc.) performed well when discriminating between different speech and non-speech signals [14], they still only operate on an acoustic level. Hence, the data produced by the various sources with different acoustic properties should be modeled by several different classes and should be represented in the training process of such systems. To avoid this, we decided to design an audio representation, which should better determine speech and perform significantly differently on all other non-speech data. One possible way to achieve this is to see speech as a sequence of basic speech units conveying some meaning. This rather broad definition of speech
ˇ Janez Zibert et al.
3 Acoustic feature extraction (MFCCs) Input signal
Phoneme recognizer (HMM)
Feature vectors
Transcription analysis
Phoneme recognition output
CVS features
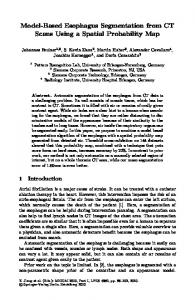
Figure 1: Block diagram of the proposed speech/non-speech phoneme recognition features.
led us to examine the behavior of a phoneme recognizer and analyze its performance on speech and non-speech data. 2.2. Feature derivation In our work, we tried to extend the idea of Williams and Ellis [33], who proposed novel features for speech and music discrimination based on posterior probability observations derived from a phoneme recognizer. From the analysis of the posterior probabilities, they extracted features such as mean per-frame entropy, average probability dynamism, background-label ratio, and phone distribution match. The entropy and dynamism features were later successfully applied in the speech/music segmentation of audio data [1]. In both cases, they used these features for speech/music classification, but the idea could easily be extended to the detection of speech and non-speech signals, in general. The basic motivation in both cases was to obtain and use features that were more robust to different kinds of music data and at the same time perform well on speech data. To explore this approach even further, we decided to produce features derived directly from phoneme recognition transcriptions, which could be applied to the task of SNS segmentation. Typically, the input of a phoneme (speech) recognizer consists of feature vectors based on the acoustic parametrization of speech signals and the corresponding output is the most likely sequence of predefined speech units together with the time boundaries, and in addition with the probabilities or likelihoods of each unit in a sequence. Therefore, the output information from a recognizer could also be interpreted as a representation of a given signal. Since the phoneme recognizer is designed for speech signals, it is to be expected that it will exhibit characteristic behavior when speech signals are passed through it, and all other signals will result in uncharacteristic behaviors. This suggests that it should be possible to distinguish between speech and non-speech signals by examining the outputs of phoneme recognizers. In general, the output from speech recognizers depends on the language and the models included in the recognizer. To reduce these influences, the output speech units should be chosen from among broader groups of phonemes that are typical for the majority of languages. Also, the corresponding speech representation should not be heavily dependent on the correct transcription produced by the recognizer. Because of these limitations and the fact that human speech can be described as concatenated syllables, we decided to examine the behavior of recognizers in terms of the consonantvowel (CV) level.
The procedure for extracting phoneme recognition features is shown in Figure 1. First, the acoustic representation of a given signal was produced and passed through the phoneme recognizer. Then, the transcription output was translated to specified speech classes, in our case to the consonant (C), vowel (V), and silence (S) classes. At this point, an analysis of the output transcription was carried out, and those features that resembled the discriminative properties of speech and non-speech signals and were relatively independent of specific recognizer properties and errors were extracted. We examined just those characteristics of the recognized output that are based on the duration and the changing rate of the basic units produced by the recognizer. After a careful analysis of the behaviors of several different phoneme recognizers for different speech and nonspeech data conditions, we decided to extract the following features. (i) Normalized CV duration rate, defined as � � � tC − tV �
tCV S
+α·
tS
tCV S
,
(1)
where tC is the overall duration of all the consonants recognized in the signal window of duration tCV S , and tV is the duration of all the vowels in tCV S . The second term denotes the portion of silence units (tS ) represented in a recognized signal measured in time. α serves to emphasize the proportion of silence regions in the signal, and has to be 0 ≤ α ≤ 1. Since it is well known that speech is constructed from CV units in a combination with S parts, we observed that analyzed speech signals exhibit relatively equal durations of C and V units, and rather small portions of silences (S). This resulted in small values (around zero) of (1) measured on fixed-width speech segments. On the other hand, analyzed non-speech data was almost never recognized as a proper combination of CV pairs; this was reflected in different rates of C and V units, and hence the values of (1) were closer to 1. In addition, the second term in (1) produces higher values, when non-speech signals are recognized as silences. Note that in (1) we used the absolute difference between the durations (|tC − tV |) rather than the duration ratios (tC /tV or tV /tC ). This was done to reduce the effect of labeling, and not to emphasize one unit over another. The latter would result in the poor performance of this feature when using different speech recognizers. (ii) Normalized CV speaking rate, defined as nC + n V , tCV S
(2)
4
EURASIP Journal on Applied Signal Processing
where nC and nV are the number of C and V units recognized in the signal in the time duration tCV S . Note that the silence units are not taken into account. Since phoneme recognizers are trained on speech data, they should detect changes when normal speech moves between phones every few tens of milliseconds. Of course, speaking rate in general depends heavily on the speaker and the speaking style. Actually, this feature is often used in systems for speaker recognition [23]. To reduce the effect of speaking style, particularly spontaneous speech, we decided not to count the S units. Even though the CV speaking rate (2) changes with different speakers and speaking styles, it varies less for non-speech data. In the analyzed signals, speech tended to change (in terms of phoneme recognizer) much less frequently and they varied greatly among different non-speech data types. This feature is closely related to the average probability dynamism proposed in [33]. (iii) Normalized CVS changes, defined as c(C, V , S) , tCV S
(3)
where c(C, V , S) counts how many times the C, V , and S units exchange in the signal in the time duration tCV S . This feature is related to the CV speaking rate, but with one important difference. Here, just the changes between the units that emphasize pairs and not just single units are taken into account. As speech consists of such CV combinations one should expect higher values when speech signals are decoded and lower values in the case of non-speech data. This approach could be extended even further to observe higher-order combinations of C, V, and S units to construct n-gram CVS models (like in statistical language modeling), which could be estimated from the speech and non-speech data. (iv) Normalized average CV duration rate, defined as � � �t¯C − t¯V �
t¯CV
,
(4)
where t¯C and t¯V represent the average time duration of the C and V units in a given segment of a recognized signal, while t¯CV is the average duration of all the recognized (C,V) units in the same segment. This feature was constructed to measure the difference in the average duration of consonants and the average duration of vowels. It is well known that in speech the vowels are in general longer in duration than the consonants. Hence, this was reflected in the analyzed recognized speech. On the other hand, it was observed that non-speech signals did not exhibit such properties. Therefore, we found this feature to be discriminative enough to distinguish between speech and non-speech data. This feature correlates with the normalized CV rate defined in (1). Note that in both cases, the differences were used instead of the ratios between the C and V units. The reason is the same as in the case of (1). As can be seen from the above definitions, all the proposed features measure the properties of recognized data on
the segments of a processing signal. The segments should be large enough to provide reliable estimations of the proposed measurements. The typical segment sizes used in our experiments were between 2.0 and 5.0 seconds or were defined by a number of recognized units. They depended on the size of the portions of speech and non-speech data that were expected in the processing signals. Another issue was how to calculate features to be time aligned. In order to make a decision as to which portion of the signal belongs to one or other class, we should calculate the features on a frame-by-frame basis. The natural choice would be to compute features on moving segments between successive recognized units, but in our experiments, we decided to keep a fixed frame skip, since we also used them in combination with the cepstral features. In the next sections, we describe how we experimented with frame rates and segment sizes as well as calculated features on already presegmented audio signals. Figure 2 shows phoneme recognition features in action1 . In this example, the CV features were produced by phoneme recognizers based on two languages. One was built for Slovene (darker line in Figure 2), the other was trained on the TIMIT database [6] (brighter line), and was therefore used for recognizing English speech data. This example was extracted from a Slovenian BN show. The data in Figure 2 consist of different portions of speech and non-speech. The speech segments are built from clean speech produced by different speakers in combination with music, while the nonspeech is represented by music and silent parts. As can be seen from Figure 2, each of these features has a reasonable ability to discriminate between speech and non-speech data, which was later confirmed by our experiments. Furthermore, the features computed from the English speech recognizer, and thus in this case used on a foreign language, exhibit nearly the same behavior as the features produced by the Slovenian phoneme decoder. This supports our intentions to design features that should be language and model independent. In summary, the proposed features can be seen as features designed to discriminate all recognizable speech segments from all others that cannot be recognized. It was found that this set of features follows our basic concept of deriving new features for SNS classification. This also has another advantage over previous approaches, in that it does not simply look at the acoustic nature of the signal in order to classify it as speech or non-speech, but rather it looks at how well the recognizer can perform over these segments. The CV features were developed in such a way as to be language and model independent. 3.
SPEECH/NON-SPEECH SEGMENTATION
We experimented with two different approaches to SNS segmentation. In the first group of segmentation experiments, we followed the approach presented in [1] designed 1
All data plots in Figure 2 were produced by the wavesurfer tool, available at http://www.speech.kth.se/wavesurfer/.
ˇ Janez Zibert et al.
5
Figure 2: Phoneme recognition CVS features. Top/first pane shows the normalized CV duration; second, the normalized CV speaking rate; third, the normalized CVS changes; and fourth, the normalized average CV duration rate. All the panes consist of two lines. The black (darker) line represents the features obtained from a phoneme-based speech recognizer build for Slovene, while the gray (brighter) line displays the features obtained from the phoneme recognizer for English. Bottom pane displays the audio signal with the corresponding manual transcription.
HMM Feature vectors
BIC Classified segmentation
Feature vectors
(a)
GMM Acoustic segments
Classified segmentation
(b)
Figure 3: Block diagram of the two approaches used in the SNS segmentation. In (a), segmentation and classification are performed simultaneously by HMM Viterbi decoding. Features are given in a frame-by-frame sequence. In the second approach (b), firstly, the segmentation based on acoustic features is performed by using BIC, then phoneme recognition CVS features are calculated on the obtained segments to serve as an input for GMM classification.
for speech/music segmentation. The basic idea here was to use HMMs to perform the segmentation and classification simultaneously. Another approach was to perform the segmentation and classification as separate processes. Here, the segmentation was done on an acoustic representation of audio signals produced by the BIC segmentation algorithm [5, 32], and then a classification of the obtained segments was made by using GMMs. The block diagram of the evaluated segmentation systems is shown in Figure 3. The base building blocks of both systems were GMMs. They were trained via the EM algorithm in a supervised way. In the first case (Figure 3(a)), the approach presented in [2] was applied. The segmentation and classification were performed simultaneously by integrating the GMM models into the HMM classification framework. We built a fully connected network consisting of N HMM models, as shown in Figure 4, where N represents the number of GMMs used in the speech/non-speech classification. Each HMM was constructed by simply concatenating the internal states associated with the same probability density
function represented by one GMM. The number of states (M states in Figure 4) was set in such a way as to impose a minimum duration on each HMM. All the transitions inside each model were set manually, while the transitions between different HMMs were additionally trained on the evaluation data. In the segmentation process, the Viterbi decoding was used to find the best possible state (speech/non-speech) sequence that could have produced the input features sequence. In the second approach (Figure 3(b)), the segmentation and classification were performed sequentially. The segmentation was done on an acoustic representation of the audio signals (MFCCs) using the BIC measure, [5, 32]. For this reason, segments based on acoustic changes were obtained, that is, speaker, channel, background changes, different types of audio signals (music, speech), and so forth. In the next step, the classification to speech or non-speech was performed. The classification was based on the same GMM set, which was also incorporated in the HMM classifier from the previous approach. In this way, we could compare both methods using the same models. This approach is suited to
6
EURASIP Journal on Applied Signal Processing
··· ···
. . .
N models
···
M states
Figure 4: HMM classification network used in speech/non-speech segmentation.
the proposed CVS features, which operate better on larger segments of signals rather than on smaller windows on a frame-by-frame basis. 4.
EVALUATION EXPERIMENTS
Our main goal in this work was to explore and experiment with different approaches and representations of audio signals in order to find the best possible solution for the SNS discrimination in the audio segmentation of BN shows. The main issue was to find the best combination of representations and classifications, which should be robust to different BN shows, different environments, different languages, and different non-speech types of signals, and should be easily integrated into systems for further speech processing of the BN data. We tested three main groups of features in the SNS segmentation task: acoustic features represented by MFCCs, the entropy and dynamism features proposed in [33], and our phoneme recognition CVS features defined in Section 2. We also experimented with various combinations of these feature representations in fusion models, where each stream was represented by one of the feature types. In addition, we compared the two different approaches to SNS segmentation presented in Section 3. As a baseline system for the SNS classification, we chose the MFCC features representation in combination with the HMM classifier. We decided to use 12 MFCC features together with normalized energy and first-order derivatives as a base representation, since no improvement was gained by introducing second-order derivatives. The second group of experiments was based on entropydynamism features [1]. We extracted the averaged entropy and dynamism from the HMM-based phoneme recognizer. They were computed from the posterior probabilities of each HMM state at a given time and at a given current observation vector represented by the MFCC features [33]. All the parameters were set according to [2]. The HMM phoneme recognizer was trained on the TIMIT speech database [6] in a traditional way and fed by 39 MFCCs including the energy and the first- and second-order derivatives. The CVS features were obtained from two phoneme recognizers. One was built on Slovenian data trained from three
speech databases: GOPOLIS, VNTV, and K211d [19]. We will refer to it as the SI-recognizer. The second was built from the TIMIT database [6], and thus was used for recognizing the English speech. This recognizer was also used in the entropy-dynamism case. It is referred to as the ENrecognizer in all our experiments. Both phoneme recognizers were constructed from the HMMs of monophone units joined in a fully connected network. Each HMM state was modeled by 32 diagonal-covariance Gaussian mixtures, built in a standard way, that is, using 39 MFCCs, including the energy, and the first- and second-order derivatives, and setting all of the HMM parameters by the Baum-Welch reestimation [38]. The phoneme sets of each language were different. In the SI-recognizer, 38 monophone base units were used, while in the TIMIT case, base units were reduced to 48 monophones, according to [15]. In both recognizers, we used bigram phoneme language models in the recognition process. The recognizers were also tested on parts of the training databases. The SI-recognizer achieved a phoneme recognition accuracy of about 70% on the GOPOLIS database, while the EN-recognizer had a phoneme recognition accuracy of around 61% in a test part of the TIMIT database. Since our CVS features were based on transcriptions of these recognizers, we also tested both recognizers on CVS recognition tasks. The SI-recognizer reached a CVS recognition accuracy of 88% on the GOPOLIS database, while for the EN-recognizer, the CVS accuracy on the TIMIT database was around 75%. The CVS features were calculated from phoneme recognition transcriptions on the evaluation databases produced by both the SI and EN recognizers using the formulas defined in Section 2. Our first experiments were performed on SNS discrimination tasks, where we found that these representations operate better on larger segments of audio signals. Therefore, we developed an alternative approach based on the BIC-GMM segmentation and tested them with both segmentation methods. In the HMM classification (Figure 3(a)), the feature vectors were produced on a frame-by-frame basis. Hence, we used a fixed window length of 3.0 s with a frame rate of 100 ms in all the experiments. In (1), α was set to 0.5. In the second approach, the BIC segmentation (Figure 3(b)) produced acoustic segments computed from 12 MFCC features, together with the energy. The BIC measure was applied by using full covariance matrices and a lambda threshold set according to the evaluation dataset. These segments were then classified as speech or non-speech, according to the maximum log-likelihood criteria applied on the GMMs modeled by the CVS features. As was mentioned in the previous sections, the classifications were made by GMMs. In all cases, we used models with diagonal covariance matrices that were trained via the EM algorithm in a supervised way. In the case of the MFCC and the entropy-dynamism features, two models were employed for detecting the speech data (broadband speech and narrowband speech) and two models were employed for detecting non-speech data (music and silence). All the models were trained on the training parts of the evaluation databases. We
ˇ Janez Zibert et al. did not use models trained from a combination of music and speech, even though they were expected in the evaluation data. The number of mixtures in the GMMs was set to 128 in the MFCC case, while in the entropy-dynamism case, 4 mixtures were used (in [1], just 2-mixture GMMs were applied). In the CVS case, only two models were used: speech and nonspeech. Here, GMMs with 2 mixtures were constructed. The number of mixtures for each representation was chosen to maximize the overall performance of the SNS segmentation on the evaluation dataset. In the HMM classification case, the number of states used to impose the minimum duration constraint in the HMMs was fixed. This was done according to [1]. Since in our evaluation data experiments speech or non-speech segments shorter than 1.4 s were not annotated, we set the minimum duration constraint to 1.4 s. This means that in the MFCC and in the entropy-dynamism cases, 140 states were chosen, which corresponded to the feature vectors frame rate of 10 ms. However, in the case of the CVS features, the number was set to 14 states, which corresponds to a feature rate of 100 ms. All the transition probabilities (including self-loop transitions) inside the HMM were fixed to 0.5. In all cases, we additionally experimented with different combinations of the threshold probability weights to favor speech or non-speech models in the classification system in order to optimize the performance of a segmentation on the evaluation dataset. We also experimented with combinations of two different feature representations modeled by fusion models. The fusion was achieved by using a state synchronous two-stream HMMs, [22]. In these experiments, audio data signals were represented by two separate streams of features: in one case with the MFCC stream and the entropy-dynamism stream, and in the second with the MFCC and the CVS stream. For each stream, separate GMMs were trained using the EM method. For the SNS segmentation purposes a similar HMM classification network was built to that in nonfusion cases, where in each state, the fusion was made by computing the product of the weighted observation likelihoods produced by the GMMs from each stream. Additionally, we had to set the product stream weights, which were empirically obtained to optimize the performance on the evaluation dataset. The HMM classification based on the Viterbi algorithm was accomplished with the HTK Toolkit [38], while we provided our own tools for the BIC segmentation and the GMM classification and training. Note that incorporating phoneme recognizers into SNS segmentation in the entropy-dynamism and in the CVS case increased the computational complexity of the segmentation systems. Additional computational time caused by speech recognizers can be reduced by using simple versions of phoneme recognizers. In our case, monophone speech recognizers were applied in both cases, even though in the CVS case a simpler recognizer, which would detect just CVS units, could be applied.
7 4.1.
BN databases for evaluation
Since we explored the effectiveness and the robustness of the presented approaches with respect to various audio conditions, different non-speech data, and different speech types and languages, we performed a wide range of experiments on three different BN databases. The first database consists of 3 hours from two entertainment shows. One (2 hours) is in Slovene, the other is in Italian. This database was constructed to serve as an evaluation dataset for setting the thresholds and other open parameters in all our experiments. The dataset is composed of 2/3 speech data, and the rest belongs to various non-speech events, that is, different types of music, jingles, applause and silent parts, laughter, and other noises. The speech data is produced by different speakers in two languages, and in different speaking styles (mainly spontaneous speech). The other two databases are the SiBN database [35] and the COST278 BN database [31]. Like all similar BN databases, they consist of BN shows composed mainly of speech data interleaved with short segments of non-speech events, mostly belonging to various jingles, music effects, silences, and various noises from BN reports. The SiBN database currently involves 33 hours of BN shows in Slovene. The BN shows were taken mostly from one TV station, and the data is therefore more homogeneous, that is, the speech is produced by the same TV reporters, the non-speech data consists of the same set of jingles and music effects. Nevertheless, it was used in experiments to study the influence of the training material on the different feature model representations in the SNS discrimination. The COST278 BN database is very different from the SiBN database. At present, it consists of data from nine different European languages, each national set includes approximately 3 hours of BN recordings produced by a total of 14 TV stations. As such, it was already used for the evaluation of different language- and data-independent procedures in the processing of BN, [36], and was therefore very suitable for the assessment of our approaches. The data from all the datasets were divided into the training and test parts. The training part includes one show from each dataset with an overall duration of 3 hours. These data were used as training material to estimate the GMM models of each representation. The test part of the evaluation dataset served mainly for finding the threshold probability weights of the speech and non-speech models in a classification, and for setting the BIC segmentation thresholds. We also used it for the assessment of the CVS features. The test data from the SiBN and COST278 BN databases (except the BN shows used in training) were used for the assessment of the proposed representations and approaches. The experiments were performed on 30 hours of SiBN and on 25 hours of COST278 BN data. 4.2.
Evaluation measures
The results were obtained in terms of the percentage of frame-level accuracy. We calculated three different statistics
8
EURASIP Journal on Applied Signal Processing
in each case: the percentage of true speech frames identified as speech, the percentage of true non-speech frames identified as non-speech, and the overall percentage of speech and non-speech frames identified correctly (the overall accuracy). Note that in cases where one class dominates in the data (e.g., speech in the SiBN and COST278 databases), the overall accuracy depends heavily on the accuracy of that class, and in such a case it cannot provide enough information on the performance of such a classification by itself. Therefore, in order to correctly assess classification methods, one should provide all three statistics. Nevertheless, we chose to maximize the overall accuracy to find the optimal set of parameters on the evaluation dataset, since the proportion of speech and non-speech data in that database is less biased. 4.3. Evaluation data experiments The evaluation dataset (the test part) was used in two groups of experiments. We used it to set all the thresholds and open parameters of the representations and the models to obtain optimal performance on the evaluation data. These models were later employed in the SiBN and COST278 BN dataset experiments and are referred to as the optimal models. The performance of several different classification methods and fusion models is shown in Figures 5 and 6, respectively. In both figures, the overall accuracies are plotted against a combination of non-speech and speech threshold probability weights. For each classification method the best possible pair of speech and non-speech weights was chosen, where the maximum in the overall accuracy was achieved. We experimented with several SNS classification representations and segmentation methods. The tested SNS representations were the following: (i) 12 MFCC features with the energy and first delta coefficients modeled by 128-mixture GMMs (MFCC-E-D26 in Figure 5), (ii) the entropy and dynamism features modeled by 4mixture GMMs (entropy, dynamism), (iii) the phonemes feature representations calculated from (1)–(4) based on the CVS phoneme groups obtained from the Slovenian and English phoneme recognizers (SI-phonemes CVS, EN-phonemes CVS), modeled by 2mixture GMMs, (iv) fusion representations in one case built from the MFCC and entropy-dynamism features (fusion MFCC + EntDyn in Figure 6), and in the second from the MFCC and SI-phonemes CVS features (fusion MFCC + CVS in Figure 6). The segmentation was performed either by the HMM classifiers, based on speech/non-speech GMMs (marked as HMM-GMM in Figures 5 and 6), or by BIC segmentation, followed by GMM classification (BICseg-GMM in Figure 5). As can be seen from Figure 5, all the segmentation methods based on phoneme CVS features have stable performance across the whole range of operating points of the probability
weights. The overall accuracy ranges between 92% and 95%. There were no important differences in the performance of the approaches based on the HMM classification and the BIC segmentation, even though the BIC segmentation and the GMM classification operated slightly better than their HMM-based counterparts. On the other hand, the MFCC and entropy-dynamism features were more sensitive to different operating points. (This issue became more important in the experiments on the test datasets.) The MFCC representations achieved the maximum accuracy slightly above 95% at the operating point (0.8,1.2). Around this point, it performed better than the CVS-based segmentations. The entropy-dynamism features performed poorly as compared with the CVS and MFCC features and were even more sensitive to different operating points of the probability weights. Figure 6 shows a comparison of two fusion models and the base representations from which the fusion models were built. The key issue here was to construct the fusion models of the acoustic representations of the audio signals and the representations based on speech recognition to gain better performance from the SNS discrimination. In both fusion representations, the overall accuracies were raised to 96% (maximum values) around those operating points where the corresponding base representations achieved their own maximum values. While the performance of the fusion MFCC + CVS changes slightly over the whole range of probability weights due to the CVS representation, the fusion MFCC + EntDyn becomes even more sensitive to different operating points than the MFCC representation itself, due to the property of the entropy-dynamism features. In the second group of experiments, we tried to assess the performance of each CVS feature and made a comparison with the CVS representation composed of all the features and the baseline GMM-MFCC classification. The results are shown in Table 1. The comparison was made on a nonoptimal classification, where the speech and non-speech probability weights were equal. From the results in Table 1, it can be seen that each feature was capable of identifying the speech and non-speech segments in the evaluation dataset. The features based on speaking rates (normalized CVS changes, normalized CV speaking rate) performed better than the duration-based features (normalized CV duration rate, normalized average CV duration rate). These pairs of features were also more correlated. As expected, the normalized CVS changes (3) performed well in identifying speech segments, since it is designed to count CV pairs, which are more characteristic for speech. We even experimented further with all possible combinations of features, but none of them performed better than all four CVS features together. Therefore, we decided to use all four features in further experiments. 4.4.
Test data experiments
In order to properly assess the proposed methods, we performed a wide range of experiments with the SiBN and COST278 BN databases. The results are shown in Table 2 for the SiBN database and in Table 3 for the COST278 BN
ˇ Janez Zibert et al.
100
Threshold probability weights HMM-GMM: MFCC-E-D-26 HMM-GMM: entropy, dynamism HMM-GMM: SI-phonemes CVS HMM-GMM: EN-phonemes CVS BICseg-GMM: SI-phonemes CVS BICseg-GMM: EN-phonemes CVS
(0.2, 1.8)
(0.4, 1.6)
(0.6, 1.4)
75
(0.8, 1.2)
80
(1, 1)
(0.2, 1.8)
(0.4, 1.6)
(0.6, 1.4)
(0.8, 1.2)
(1, 1)
(1.2, 0.8)
(1.4, 0.6)
(1.6, 0.4)
75
(1.8, 0.2)
80
85
(1.2, 0.8)
85
90
(1.4, 0.6)
90
95
(1.6, 0.4)
Overall accuracy (%)
95
Setting speech/non-speech thresholds of fusion models
(1.8, 0.2)
Setting speech/non-speech thresholds
100 Overall accuracy (%)
9
Threshold probability weights HMM-GMM: MFCC-E-D-26 HMM-GMM: entropy, dynamism HMM-GMM: SI-phonemes CVS HMM-GMM: fusion MFCC + EntDyn HMM-GMM: fusion MFCC + CVS
Figure 5: Determining the optimal threshold weights (non-speech, speech) of the speech and non-speech models to maximize the overall accuracy of the different representations and approaches.
Figure 6: Determining the optimal threshold weights (non-speech, speech) of the speech and non-speech models to maximize the overall accuracy of the different fusion models and a comparison with the corresponding nonfusion representations.
database. We performed two groups of experiments. In the first group, we built classifiers from the GMM models estimated from the training dataset, set the optimal threshold probability weights of the speech and non-speech models on the evaluation dataset, and tested them in the segmentation task on both BN databases. The results obtained in this way are shown as the first values in Tables 2 and 3. The values in parentheses denote the results obtained from nonoptimal models using equal threshold probability weights, that is, no evaluation data was used in these experiments. Although the SiBN and COST278 BN databases consist of different types of BN data, the classification results given in Tables 2 and 3 reveal the same performance for different methods on both datasets. This is due to the fact that the same training data and models were used in both cases. Furthermore, it can be concluded that the representations of the audio signals with the CVS features performed better than the MFCC and entropy-dynamism-based representations. The advantage of using the proposed phoneme recognition features becomes even more evident when they are compared in terms of speech and non-speech accuracies. In general, there exists a huge difference between the CVS and the MFCC and entropy-dynamism representations in correctly identifying non-speech data with a relatively small loss of accuracy in identifying speech data. In almost all cases of CVS features, this resulted in an increased overall accuracy in comparison to other features. Another important issue is revealed by the results in the parentheses. In almost all cases, the overall accuracies are lower than in the optimal case, but there exist huge discrepancies in detecting the speech and
non-speech segments. While in the case of the CVS features, the differences between the optimal and nonoptimal results (of speech and non-speech accuracies) are not so large, there exist huge deviations in the MFCC and entropy-dynamism case, especially in terms of non-speech accuracy. This is a direct consequence of the stability issues discussed in the previous section (see Figures 5, 6). When comparing the results of just the CVS representations, no substantial differences in classifications can be found. The results from the SI-phonemes and the ENphonemes confirm that the proposed measures are really independent of the phoneme recognizers based on different languages. They also suggest that almost no differences in using different segmentation methods exist, even though in the case of BIC segmentation and GMM classification we got slightly better results in both experiments. As far as fusion models are concerned, we can state that in general they performed better than their stand-alone counterparts. For the fusion of the MFCC and entropy-dynamism features, again the performance was very sensitive to the training conditions (see the results of the COST278 case, Table 3). In the case of fusion of the MFCC and CVS features, we obtained the highest scores on both databases. To sum up, the results in Tables 2 and 3 speak in favor of the proposed phoneme recognition features. This can be explained by the fact that our features were designed to discriminate between speech and non-speech, while the MFCC and posterior probability-based (entropy, dynamism) features were developed in general and in this task were used just for discriminating between speech and music data.
10
EURASIP Journal on Applied Signal Processing
Table 1: Speech/non-speech CVS feature-by-feature classification results in comparison to the baseline MFCC classification on the evaluation dataset. Features type Norm. CV duration rate (1) Norm. CV speaking rate (2) Norm. CVS changes (3) Norm. average CV duration rate (4) All CVS features MFCC
Speech
Non-speech
Accuracy
82.3 89.6 91.6 81.7 94.7 93.5
70.0 93.7 92.5 70.0 93.4 97.4
77.8 91.1 92.0 77.4 94.2 94.9
Table 2: SNS classification results on the SiBN database. Values in parentheses denote the results obtained from nonoptimal models using equal threshold probability weights. The best results in nonfusion and fusion cases are emphasized. Classification & features type HMM-GMM: MFCC HMM-GMM: entropy, dynamism HMM-GMM: SI-phonemes, CVS HMM-GMM: EN-phonemes, CVS BIC-GMM: SI-phonemes, CVS BIC-GMM: EN-phonemes, CVS HMM-GMM: fusion MFCC + EntDyn HMM-GMM: fusion MFCC + SI-CVS
Speech
Non-speech
Accuracy
97.9 (96.4) 99.3 (88.9) 98.2 (97.6) 98.5 (98.4) 97.9 (97.9) 98.3 (98.2) 99.7 (97.9) 99.3 (98.3)
58.7 (72.3) 55.8 (88.7) 91.1 (93.0) 88.2 (88.8) 89.5 (89.7) 89.2 (89.2) 62.9 (88.9) 87.0 (93.6)
95.3 (94.8) 96.5 (88.9) 97.8 (97.3) 97.8 (97.7) 97.4 (97.3) 97.7 (97.7) 97.3 (97.3) 98.5 (98.0)
Another issue concerns stability, and thus the robustness of the evaluated approaches. For the MFCC and entropydynamism features, the performance of the segmentation depends heavily on the training data and the conditions, while the classification with the CVS features in combination with the GMM models performed reliably on all the evaluation and test datasets. Our experiments with fusion models also showed that probably the most appropriate representation for the SNS classification is a combination of acousticand recognition-based features. 5.
CONCLUSION
The goal of this work was to introduce a new approach and compare it to different existing approaches for SNS segmentation. The proposed representation for discriminating SNS segments in audio signals is based on the transcriptions produced by phoneme recognizers and is therefore independent of the acoustic properties of the signals. The phoneme recognition features were designed to follow the basic concept of this kind of classification, where one class-speech defines another non-speech. For this purpose, four measures based on consonantvowel pairs obtained from different phoneme speech recognizers were introduced. They were constructed in such a way as to be recognizer and language independent and could be applied in different segmentation-classification frameworks. We tested them in two different classification systems. The baseline system was based on the HMM classification framework, which was used in all the evaluations to compare different SNS representations. The performance of the pro-
posed features was also studied in an alternative approach, where segmentation based on the acoustic properties of audio signals using the BIC measure was applied first, and then the GMM classification was performed second. The systems were evaluated on multilingual BN datasets consisting of more than 60 hours of BN shows from various speech data and non-speech events. The results of these evaluations illustrate the robustness of the proposed phoneme recognition features in comparison to MFCC and posterior probability-based features (entropy, dynamism). The overall frame accuracies of the proposed approaches varied in the range from 95% to 98%, and remained stable through different test conditions and different sets of features produced by phoneme recognizers trained on different languages. A detailed study of all the representations on their relative performance at discriminating between speech and non-speech segments revealed another important issue. Phoneme recognition features in combination with GMM classification outperformed the MFCC and entropy-dynamism features when detecting non-speech segments, from which it could be concluded that the proposed representation is more robust and less sensitive to different training and unforeseen conditions, and therefore more suitable for the task of SNS discrimination and segmentation. Another group of experiments was performed with fusion models. Here we tried to evaluate the performance of segmentation systems based on different representations with a combination of acoustic- and recognition-based features. We experimented with a combination of MFCC and entropy-dynamism features and MFCC and phoneme recognition features. The latter representation yielded the highest
ˇ Janez Zibert et al.
11
Table 3: SNS classification results on the COST278 database. Values in parentheses denote the results obtained from nonoptimal models using equal threshold probability weights. The best results in nonfusion and fusion cases are emphasized. Classification & features type HMM-GMM: MFCC HMM-GMM: entropy, dynamism HMM-GMM: SI-phonemes, CVS HMM-GMM: EN-phonemes, CVS BIC-GMM: SI-phonemes, CVS BIC-GMM: EN-phonemes, CVS HMM-GMM: fusion MFCC + EntDyn HMM-GMM: fusion MFCC + SI-CVS
Speech
Non-speech
Accuracy
98.7 (97.8) 98.5 (83.4) 96.6 (95.6) 97.9 (97.8) 97.1 (97.0) 98.1 (98.0) 99.4 (97.1) 98.6 (97.0)
44.0 (54.2) 38.4 (79.3) 76.9 (79.3) 71.1 (71.6) 76.3 (76.4) 75.0 (75.2) 34.7 (65.6) 70.5 (78.4)
94.6 (94.6) 94.0 (83.1) 95.1 (94.3) 95.9 (95.8) 95.6 (95.5) 96.4 (96.3) 94.6 (94.8) 96.5 (95.6)
scores overall, which confirmed our expectations that probably the most suitable representation for SNS classification is a combination of acoustic- and recognition-based features. The proposed phoneme recognition features employ high-level information in SNS segmentation tasks, and in our experiments demonstrated a strong ability to discriminate between speech and non-speech. The effectiveness of the proposed SNS segmentation approach will be further analyzed in speaker diarization tasks on BN data. The speaker diarization system will be built similar to systems presented in [30, 37] based on methods derived from speaker verification tasks. Since similar phoneme recognition features were also successfully applied in the fusion systems for speaker verification [3, 10], we intend to integrate the proposed CVS features in the speaker clustering procedures in our diarization system. ACKNOWLEDGMENT This work was supported by the Slovenian Research Agency (ARRS), development project L2-6277 (C) entitled “Broadcast news processing system based on speech technologies.” REFERENCES [1] J. Ajmera, I. McCowan, and H. Bourlard, “Speech/music segmentation using entropy and dynamism features in a HMM classification framework,” Speech Communication, vol. 40, no. 3, pp. 351–363, 2003. ´ [2] J. Ajmera, Robust audio segmentation, Ph.D. thesis, Ecole Polytechnique F´ed´erale de Lausanne, Lausanne, Switzerland, 2004. [3] B. Baker, R. Vogt, and S. Sridharan, “Gaussian mixture modelling of broad phonetic and syllabic events for textindependent speaker verification,” in Proceedings of Interspeech 2005 - Eurospeech, pp. 2429–2432, Lisbon, Portugal, September 2005. [4] P. Beyerlein, X. Aubert, R. Haeb-Umbach, et al., “Large vocabulary continuous speech recognition of broadcast news the Philips/RWTH approach,” Speech Communication, vol. 37, no. 1, pp. 109–131, 2002. [5] S. S. Chen and P. S. Gopalakrishnan, “Speaker, environment and channel change detection and clustering via the Bayesian information criterion,” in Proceedings of the DARPA Speech Recognition Workshop, pp. 127–132, Lansdowne, Va, USA, February 1998.
[6] J. S. Garofolo, L. F. Lamel, W. M. Fisher, J. G. Fiscus, D. S. Pallett, and N. L. Dahlgren, “DARPA TIMIT acoustic-phonetic continuous speech corpus,” U.S. Department of Commerce, NIST, Gaithersburg, Md, USA, February 1993. [7] J.-L. Gauvain, L. Lamel, and G. Adda, “The LIMSI broadcast news transcription system,” Speech Communication, vol. 37, no. 1, pp. 89–108, 2002. [8] S. Greenberg, “The ears have it: the auditory basis of speech perceptions,” in Proceedings of the 13th International Congress of Phonetic Sciences (ICPhS ’95), vol. 3, pp. 34–41, Stockholm, Sweden, August 1995. [9] T. Hain, S. E. Johnson, A. Tuerk, P. C. Woodland, and S. J. Young, “Segment generation and clustering in the HTK broadcast news transcription system,” in Proceedings of the 1998 DARPA Broadcast News Transcription and Understanding Workshop, pp. 133–137, Lansdowne, Va, USA,, February 1998. [10] A. O. Hatch, B. Peskin, and A. Stolcke, “Improved phonetic speaker recognition using lattice decoding,” in Proceedings of IEEE International Conference on Acoustics, Speech, and Signal Processing (ICASSP ’05), vol. 1, pp. 169–172, Philadelphia, Pa, USA, March 2005. [11] H. Hermansky, “Perceptual linear predictive (PLP) analysis of speech,” Journal of the Acoustical Society of America, vol. 87, no. 4, pp. 1738–1752, 1990. [12] D. Istrate, N. Scheffer, C. Fredouille, and J.-F. Bonastre, “Broadcast news speaker tracking for ESTER 2005 campaign,” in Proceedings of Interspeech 2005 - Eurospeech, pp. 2445–2448, Lisbon, Portugal, September 2005. [13] S. Karneb¨ack, “Expanded examinations of a low frequency modulation feature for speech/music discrimination,” in Proceedings of 7th International Conference on Spoken Language Processing (ICSLP ’02 - Interspeech ’02), vol. 2, pp. 2009–2012, Denver, Colo, USA, September 2002. [14] B. Logan, “Mel frequency cepstral coefficients for music modeling,” in Proceedings of the International Symposium on Music Information Retrieval (ISMIR ’00), Plymouth, Mass, USA, October 2000. [15] K.-F. Lee and H.-W. Hon, “Speaker-independent phone recognition using hidden Markov models,” IEEE Transactions on Acoustics, Speech, and Signal Processing, vol. 37, no. 11, pp. 1641–1648, 1989. [16] L. Lu, H.-J. Zhang, and S. Z. Li, “Content-based audio classification and segmentation by using support vector machines,” ACM Multimedia Systems Journal, vol. 8, no. 6, pp. 482–492, 2003. [17] I. Magrin-Chagnolleau and N. Parlangeau-Vall`es, “Audio indexing: what has been accomplished and the road ahead,”
12
[18]
[19]
[20]
[21]
[22]
[23]
[24]
[25]
[26]
[27]
[28]
[29]
[30]
[31]
[32]
EURASIP Journal on Applied Signal Processing in Proceedings of Joint Conference on Information Sciences (JCIS ’02), pp. 911–914, Durham, NC, USA, March 2002. J. Makhoul, F. Kubala, T. Leek, et al., “Speech and language technologies for audio indexing and retrieval,” Proceedings of the IEEE, vol. 88, no. 8, pp. 1338–1353, 2000. ˇ F. Miheliˇc, J. Gros, S. Dobriˇsek, J. Zibert, and N. Paveˇsi´c, “Spoken language resources at LUKS of the university of Ljubljana,” International Journal of Speech Technology, vol. 6, no. 3, pp. 221–232, 2003. D. Moraru, M. Ben, and G. Gravier, “Experiments on speaker tracking and segmentation in radio broadcast news,” in Proceedings of Interspeech 2005 - Eurospeech, pp. 3049–3052, Lisbon, Portugal, September 2005. J. W. Picone, “Signal modeling techniques in speech recognition,” Proceedings of the IEEE, vol. 81, no. 9, pp. 1215–1247, 1993. G. Potamianos, C. Neti, J. Luettin, and I. Matthews, “Audiovisual automatic speech recognition: an overview,” in Issues in Visual and Audio-Visual Speech Processing, G. Bailly, E. Vatikiotis-Bateson, and P. Perrier, Eds., MIT Press, Cambridge, Mass, USA, 2004. D. A. Reynolds, J. P. Campbell, and W. M. Campbell, “Beyond cepstra: exploiting high-level information in speaker recognition,” in Proceedings of the Workshop on Multimodal User Authentication, pp. 223–229, Santa Barbara, Calif, USA, December 2003. D. A. Reynolds and P. A. Torres-Carrasquillo, “Approaches and applications of audio diarization,” in Proceedings of IEEE International Conference on Acoustics, Speech, and Signal Processing (ICASSP ’05), vol. 5, pp. 953–956, Philadelphia, Pa, USA, March 2005. A. Samouelian, J. Robert-Ribes, and M. Plumpe, “Speech, silence, music and noise classification of TV broadcast material,” in Proceedings of International Conference on Spoken Language Processing (ICSLP ’98), vol. 3, pp. 1099–1102, Sydney, Australia, November-December 1998. J. Saunders, “Real-time discrimination of broadcast speech/ music,” in Proceedings of International Conference on Acoustics, Speech, and Signal Processing (ICASSP ’96), vol. 2, pp. 993–996, Atlanta, Ga, USA, May 1996. E. Scheirer and M. Slaney, “Construction and evaluation of a robust multifeature speech/music discriminator,” in Proceedings of International Conference on Acoustics, Speech, and Signal Processing (ICASSP ’97), vol. 2, pp. 1331–1334, Munich, Germany, April 1997. I. Shafran and R. Rose, “Robust speech detection and segmentation for real-time ASR applications,” in Proceedings of International Conference on Acoustics, Speech, and Signal Processing (ICASSP ’03), vol. 1, pp. 432–435, Hong Kong, April 2003. M. Siegler, U. Jain, B. Raj, and R. Stern, “Automatic segmentation, classification and clustering of broadcast news data,” in Proceedings of the DARPA Speech Recognition Workshop, pp. 97–99, Chantilly, Va, USA, February 1997. R. Sinha, S. E. Tranter, M. J. F. Gales, and P. C. Woodland, “The Cambridge University March 2005 speaker diarisation system,” in Proceedings of Interspeech 2005 - Eurospeech, pp. 2437–2440, Lisbon, Portugal, September 2005. A. Vandecatseye, J. P. Martens, J. Neto, et al., “The COST278 pan-European broadcast news database,” in Proceedings of the International Conference on Language Resources and Evaluation (LREC ’04), pp. 873–876, Lisbon, Portugal, May 2004. A. Tritschler and R. Gopinath, “Improved speaker segmentation and segments clustering using the Bayesian information
[33]
[34]
[35]
[36]
[37]
[38]
criterion,” in Proceedings of Eurospeech ’99, vol. 2, pp. 679–682, Budapest, Hungary, September 1999. G. Williams and D. P. W. Ellis, “Speech/music discrimination based on posterior probabilities,” in Proceedings of Eurospeech ’99, vol. 2, pp. 687–690, Budapest, Hungary, September 1999. P. C. Woodland, “The development of the HTK broadcast news transcription system: an overview,” Speech Communication, vol. 37, no. 1, pp. 47–67, 2002. ˇ J. Zibert and F. Miheliˇc, “Development of Slovenian broadcast news speech database,” in Proceedings of the International Conference on Language Resources and Evaluation (LREC ’04), pp. 2095–2098, Lisbon, Portugal, May 2004. ˇ J. Zibert, F. Miheliˇc, J.-P. Martens, et al., “The COST278 broadcast news segmentation and speaker clustering evaluation - overview, methodology, systems, results,” in Proceedings of Interspeech 2005 - Eurospeech, pp. 629–632, Lisbon, Portugal, September 2005. X. Zhu, C. Barras, S. Meignier, and J.-L. Gauvain, “Combining speaker identification and BIC for speaker diarization,” in Proceedings of Interspeech 2005 - Eurospeech, pp. 2441–2444, Lisbon, Portugal, September 2005. S. Young, G. Evermann, M. Gales, et al., The HTK Book (for HTK Version 3.2), Cambridge University Engineering Department, Cambridge, UK, 2004.
ˇ Janez Zibert was born in 1974. He received the B.S. degree in mathematics in 1998 from the Faculty of Mathematics and Physics, and the M.S. degree in electrical engineering in 2001 from the Faculty of Electrical Engineering at the University of Ljubljana. He is currently pursuing his Ph.D. in electrical engineering at the Laboratory of Artificial Perception, Systems, and Cybernetics at the University of Ljubljana with a thesis on audio signal processing of broadcast news data. His research interests include audio signal processing, automatic speech and speaker recognition, and audio information retrieval. He is a Student Member of the International Speech Communication Association and a Member of the Slovenian Pattern Recognition Society and the Slovenian Language Technologies Society. Nikola Paveˇsi´c was born in 1946. He received his B.S. degree in electronics, M.S. degree in automatics, and Ph.D. degree in electrical engineering from the University of Ljubljana, Slovenia, in 1970, 1973, and 1976, respectively. Since 1970, he has been a Staff Member at the Faculty of Electrical Engineering in Ljubljana, where he is currently the head of the Laboratory of Artificial Perception, Systems, and Cybernetics. His research interests include pattern recognition, neural networks, image processing, speech processing, and information theory. He is the author and coauthor of more than 100 papers and 3 books addressing several aspects of the above areas. He is a Member of the IEEE, the Slovenian Association of Electrical Engineers and Technicians (Meritorious Member), the Slovenian Pattern Recognition Society, and the Slovenian Society for Medical and Biological Engineers. He is also a Member of the editorial boards of several technical journals.
ˇ Janez Zibert et al. France Miheliˇc was born in 1952. He studied at the Faculty of Natural Sciences, the Faculty of Economics, and the Faculty of Electrical Engineering all at the University of Ljubljana. There he received the B.S. degree in technical mathematics, the M.S. degree in operational research, and the Ph.D. degree in electrotechnical sciences in 1976, 1979, and 1991, respectively. Since 1978, he has been a Staff Member at the Faculty of Electrical and Computer Engineering in Ljubljana, where he is currently an Associate Professor. His research interests include pattern recognition, speech recognition and understanding, speech synthesis, and signal processing. He has authored and coauthored several papers and 2 books addressing several aspects of the above areas. He is a Member of the IEEE, International Speech Communication Association, the Slovenian Mathematician’s, Physicist’s, and Astronomer’s Society, Slovenian Pattern Recognition Society, and the Slovenian Language Technologies Society.
13