Jul 20, 2002 - SPEED DETECTION OF VEHICLES FROM AERIAL PHOTOGRAPHS ... extraction, Speed detection, Object-based method, Aerial photograph,.
ACRS 2007
SPEED DETECTION OF VEHICLES FROM AERIAL PHOTOGRAPHS Wen Liu, Fumio Yamazaki, T. Thuy Vu, Yoshihisa Maruyama Department of Urban Environment Systems, Graduate School of Engineering, Chiba University, 1-33, Yayoi-cho, Inage-ku, Chiba-shi, Chiba, 263-8522 Japan Liu , Yamazaki KEY WORDS: Vehicle extraction, Speed detection, Object-based method, Aerial photograph, QuickBird ABSTRACT: A new object-based method is developed to extract moving vehicles and subsequently detect their speeds from two consecutive images automatically. Several global and local parameters of gray values and sizes are examined to classify the objects in the image. Vehicles and their associated shadows can be discriminated by removing big objects such as roads. To detect speed, firstly vehicles and shadows are extracted from two consecutive images. The corresponding vehicles from the two images are then linked based on the similarity in shape and size and on the distance within a threshold. Finally, using the distance between the corresponding vehicles and time lag between two images, we can detect the moving speed and azimuth angle. Our test shows promising results for detecting vehicles speeds. Further development will employ the proposed method to a pair of QuickBird panchromatic and multi-spectral images, which are at a coarser spatial resolution. 1. INTRODUCTION As the population in cities continually increases, traffic in cities becomes congested much more than city and infrastructure planning has projected. To solve this problem, monitoring vehicles is one of the important tasks. Normally, the field-based equipment like cameras installed at fixed locations or weigh-in motion sensors on the pavements are used to monitor traffic. Presently, remote sensing technique has become another option to collect traffic information. By using this way, a wider range of information can be collected over a long time period. Thus, vehicle detection through remote sensing can be extensively used to manage traffic, assess fuel demand, estimate traffic emission and also important for transportation infrastructure planning. There have been several researches on vehicle detection using remote sensing data. They can be categorized into two groups. One is model-based extraction, based on vehicle models built from a learning process. The resultant models are used to identify whether the target is a vehicle or not. For example, Gerhardinger et al. (2005) tested an automated vehicles extraction approach based on an inductive learning technique, which was implemented using Features Analyst, an add-in extension of ArcGIS software. Zhao and Nevatia (2001) combined the multiple features
ACRS 2007
of vehicles in a Bayesians network for leaning prior to detecting vehicles. The second group is data-based extraction. In this approach, the processing follows a bottom-up procedure to group pixels into objects and car objects are subsequently discriminated from others. Hong and Zhang (2006) used an object-oriented image processing technique to extract cars. A detailed description, which requires a large number of models to cover all types of vehicles, is the key of the former one. It takes time and cannot be widely applied. The latter is simpler and better to be widely used. Also, those recent researches mainly report on the vehicle position, and few of them go further to speed detection and traffic information database. In this research, a new method is developed for both car extraction and speed detection. The pixels in an image are firstly formed into objects based on their gray values. The objects are then classified and extracted based on several gray value and size indices. The extracted vehicles and shadows are recorded into traffic information. The proposed approach is tested on three acquired aerial images. 2. METHODOLOGY Car extraction and speed detection are carried out on a grayscale image. If a color image is available, its intensity image is used. The proposed methodology consists of the following steps. 2.1 Road extraction Since vehicles are moving on roads, road extraction should be the first processing step. Focusing on the extraction of vehicles and the detection of their speeds, we do not propose any new road extraction method. There have been numerous researches on road extraction from remote sensing images (Nevatia et al. 1980, Baumgartner et al. 1999, and Katartzis et al. 2001). Those can be easily employed to extract road objects in our study. However, to avoid errors involved in road extraction, which influences the final car extraction results, we manually extract roads. The areas out of road areas will be masked as white background. 2. 2 Noise removal (Morphological filter) Prior to carrying out vehicle extraction, other irrelevant information such as road lines on road surface should be removed. Concerning the shapes and sizes of objects, area morphological filtering is chosen (Vu et al. 2004). This filter perfectly removes long and thin road lines and retains the shapes of vehicles. 2.3 Object-based vehicle extraction (initial extraction) Pixels are scanned and grouped into objects according to the criteria of gray values. In this step, the image represents four kinds of objects, e.g. background, road, vehicles (including their shadows) and others treated as noise. The white background can be easily discriminated by the
ACRS 2007
highest range of gray value. Meanwhile, the road surfaces normally show another specific range of gray value. Based on those two gray value ranges, objects are formed. There might be vehicles showing very similar gray value to that of the white background. Fortunately, the background and the road are often big objects compared to the others. These two kinds of objects can be easily extracted based on a size threshold. The remaining pixels are reformed into objects again based on a local threshold of gray value. The fact is that all the pixels belonging to a vehicle should have similar gray value. The vehicles and their associated shadows generally have a specific range of sizes. It is the criteria to distinguish them from the others. Consequently, we obtain an initial extracted result. 2.4 Verification (vehicles and associated shadows) In the initial result, commission error often exists. Thus, we add the morphological filter again as an option. The verification step is to separate vehicles and shadows as well as link a vehicle with its associated shadow. Since shadows show very low gray value, it can be discriminated with vehicle objects. All the objects are assigned the label as their identification (ID) in which shadows and vehicles are labeled as -1 and 1, respectively. Subsequently, the associated shadow of each vehicle is sought in the neighborhood of this vehicle. If there is a shadow near a vehicle, it is cast by this vehicle. Two of them are reassigned to the same ID. It is noted that there is often the case that a dark vehicle is treated as a shadow. As a result, they are assigned the ID of shadow. However, there will not be any link with a vehicle from each of them. Those dark vehicles are then easily reassigned as vehicles. Finally, a vehicle-and-shadow database is developed. The attribute includes the ID number, the coordinate of the center points and the size of the objects. 2.5 Speed detection Speed detection is carried out based on the time lag between two images. Generally, it can be done using two consecutive aerial photographs. Also, the recent observation on the time lag between QuickBird’s panchromatic and multi-spectral images, around 0.2 s, is recommended for speed detection (Etaya et al. 2004). The vehicle-and-shadow database of each image is developed after the vehicle extraction process. Then, the vehicles in two databases with a time lag are linked by size and distance. If a vehicle in the second image is in the range of possible distance from the one in the first image and they have the similar size, they are linked as the same vehicle. Subsequently, using their positions stored in the databases, the speed can be computed. 3. EXPRIMENT AND RESULT 3.1 Vehicle extraction test An aerial photograph which was taken by color film on July 20th, 2002 by Pasco Corp. shown in
ACRS 2007
Figure 1 was used in this study. After scanning the photo, its resolution is 0.25 m/pixel, covering approximately 3 km2 area around Miyanogi junction, Chiba City, Japan.
Figure 1: Aerial photograph of around Miyanogi junction, Chiba, Japan
Figure 2: Three scenes extracted from the aerial photograph with different directions
Figure 3: Result of vehicle extraction, in which white color represents vehicles, and gray color does shadow or dark vehicles
ACRS 2007
The targets are the vehicles in three segments of the expressways shown in boxes in Figure 1. These roads were manually delineated. The vehicle extraction result for the segments shown in Figure 2 is illustrated in Figure 3., in which almost all the vehicles could be extracted. Not only the bright vehicles but also the dark vehicles and some vehicles in the shadow were successfully extracted. Because we extracted both vehicles and shadows even though vehicle’s gray value is similar to that of road, a vehicle can be extracted by its shadow. There still have a few commission errors due to a signboard and its shadow, and lines on the road. An example of the extracted database is shown in Table 1. The accuracy of results highly depends on the objects existing on the road surfaces. CarID 1 2 3 4 5 6 7 8
Xmid/pixelYmid/pixel size/pixel ShadowID Xmid/pixelYmid/pixel size/pixel 190 3 73 261 13 94 2 252 13 89 174 13 55 223 71 225 217 125 827 5 201 122 447 170 171 87 6 161 172 81 93 196 126 7 83 197 53 134 283 153
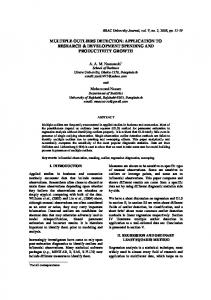
Table 1: Database of the vehicle information, including the position and size (example). 3.2 Speed detection test Three parts of the aerial photograph (Figure 2) with different directions of the expressways are used to examine the accuracy of extraction. To test the speed detection, we simulate consecutive images by moving the vehicles in the original image assuming the time lag of 0.2 s. By this way, we also have the reference data for accuracy assessment. The result of an automated speed detection test shows good agreement with the reference data as shown in Figure 4. The standard deviation of the difference between the reference data and the detected result is 3.2 km/h. The standard deviation of direction difference between the reference data and the detected result is 1.6 degree. Additionally, by speed detection, the noise in the result of vehicle extraction can be removed. It seems the speed of vehicles can be detected automatically if the resolution of satellite images becomes higher than the one currently available.
z z
Reference Result
Figure 4: Comparison of speed detection result with reference data
ACRS 2007
4. CONCLUSIONS A new approach for vehicle extraction and speed detection was proposed. The tests on an aerial photograph show good agreement with the reference data. In the vehicle extraction, the environmental conditions of a road, such as road lines, trees, and signboards were found to have significant effects on the result. Also, a few vehicles were missed even though extracting both vehicles and shadows can reduce omission error. Omission error might increase if shadow is too small or not clear. Speed detection showed good results for three small scenes of an expressway. It should be tested on a bigger scene to check the robustness of the method with larger vehicle numbers as well as under higher traffic condition. In the further research, more tests will be carried out to verify the accuracy of vehicle extraction. We also hope to extend the employment of our method to extract vehicles from satellite images which have much lower resolution than that of aerial photograph. The research outcomes would be useful for urban planning and traffic management. REFERENCE Baumgartner, A., C. Steger, H. Mayer, W. Eckstein, and H. Ebner, 1999. Automatic road extraction based on multi-scale, grouping, and context. Photogrammetric Engineering & Remote Sensing, 65(7):777-785. Etaya, M., T. Sakata, H. Shimoda and Y. Matsumae, 2004. An experiment on detecting moving objects using a single scene of QuickBird data. Journal of the Remote Society of Japan, 24 (4), pp:357-366. Gerhardinger, A., D. Ehrlich, and M. Peseresi, 2005. Vehicles detection from very high resolution satellite imagery. CMRT05. IAPRS, Vol. XXXVI, Part 3/W24. Hong, G., Zhang, Y. and Lavigne, D.A., 2006. Comparison of car extraction techniques for high resolution airborne images. First Workshop of the EARSeL Special Interest Group on Urban Remote Sensing. Katartzis, A., H. Sahli, V. Pizurica, and J. Cornelis, 2001. A model-based approach to the automatic extraction of linear features from airborne image, IEEE Transactions on Geoscience and Remote Sensing, 39(9): 2073-2079. Nevatia, R., and K.R. Babu, 1980. Linear feature extraction ande description, Computer Graphics and Image Processing, 13: 257-269. Vexcel Corporation, 2007. http://www.vexcel.com/products/photogram/ultracam/index.html Vu, T.T., M. Matsuoka and F. Yamazaki, 2005. Preliminary results in development of an object-based image analysis method for earthquake damage assessment. Proc. of 3rd International Workshop Remote Sensing for Post-Disaster Response, Chiba, Japan. Zhao, T., and Nevatia, R., 2001. Car detection in low resolution aerial image. In: International Conference on Computer Vision.