µSystems Research Group School of Electrical and Electronic Engineering
Speedup and Parallelization Models for Energy-Efficient Many-Core Systems Using Performance Counters
Mohammed A. Noaman Al-hayanni, Rishad Shafik, Ashur Rafiev, Fei Xia, Alex Yakovlev
Technical Report Series NCL-EEE-MICRO-TR-2017-205
May 2017
[email protected],
[email protected],
[email protected],
[email protected],
[email protected]
Contact:
Supported by EPSRC grant GR/2017
NCL-EEE-MICRO-TR-2017-205 Copyright © 2017 Newcastle University
µSystems Research Group School of Electrical and Electronic Engineering Merz Court Newcastle University Newcastle upon Tyne, NE1 7RU, UK
http://async.org.uk/
Mohammed A. Noaman Al-hayanni, Rishad Shafik, Ashur Rafiev, Fei Xia, Alex Yakovlev: Speedup and Parallelization Models for Energy-Efficient Many-Core Systems Using Performance Counters
Speedup and Parallelization Models for Energy-Efficient Many-Core Systems Using Performance Counters Mohammed A. Noaman Al-hayanni, Rishad Shafik, Ashur Rafiev, Fei Xia, Alex Yakovlev May 2017 Abstract Traditional speedup models, such as Amdahl’s, facilitate the study of the impact of running parallel workloads on manycore systems. However, these models are typically based on software characteristics, assuming ideal hardware behaviors. As such, the applicability of these models for energy and/or performance-driven system optimization is limited by two factors. Firstly, speedup cannot be measured without instrumenting the original software codes, and secondly, the parallelization factor of an application running on specific hardware is generally unknown. In this paper, we propose a novel method, whereby standard performance counters found in modern manycore platforms can be used to derive speedup without instrumenting applications for time measurements. We postulate that speedup can be accurately estimated as a ratio of instructions per cycle for a parallel manycore system to the instructions per cycle of a single core system. By studying the application instructions and system instructions for the first time, our method leads to the determination of the parallelization factor and the optimal system configuration for energy and/or performance. The method is extensively demonstrated through experiments on three different platforms with core numbers ranging from 4 to 61, running parallel benchmark applications (including synthetic and PARSEC benchmarks) on Linux operating system. Speedup and parallelization estimations using our method and their extensive cross-validations show negligible errors (up to 8%) in these systems. Additionally, we demonstrate the effectiveness of our method to explore parallelization-aware energy-efficient system configurations for many-core systems using energy-delay-product based formulations.
1
Introduction
Aggressive technology scaling has facilitated significant reductions in device geometries and hence circuit delay, leading to performance improvement [1]. According to Moore’s and Koomey’s laws the trend of scaling has led to doubling of performance per watt every 1.5 years [2, 3]. Many studies have been undertaken to date realize the trend of performance growth with many CPU cores. For instance Pollack’s rule suggests that performance is increasing approximately proportional to the square root of the complexity defined by the power density per unit area [4]. According to this rule, doubling the number of processors also doubles the performance [1]. As such, multi- or many-core systems are expected to deliver further improvement in throughput and latency for the same die area. However, such performance growth is also being inhibited by high performance densities typically seen in modern technology nodes, leading to the concept of dark silicon [5]. Hence, energy-efficient resource allocation is of crucial importance for many-core systems with high-performance requirements [3]. NCL-EEE-MICRO-TR-2017-205, Newcastle University
1
Mohammed A. Noaman Al-hayanni, Rishad Shafik, Ashur Rafiev, Fei Xia, Alex Yakovlev: Speedup and Parallelization Models for Energy-Efficient Many-Core Systems Using Performance Counters Speedup models are popular methods to reason technology-independent normalized performance improvements with many-cores. In 1967 the first speedup model was proposed by Amdahl [6], which described how the performance of fixed workloads can be estimated when executed on N processors. Many studies followed the idea of Amdahl’s model to extend performance reasoning for parallel workloads executed on multi- or manycores systems. In [7] Hill and Marty complemented Amdahl’s model to define performance expectations of systems with heterogeneous and dynamic configurations via Pollack rules [4]. In [8] these performance models were generalized for homogeneous system configurations. Both of these models were elaborated further by [9] to investigate the theoretical multi-core scalability and to determine the optimal multi-core performance. In [10] performance models were defined as a function of the system architecture. Detailed account for the additional uncore theoretical components was proposed, including contributions from on-chip interconnect, pipeline and cache memory subsystems. The effect of memory was also highlighted by [11], which showed how performance speedup can be capped by shared memories in a homogeneous many-core system. The power contributions of different architectural components for various system configurations were elaborated by [12]. The power models demonstrated the trade-offs between speedup and relevant power consumptions. Table 1 shows summary of the existing studies relevant to speedup models. As can be seen, these models have the following limitations. Firstly, the ideal assumptions on both the workload and the system platform limit the applicability of the models for real systems. For instance, they do not consider real system overheads, such as scheduling and hardware synchronizations. Secondly, they do not use real benchmark applications to estimate the system performance. Thirdly, they do not highlight determination of application parallelization factors and their impacts on the speedup models; instead they consider theoretical limits of parallelization factors. As such, using speedup and parallelization models to identify suitable core allocations remains challenging for energy efficiency considerations. To address these limitations, this paper makes the following contributions:
No No No No No No No No Yes
user control user control No No No No estimated estimated user control and estimated
Power
ation fa
ctor
No No Yes No Yes Yes Yes Yes Yes
Paralleli z
k nchmar Real Be
ance co unter
No No Yes Yes Yes Yes Yes Yes Yes
Perform
System overhea d
Yes Yes No Yes similar principle related similar principle Yes Yes
Model Amdah l’s
[6–11] [12] [13, 14] [15] [16] [17] [18] [19] Proposed Model
s study Previou
Table 1: Existing Speedup Models and the proposed model.
No Yes No No Yes No No Yes Yes
• Extend Amdahl’s speedup model considering applications and system software related overhead separately. • Propose a new method to model parallelization and speedup via performance counters to avoid the need
NCL-EEE-MICRO-TR-2017-205, Newcastle University
2
Mohammed A. Noaman Al-hayanni, Rishad Shafik, Ashur Rafiev, Fei Xia, Alex Yakovlev: Speedup and Parallelization Models for Energy-Efficient Many-Core Systems Using Performance Counters for instrumenting applications. We show that speedup can be accurately estimated as a ratio of instructions retired/executed per cycle of parallel many-core system to that of a single core system. • Extensive analysis of synthetic and real (PARSEC) benchmarks to validate the speedup and parallelization factors based on our proposed model. • Demonstrate the effectiveness of our method for identifying parallelization-aware energy-efficient system configurations using power normalized performance and energy-delay-product metrics. The rest of the paper is organized as follows. Section 2 gives the background on our proposed models. Section 3 describes the proposed speedup model, together with power and energy related metrics. Section 4 describes our experimental set up, the performance counters and the benchmark application used. Section 5 presents the cross-validation of the models with measured speedups and applicability of our method. Section 6 proposes the new paradigm of parallelization-aware energy-efficient computing. Finally, Section 7 concludes the paper.
2
Background
We consider a system consisting of N cores, and a workload with a parallel part and a sequential part. The fraction of parallel workload is P; hence, the sequential part of workload is (1 − P). The P value known as the parallelization factor varies from 0 to 1; 0 indicates all sequential workload and 1 indicates fully parallelizable workload. In our study we use a synthetic benchmark application [20], whereby the parallelization P and core allocations (from 1 to N) can be controlled. Amdahl’s speedup model calculations are based on a comparison of execution time for a fixed workload I0 on a single core with the execution time for the same workload executed on the entire N-core system. Time T (1) is needed to execute both the sequential and parallel parts of workload I0 on a single core, and T (N) is needed to execute the sequential part of workload I0 on a single core and the parallel part on N cores [21, 22]. T (1) =
T (N) =
I0 IPSI0
, and
(1 − P) · I0 P · I0 + IPSI0 N · IPSI0
(1)
,
(2)
where IPSI0 is the throughput measured in instructions per second for the workload I0 on a single core. Thus IPS based Amdahl’s speedup model can be derived as follows [6]. SP(N) =
T (1) 1 = T (N) (1 − P) + NP
.
(3)
According to [22], this speedup can also be define as: SP =
IPSI0 (N) IPSI0
.
(4)
In other words, speedup is also the ratio of the throughput achieved by executing on N cores to the throughput achieved by executing on a single core [21]. NCL-EEE-MICRO-TR-2017-205, Newcastle University
3
Mohammed A. Noaman Al-hayanni, Rishad Shafik, Ashur Rafiev, Fei Xia, Alex Yakovlev: Speedup and Parallelization Models for Energy-Efficient Many-Core Systems Using Performance Counters
3
Proposed Speedup Models
Amdahl’s speedup model assumes that the workload has a single P. In real systems, the overall workload usually consists of multiple tasks, including system software (e.g. OS), and each task may exhibit a different parallelizability and therefore different P. One potential method of run-time management is the parallelizabilityaware optimization of performance and/or energy. For that it is important to treat individual applications and the system software separately. In this section we develop a new speedup model that calculates application speedup and consider realistic system software overhead separately. In the rest of the paper, we deal with the case of a single application running on a real system with system software at the same time. Expanding to multiple concurrently running applications will be a future task.
3.1
Modeling Basics
We consider that the overall workload is the number of total instructions executed by the system during the execution of any specific application. The total number of instructions I when a specific application is executed includes the application instructions I0 plus the system software instructions and halt cycles caused due to resource sharing, ∆I, given as: I = I0 + ∆I
.
(5)
If the number of instructions I0 in (5) can be obtained, in order to calculate speedup we need to find out IPS. In other words, in addition to the number of instructions, we need to know the time spent on executing these instructions, which usually implies instrumenting both applications and system software for time monitoring. On the other hand, instructions per clock IPC does not need the monitoring of time and only requires counting the number of clock cycles spent in the execution. In the next section we will explain how to obtain the relevant clock cycle, with which the IPC can be calculated as follows: IPC = IPCI0 + IPC∆I =
I0 ∆I + C C
,
(6)
where C is the number of clock cycles spent on the execution. In a many-core system the estimation of effective IPC for a parallel workload given by (6) can be challenging as the instructions retired per core against their corresponding execution cycles cannot be used to estimate an overall average IPC. This is because some cores execute parallel workloads independent of of the other cores, while the core that is in charge of spawning threads executes mostly sequential, but also some parallel workloads. The execution of a workload therefore causes participating cores to record different numbers of clock cycles. We hypothesize that Cmax (recorded from the core with the highest unhalted clock C value among all cores), generally gives a good indication of the overlapped parallel execution times, measured by the time-stamp counter. As such, the effective IPC in (6) can be defined as: IPC =
I0 CMax
+
∆I CMax
,
(7)
Our experiments in Sections (4) and (5) will show that (7) can be used with confidence to model speedup. The resulting throughput expressed by IPS as follows: IPSI0 = IPCI0 · F
NCL-EEE-MICRO-TR-2017-205, Newcastle University
,
(8)
4
Mohammed A. Noaman Al-hayanni, Rishad Shafik, Ashur Rafiev, Fei Xia, Alex Yakovlev: Speedup and Parallelization Models for Energy-Efficient Many-Core Systems Using Performance Counters where F is the system operating frequency. This supports the calculations of sequential and parallel execution time in (1) and (2).
3.2
Speedup Calculations
For speedup, we can substitute IPC for IPS as the system frequency is eliminated from the equation in case of the system running at the same frequency, i.e. SP =
IPSI0 (N) IPCI0 (N) = IPSI0 IPCI0
,
(9)
where IPCI0 and IPSI0 are the instruction per clock and instruction per second, respectively in single core with full sequential workload, and IPCI0 (N) and IPSI0 (N) are the instruction per clock and instruction per second, respectively for given P and N configurations of a parallel application on a many-core system.
3.3
Estimation of Parallelization Factor
Once the speedup of an application is known through (9) it can be used to calculate the parallelization factor P from equation (3) as: P=
N · (1 − SP) SP · (1 − N)
.
(10)
This expression is used in Section (5.3) to calculate parallelization using performance counters. Note that the calculation for (N > 1) give negative numerator and denominator, thus it gives positive parallelization value.
3.4
Power and Energy Normalized Performance
Power normalized performance is an established metric related to the power efficiency of systems. It is simple to model the performance achievable at the same cooling capacity by calculating performance per watt (Per f /Watt) [12, 21]. Power normalized performance can be calculated from dividing the system performance from (9) by the total power (Wtotal ): Per f /Watt =
IPSI0 (N) Wtotal
.
(11)
Power normalized performance model is the reciprocal of energy per instruction (EPIN ) because performance is the reciprocal of execution time [12, 21]. Thus, EPIN can be calculated from dividing the total power (Wtotal ) by the system’s performance (9): EPIN =
Wtotal IPSI0 (N)
.
(12)
As metrics, EPI and power normalized performance can be limiting. For instance, if an execution progresses extremely slowly but consumes very little energy, it can result in good EPI and power normalized performance numbers because it consumes almost zero power. On the other hand, it may not get anything useful done. In effect, EPI and power normalized performance promote the minimization of energy but does not care much about performance. To capture this concern the metric known as energy-delay-product (EDP) [23] puts more emphasis on the completion of tasks by explicitly incorporating delay. In our method, EDP can be obtained
NCL-EEE-MICRO-TR-2017-205, Newcastle University
5
Mohammed A. Noaman Al-hayanni, Rishad Shafik, Ashur Rafiev, Fei Xia, Alex Yakovlev: Speedup and Parallelization Models for Energy-Efficient Many-Core Systems Using Performance Counters Table 2: Experimental platforms used in this work. Parameters Processor Name Processor No. Lithography No. of Sockets Cores per Socket No. of Cores L1D Unified Cache L1I Unified Cache L2 Unified Cache L3 Shared Cache Base Frequency
Core i7 i7-4820k 22 nm 1 4 4 32 KB 32 KB 256 KB 10 MB 3.7 MHz
Intel CPU Type Xeon Xeon Phi E5-2630V2 7120X 22 nm 22 nm 2 1 6 61 12 61 32 KB 32 KB 32 KB 32 KB 256 KB 512 KB 15 MB 2.60 MHz 1.24 MHz
from (11) and (2) as follows: EDP = Wtotal · (
4
(1 − P) · I0 P · I0 2 + ) . IPSI0 N · IPSI0
(13)
Experimantal studies
The models on speedup, parallelization, power and energy metrics are demonstrated in this section through experiments.
4.1
Experimental Platforms
In this work we make use of three different Intel platforms. Table 2 explains the general architecture details of all platforms. All of these systems additionally allow hyper-threading. In all our experiments we disabled hyper-threading by allocating tasks to physical (not logical) cores. Although these systems are from Intel, other platforms such as those from ARM also provide similar performance counters which supports the generality of this work. Extending this investigation to other platforms will be part of our future work.
4.2
Performance Counters
Hardware performance counters are a set of special purpose regisers built into CPUs to store the counts of hardware activites in a specific system. Users depend on those counters to collect low-level performance analysis. This performance data varies depending on the performance monitoring hardware and system software configuration. An interface to access model specific registers from user space is provided via the Linux ModelSpecific Register (MSR) module. This allows the user to extract hardware performance counter events with an unmodified Linux kernel. Likwid, used in this paper, is a lightweight performance oriented tool suite for x86 multi-core processors [24, 25]. The following performance counters are used in this work. INST R_RET IRED_ANY counts the instruction retired which leave the retirement unit. Such instructions have been executed and their results are correct [26]. CPU_CLK_UNHALT ED_CORE counts the number of unhalted clocks while the core is not in a halt state. This performance counter is obtained through clock cycle recording. If the clock frequency changes the number
NCL-EEE-MICRO-TR-2017-205, Newcastle University
6
Mohammed A. Noaman Al-hayanni, Rishad Shafik, Ashur Rafiev, Fei Xia, Alex Yakovlev: Speedup and Parallelization Models for Energy-Efficient Many-Core Systems Using Performance Counters of cycles will not be proportional to time. And halted states also affect the accuracy of using this performance counter to represent time [27]. CPU_CLK_UNHALT ED_REF counts the number of reference clocks at the Time Step Counter (T SC) rate, while the core is not in a halt state. This event is not affected by core frequency changes. It counts at the same frequency as the T SC [27]. In our model, we need both the number of instructions and the number of clock cycles for calculating IPC. For the number of instructions, we use INST R_RET IRED_ANY as application workload I0 in equation (5). For the number of clock cycles we use CPU_CLK_UNHALT ED_CORE as IPCI0 in equation (7) which represent the accurate perfromance counter to calculate IPC [27]. In Section (3) we showed that the number of cycles represents time. CPU_CLK_UNHALT ED_REF shows the number of cycles which includes halted cycles, hence is closer to representing real execution time. In the real world, halted cycles occur when the system has nothing to run. This occurs when threads waite for interrupt thus the counting includes halted cycles in real execution time [28, 29]. However it is not always available in Intel, as Intel focuses on unhalted clock for IPC calculations [27]. In our experiments we explore the use of unhalted clock to calculate speedup, and the outcome is presented in Section (5). In addition, hardware performance counters exist that provide power and energy information. For instance, PW R_PKG_ENERGY counts the CPU energy consumption [27]. In previous work, it has been shown that this performance counter produces reliable results validated through direct measurements such as DC instrumntation [30]. It is used in conjunction with the execution time information inferred from unhalted clock performance counters in Section (6.1) to derive all power and energy information. In this paper we focus on CPU energy which changes with the number of utilized cores and the parallelization factor P and disregard other energy consumption which have weak correlations with these factors (e.g. memory energy). From (3), it is possible to calculate speedup if T(1) and T(N) can be obtained. However, this requires running a workload at least twice, with different core configurations. To avoid having to run a workload more than once, time-based calculations of P require the knowledge of sequential and parallel time, which requires instrumenting the code of a workload. By using the performance counters listed above, however, it may be possible to obtain the same functionality as instrumenting separate parallel and sequential time monitoring, whilst only needing to monitor the start and end of a workload. This means that there is no need to modify workloads in any way. Even though we motivate our work to avoid time measurements, in our experiments we use timeinstrumented workload code when possible as well as make pairs of runs with different numbers of cores. This helps demonstrate the validity of our approach of avoiding direct time measurements through comparisons.
4.3
Benchmark Application
4.3.1
Synthetic Benchmark
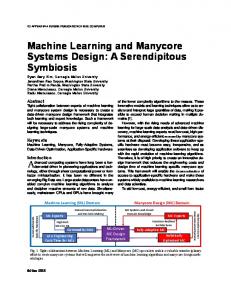
The synthetic benchmark is executed in all three platforms as shown in Table 2 at the base frequencies. The calculation of the theoretical speedup models heavily relies on the knowledge of the parallelization factor P. However, a typical application has an unknown and variable P. Hence, we developed a synthetic benchmark, which allows the control of its P value. The benchmark is available for free usage and research from [20]. The benchmark has distinct sequential and parallel sections, as shown in Fig. 1. Inside, it performs a looped
NCL-EEE-MICRO-TR-2017-205, Newcastle University
7
Mohammed A. Noaman Al-hayanni, Rishad Shafik, Ashur Rafiev, Fei Xia, Alex Yakovlev: Speedup and Parallelization Models for Energy-Efficient Many-Core Systems Using Performance Counters
Pin to Core0 Execute (1–P)·X cycles Create N pthreads Pin to Core0
parallel
sequential
START
...
Execute P·X/N cycles
Pin to Core(N–1) Execute P·X/N cycles
Join pthreads
END
Figure 1: Flowchart of the benchmark application with programmable P, considering a total workload of X cycles. arithmetic calculation (square root), which ensures a CPU-heavy workload with minimal memory access. The number of cycles in parallel and sequential parts is determined by the requested P value. The sequential part is pinned to Core 0, and the parallel code is evenly distributed between cores using core-affinities. It is important to note that the benchmark can accept P=1 and run only the parallel section. However, the actual parallelization achieved by the platform may not meet the requirement. This will be carefully considered when analyzing experimental results. 4.3.2
PARSEC Benchmarks
PARSEC benchmarks are executed at base frequency on the Core-i7 platform only. PARSEC [31, 32] is a reference application suite used in many fields including industry and academia, for studying concurrent applications on parallel hardware. Some of them parallelized with OpenMP, while the others parallelized with gcc-pthreads. PARSEC consists of 12 applications representing a diverse set of commercial and emerging workloads [31]. In our study we choose 9 PARSEC benchmarks having different parralelizabilties and memory usage intensities, [31–33]. The input set used is ”native” and the benchmarks chosen are bodytrack, blackscholes, facesim, fluidanimate, freqmine, swaptions, streamcluster, canneal and dedup.
5
Results and validation
This section describes the model calculations and experimental outcomes. We classify the calculations into fixed workload part and extra workload, demonstrate the validations of execution time and speedup and the estimation of parallelization factor P.
5.1
∆I Calculation
In the first stage of our experiments, we use the Core i7 platform to find ∆I and I0 . The synthetic benchmark application was run on all core configurations (from N=1 to N=4) and programmed P ranging from (0 to 1). The first observation was that for all N=1 experiments Core 0 showed exactly the same number of instructions retired with no random variation, which is an indication that all system workloads have been scheduled on idle NCL-EEE-MICRO-TR-2017-205, Newcastle University
8
Mohammed A. Noaman Al-hayanni, Rishad Shafik, Ashur Rafiev, Fei Xia, Alex Yakovlev: Speedup and Parallelization Models for Energy-Efficient Many-Core Systems Using Performance Counters
Figure 2: Application instructions per clock for synthetic benchmark using variable N and P. cores (cores that do not have applications running), and Core 0 has been exclusively running the application workload I0 , which is 5.6E+09. Knowing I0 , we were able to calculate IPCI0 from (6) and the speedup based on IPCI0 from (9). The results are presented in Figures 2 and 3. Fig. 2 shows the throughput, in IPS, that is achieved with the application’s programmed P value ranging from 0 to 1 and the number of cores ranging from 1 to 4. The maximum throughput is clearly achieved with P=1 and N=4. It is important to note that with a programmed P of 0 (i.e. nonparallelizable code) increasing the number of cores does not affect the throughput, and with a single core, no matter what the programmed P is the throughput is also constant. Fig. 3 shows the speedup as a function of N and P. It can be seen that the maximum speedup achievable with N=4 and P=1 is close to 4, which shows that the synthetic benchmark dose not have hidden synchronizations and other effects limiting parallelizability, and the hardware platform’s impact on IPC-based speedup is small. The second finding is that ∆I reduces with N and P increasing. We tested the hypothesis that system workload ∆I is proportional to time, and confirmed that ∆I/T (N) approximates to a constant with the average of 6.58E+04 and the standard deviation of 9.53E+03. Also the system software workload is very small i.e. 1-2%. However, these extra instructions can cause resource constraints and result in halt cycle. In our experiments we have observed a 1.55% increase of halt cycles for P=0 and N=1. In the second stage, we run PARSEC benchmarks; the applications run in all core configurations (from N = 1 to N = 4), in PARSEC we do not have programmed P. The first observation is that the total instruction retired have fixed values for each application, with small changes (