Available online at www.sciencedirect.com Available online at www.sciencedirect.com
Procedia Engineering
ProcediaProcedia Engineering 00 (2011) Engineering 24 000–000 (2011) 737 – 742 www.elsevier.com/locate/procedia
2011 International Conference on Advances in Engineering
Sphericity Evaluation Using Maximum Inscribed Sphere Method MENG Fanwua a*, XU Chunguanga, LI Haimingb, Hao Juana a
School of Mechanical Engineering, Beijing Institute of Technology,Beijing 100081, China b China North Engine Research Institute, NORINCO GROUP, Datong 037036, China
Abstract The maximum inscribed sphere (MIS) method is an important method to evaluate sphericity error suitable for the sphere with the maximum material condition of a concave. It is proven that the MIS of a data point set is decided only by four points in the paper. An algorithm of sphericity evaluation based on the MIS is proposed. Six points with extreme coordinates are selected as an initial subset and the MIS is constructed by four of them. Another point which is the farthest from the center among the set replaces one of the former four points each time. According with the minimum criterion, the final sphere is just the MIS of the data point set when all data points is outside the sphere. The validated results show that the proposed strategy offers an effective way to identify the control data points at few iterative turns and gives an efficient approach to solve the sphericity problems.
© 2011 Published by Elsevier Ltd. Open access under CC BY-NC-ND license. Selection and/or peer-review under responsibility of ICAE2011 Keywords:maximum inscribed sphere; error evaluation; sphericity error; algorithm;
1. Introduction Spheres are widely used in many engineering applications. Spherical geometric errors can have a serious effect on the performance of mechanical parts. Any defects such as form error, surface roughness, and waviness on a spherical surface may result in the generation of a large amount of heat and in turn lead to wear and life reduction. Therefore, it is important to evaluate sphericity error accurately and effectively. The sphericity error is the annular space between two concentric spheres which are the reference feature and actual feature sphere. There are four common methods to evaluate sphericity error: least square sphere (LSS), minimum zone sphere (MZS), minimum circumscribed sphere (MCS) and maximum inscribed sphere (MIS). The MIS is an important method to evaluate sphericity error suitable for the sphere with the maximum material condition of a concave. The sphericity is a 3D problem that the 2D
* Corresponding author. Tel.: +086-10-68912714; fax:+086-10-68912715. E-mail address:
[email protected].
1877-7058 © 2011 Published by Elsevier Ltd. Open access under CC BY-NC-ND license. doi:10.1016/j.proeng.2011.11.2728
2738
MENG Fanwu et al. / Procedia Engineering (2011) 737 – 742 MENG Fanwu/ Procedia Engineering 00 (2011)24000–000
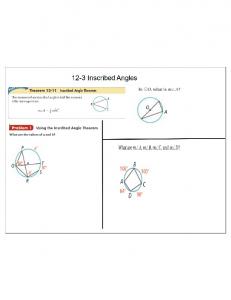
circularity is insufficient to give the true properties to the spherical surface. Some efforts have been devoted to evaluating the sphericity error using different algorithms from the beginning research of sphericity error evaluation. (1) Danish [1] calculated the minimum zone solution for sphericity error using discrete Chebyshev approximations; (2) Kanada [2] used the down hill simplex search method to solve the minimum zone solution for sphericity evaluation problems. The simplex search is a sequential gradient search. The simplex for sphericity evaluation is a tetrahedron. The objective value at a vertex is the difference between the farthest and nearest distances from the vertex to its measured points. For each iteration, the vertex with the greatest objective value will be rejected and replaced by a new point in the opposite side of the original tetrahedron. If the objective value at the new point is still the greatest, the search is continued in alternate direction, perhaps with a smaller step size, or stopped. The search technique is efficient and easy to code. But the simplex search does not guarantee a global minimum solution to non-convex problems like sphericity. (3) Fan and Lee [3] proposed an approach with minimum potential energy analogy to the minimum zone solution of spherical form error. And the problem of finding the minimum zone sphericity error is transformed into that of finding the minimum elastic potential energy of the corresponding mechanical system; (4) Chen [4] constructed three mathematical models to evaluate the MCS, the MIS and the MZS by directly resolving the simultaneous linear algebraic equations first. Then, the minimum zone solutions can be obtained by comparing the solutions between the 4–1 models, the 1–4 models, the 3–2 models and the 2–3 models; (5) Samuel [5, 6] established the minimum circumscribed limacoid, maximum inscribed limacoid and minimum zone limacoid based on the computational geometry to evaluate sphericity error; (6) Wen [7] used immune algorithm (IA) for sphericity error evaluation. It is proven that IA is a favorable alternative for solving minimum zone sphericity error. (7) Cui [8] devised genetic algorithm to evaluate the form error of a sphere. (8) He [9] propoed a geometric approximation technique to obtain the minimum sphericity error from the form data. The technique regarded the least square sphere center as the initial center of the concentric spheres, and moved gradually the center to reduce the radial separation till the minimum radial separation center was got. (9) Huang [10] solved the minimum zone solution for sphericity problems using the Voronoi diagram. The whole space is divided into several regions using the Voronoi diagrams that the minimum sphericity becomes feasible on the vertices of these regions. This paper presents a new mathematical model to solve the sphericity problems based on the MIS. The remainder of the paper is arranged as follows: The criteria of MIS are first proposed in Section 2. Then, a computation strategy is proposed in Section 3 and experimental results are shown in section 4. Finally, conclusions are described in Sections 5. 2. Criteria of the maximum inscribed sphere Suppose S={pi|i=1, 2,..., n}be the data point set, where pi(xi, yi, zi) represents the ith data point. If all data points are on or outside a sphere, the sphere is called the inscribed sphere. The maximum radius sphere among this set of sphere is called the maximum inscribed sphere. These points on the MIS are called the control points. In general, there are three geometric criteria of MIS like that of MCS [11]. A. two point model The two point model is shown in Fig. 1(a). The MIS is determined by two points on the sphere constructing the segment which passes through the center of the sphere.
3739
MENG Fanwu et al. / Procedia Engineering (2011) 737 – 742 MENG Fanwu/ Procedia Engineering 00 24 (2011) 000–000
B. three point model The three point model is shown in Fig. 1(b). The MIS is determined by three points on the sphere constructing the triangle which the center of the sphere is inside. C. four point model The four point model is shown in Fig. 1(c). The MIS is determined by four points on the sphere constructing a tetrahedron that contains the center of the sphere. Theorem 1: The MIS of a data point set is decided only by four points. That is to say, the criterion of two point model and three point model are not suitable for the MIS. Proof: Suppose the MIS O of set S is constructed by point A and point B, as shown in Fig. 2(a). Point C is nearest point from center of sphere O other than point A and point B. Then, point C must be outside of sphere O. The sphere O' constructed with point A, B and C must be bigger than sphere O. Because no point is inside of sphere O', sphere O' is an inscribed sphere, too. So sphere O is not the maximum inscribed sphere of set S, and two point model is not suitable for MIS. Three point model can also be proven as shown in Fig. 2(b).
(a) two point model
(b) three point model
(c) four point model
Fig. 1. geometric criteria of MIS
G A C
D O E
F
B O´
(a) two points construct the MIS
(b) three points construct the MIS
Fig. 2 MIS constructed by two or three points
The sphericity error Δ is calculated by:
Δ r1r0
Here: r0 is the radius of the MIS; r1 is the distance from the farthest point to the center of the MIS. It is obvious that the MIS is decided by four control points of data point set according to the geometric criterion of MIS. But the control points can not be obtained directly by the above criterion. A calculation model depending on the method of selecting the control points must be constructed to find the MIS. 3. Computation strategy
4740
MENG Fanwu et al. / Procedia Engineering (2011) 737 – 742 MENG Fanwu/ Procedia Engineering 00 (2011)24000–000
To evaluate precisely the sphericity error of mechanical parts according with maximum inscribed sphere, it is the key to search out the four control points which construct MIS. But it is difficult to do so because there is not a way to directly identify these points. To get the desired results for sphericity error evaluating, data obtained from measurement devices must be analyzed using appreciate computer-based an algorithm, and this algorithm must follow the specifications laid down in the Standards. Moreover, the algorithm must be efficient, reliable in evaluating roundness error. Theorem 2: Suppose sphere C is the MIS of set S, the adding of any new data points into C can not give a bigger MIS than that of S. Proof: According to the definition of MIS, it is easy to prove this theorem. Adding a new point into the MIS of set S, the new MIS is decided by new point and three of four control points. And if adding a new data points set into the MIS, the nearest point from the center of the MIS is critical. A set S can be categorized into two subsets, P and P'. P is the subset which the MIS is known. And P' contains data points other than those in subset P. the problem to identify control points of MIS is equal to identify the point which is the nearest point from the center of the MIS. We can select the six extreme points of data points as initial subset. If all data points are on or outside the MIS of the six data points, it is the MIS of all data points. The criterion of MIS show that the MIS of a measured data point set is determined by a small number of data points. But the critical data points can not be obtained directly. The sphericity evaluation is a time consuming work especially when the number of measured points is large. So the computational efficiency is as important as the solving of the sphericity. According to mathematical model proposed, the computation procedure is shown as following: • Step 1 Compare each point of the measured data points set S and search out the six data points p1(xmin, y1, z1), p2(xmax, y2, z2), p3(x3, ymin, z3), p4(x4, ymax, z4), p5(x5, y5, zmin),and p6(x6, y6, zmax), which have extreme x coordinate, y coordinate, or z coordinate, respectively; • Step 2 Let p1, p2, p3, p4 , p5 and p6 be a subset S'. Compute the MIS and decide the four control points of S'; • Step 3 Judge whether all data points on or outside the sphere. If it is, the MIS of S is obtained, shift to Step 5, otherwise make out the nearest data point pn from center of the sphere and shift to next step; • Step 4 Let four control points and pn be new subset S'. Compute the MIS and decide the four control points of S', then shift to step 3; • Step 5 Search out the farthest data point pf from the center of the MIS. The sphericity errorΔ is calculated by Eq. 1. 4. Validation and discussion The computer programs were written in C++ according to the proposed algorithm. The program were tested for the data available in the literature. The data sets are shown in Table 1 and Table 2. The algorithm developed in the present work is validated with the published results. The sampling data available in literature [8] is shown in Table I. The results are tabulated in Table III. For the data given in Data Set 1, the reported radius of MIS is 20.00162mm [8], whereas the present method gives radius of 20.0016213mm. Four control points satisfying the MIS are the 6th, 8th, 19th and 24th. The 14th point is the farthest to the MIS. The sampling data available in literature [6] is shown in Table II. The results are tabulated in Table III. For the data given in Data Set 2, the reported radius of MIS is 0.9959 [6], the present method gives radius of 0.995978. Four control points satisfying the MIS are the 8th, 14th, 16th and 35th points. The 22nd point is the farthest to the MIS. Table 1. Data Set 1[8]
5741
MENG Fanwu et al. / Procedia Engineering 24 (2011) 737 – 742 MENG Fanwu/ Procedia Engineering 00 (2011) 000–000 No. 1 2 3 4 5 6 7 8 9 10 11 12 13
xi(mm) 40.00068100 54.14580566 50.00166358 40.00068100 29.99935791 25.85770377 29.99945492 40.00068101 50.00206659 60.00400000 54.14490155 40.00068100 25.85648655
yi(mm) 30.00080600 30.00080600 40.00178858 44.14516104 40.00212908 30.00080599 19.99957990 15.85705916 19.99942042 30.00080600 44.14502655 50.00300000 44.14500044
zi(mm) 80.00500000 74.14553666 74.14393721 74.14476705 74.14441875 74.14338923 74.14428157 74.14415884 74.14450714 60.00041200 60.00041200 60.00041200 60.00041200
No. 14 15 16 17 18 19 20 21 22 23 24 25 26
xi(mm) 19.99699999 25.85638767 40.00068101 54.14500045 54.14480344 50.00145491 40.00068100 29.99906658 25.85658466 29.99866359 40.00068101 50.00185792 40.00068100
yi(mm) 30.00080599 15.85651266 9.998000000 15.85648657 30.00080600 40.00157991 44.14557305 40.00242041 30.00080599 19.99878858 15.85735427 19.99962909 30.00080600
zi(mm) 60.00041200 60.00041200 60.00041200 60.00041200 45.85628955 45.85718190 45.85564495 45.85599325 45.85631566 45.85542332 45.85696027 45.85661197 39.99699999
Table 2. Data Set 2 [6] No. 1 2 3 4 5 6 7 8 9 10 11 12 13 14 15 16 17 18 19 20
xi 0.7826 -0.748 -0.0632 0.0128 -0.0166 0.219 -0.2689 -0.6484 0.0425 -0.8319 0.5364 0.7894 -0.1405 0.0755 -0.2803 0.217 0.7252 -0.7934 0.4571 0.8288
yi -0.5434 -0.5102 -0.0273 0.5284 0.3702 0.5347 -0.349 -0.3669 -0.2701 0.5366 0.327 0.623 0.8314 -0.4434 -0.9239 0.1673 -0.6338 0.2614 0.8672 -0.4416
zi 0.3128 0.4158 1.0046 -0.8454 -0.9262 -0.8167 -0.8942 -0.6513 -0.9558 -0.1474 0.7831 0.0312 0.5453 -0.8831 0.2617 0.9634 0.2723 -0.5367 0.2103 -0.345
No. 21 22 23 24 25 26 27 28 29 30 31 32 33 34 35 36 37 38 39 40
xi -0.7594 0.4029 -0.3379 0.1728 0.8387 0.9989 0.7089 -0.0595 -0.0451 0.7196 0.1935 -0.716 -0.3249 -0.0325 0.1292 0.5826 -0.0392 0.0199 0.8254 -0.5822
yi -0.2135 0.1826 0.2205 -0.5212 0.5194 0.0085 0.3048 0.1537 -0.0381 0.2112 -0.0631 0.2111 0.5776 0.004 0.0986 -0.8136 -0.1252 0.1022 0.2545 0.7861
zi -0.603 -0.8993 -0.9125 0.8349 0.2075 0.0553 -0.6392 0.9886 -0.9977 -0.6629 -0.9724 0.6617 0.7506 -0.998 -0.9788 0.0115 -0.9832 -0.9932 -0.5065 0.2104
The evaluation of the sphericity error by the algorithm developed in the present work yields superior results with radius values equal to or more than the results published in the literature as shown in Table III. For the Set 1, only 7 data points of 26 data points are used to obtain the MIS. For the Set 2, only 8 data points of 40 data points are used to obtain the MIS. To further estimate the performance of the proposed strategy, an example including 100 data points is used. Only 12 data points is used to compute MIS. That shows there need few turns of iterations. When data points are very large, it can compute MIS very quickly. In summary, the new algorithm of the MIS method for evaluating sphericity error has the advantage of less computational complex, fast calculation speed and little iteration. 5. Conclusion It is proven that the MIS is determined by four critical measured points and only four point model is suitable for MIS method in the paper; The search of the sphericity evaluation is a time-consuming work, especially when the number of measured points is large. An algorithm giving the MIS solution for the sphericity evaluation is successfully developed. The new algorithm of the MIS method for evaluating sphericity error has the advantage of less computational complex, fast calculation speed and little iteration. The efficiency and reliability of the algorithm has been proven with two examples from literatures.
6742
MENG Fanwu et al. / Procedia Engineering (2011) 737 – 742 MENG Fanwu/ Procedia Engineering 00 (2011)24000–000
Acknowledgements This research is supported by the 111 Project, Grant No. B08043. References [1] Danish PB, Shunmugam MS. “An algorithm for form error evaluation using the theory of discrete and linear Chebyshev approximation,” Comput Methods Appl Mech Eng1991;92:309–24. [2] Kanada T. “Evaluation of spherical form errors-computation of sphericity by means of minimum zone method and some examinations with using simulated data,” Prec Eng1995;17:281–9. [3] Fan K.C., Lee J.C. “Analysis of minimum zone sphericity error using minimum potential energy theory,” Prec Eng1999;23:65–72. [4] Chen C. K., Liu C. H. . “A study on analyzing the problem of the spherical form error,” Prec Eng 2000; 24:119–26. [5] G. L. Samuel and M. S. Shunmugam, “Evaluation of sphericity error from form data using computational geometric techniques,” International Journal of Machine Tools & Manufacture, vol.42, 2002,pp.405–416. [6] G. L. Samuel and M. S. Shunmugam, “Evaluation of sphericity error from coordinate measurement data using computational geometric techniques,” Computer methods in applied mechanics and engineering Vol.190, 2001, pp. 6765-6781. [7] X.L.Wen and A.G. Song. “An immune evolutionary algorithm for sphericity error evaluation,” International Journal of Machine Tools & Manufacture, Vol.44, 2004, pp.1077–1084, doi:10.1016 /j.ijmachtools. 2004.02.018 [8] C.C Cui,R.S Che,D. Ye,Q.C. Huang, “Sphericity error evaluation using the genetic algorithm,” Optics and Precision Engineering. Vol.10 No.4 Aug. 2002:333~339 [9] G.Y. He, T.Y. Wang, X.D. Qin, X.J. Guo, “Geometric Approximation Technique for Minimum Zone Sphericity Error,” Transactions of Tianjin University, Vol.11 No.4 Aug. 2005,
pp.274-277.
[10] Jyunping Huang, “An exact minimum zone solution for sphericity evaluation,” Computer-Aided Design, vol.31,1999, pp.845–853. [11] Z. D. Jiang, and Z. X. Zhao, “Geometric criterion of sphericity,” Chinese Journal of Scientific Instrument, Vol.12, Feb. 1991, pp.35-39 (in Chinese).