Aug 14, 2012 - arXiv:1208.2914v1 [cond-mat.str-el] 14 Aug 2012. Spin dynamics and spin freezing in the triangular lattice antiferromagnets FeGa2S4 and ...
Spin dynamics and spin freezing in the triangular lattice antiferromagnets FeGa2 S4 and NiGa2 S4 Songrui Zhao,1, ∗ P. Dalmas de R´eotier,2 A. Yaouanc,2, † D. E. MacLaughlin,1 J. M. Mackie,1 O. O. Bernal,3 Y. Nambu,4, ‡ T. Higo,4 and S. Nakatsuji4
arXiv:1208.2914v1 [cond-mat.str-el] 14 Aug 2012
1
Department of Physics and Astronomy, University of California, Riverside, California 92521, USA 2 Institut Nanosciences et Cryog´enie, SPSMS, CEA and Universit´e Joseph Fourier, F-38054 Grenoble, France 3 Department of Physics and Astronomy, California State University, Los Angeles, California 90032, USA 4 Institute for Solid State Physics, University of Tokyo, Kashiwa 277-8581, Japan (Dated: August 15, 2012) Magnetic susceptibility and muon spin relaxation (µSR) experiments have been carried out on the quasi-2D triangular-lattice spin S = 2 antiferromagnet FeGa2 S4 . The µSR data indicate a sharp onset of a frozen or nearly-frozen spin state at T ∗ = 31(2) K, twice the spin-glass-like freezing temperature Tf = 16(1) K. The susceptibility becomes field dependent below T ∗ , but no sharp anomaly is observed in any bulk property. A similar transition is observed in µSR data from the spin-1 isomorph NiGa2 S4 . In both compounds the dynamic muon spin relaxation rate λd (T ) above T ∗ agrees well with a calculation of spin-lattice relaxation by Chubukov, Sachdev, and Senthil in the renormalized classical regime of a 2D frustrated quantum antiferromagnet. There is no firm evidence for other mechanisms. At low temperatures λd (T ) becomes temperature independent in both compounds, indicating persistence of spin dynamics. Scaling of λd (T ) between the two compounds is observed from ∼Tf to ∼1.5T ∗ . Although the µSR data by themselves cannot exclude a truly static spin component below T ∗ , together with the susceptibility data they are consistent with a slowly-fluctuating “spin gel” regime between Tf and T ∗ . Such a regime and the absence of a divergence in λd (T ) at T ∗ are features of two unconventional mechanisms: (1) binding/unbinding of Z2 vortex excitations, and (2) impurity spins in a nonmagnetic spin-nematic ground state. The absence of a sharp anomaly or history dependence at T ∗ in the susceptibility of FeGa2 S4 , and the weakness of such phenomena in NiGa2 S4 , strongly suggest transitions to low-temperature phases with unconventional dynamics. PACS numbers: 75.10.-b, 75.10.Hk, 75.10.Jm, 76.75.+i
I.
INTRODUCTION
Among geometrically frustrated magnets the simplest example is the two-dimensional (2D) triangular-lattice Heisenberg antiferromagnet (THAFM) with isotropic spin-spin interactions. This is the system for which a spin liquid state in more than one dimension was first proposed by Anderson1 as a quantum disordered state in which long-range magnetic order is destroyed. It is now believed that the spin-1/2 2D THAFM with nearest-neighbor coupling orders at T = 0 with a 120◦ spin structure.2–4 A number of treatments of the 2D THAFM at nonzero temperatures have been reported.5 Phase transitions associated with the value of the spin S, topological defects, interactions beyond nearest neighbors, additional terms in the Hamiltonian, etc., have been studied intensively. One such transition involves binding and unbinding of topological excitations, the so-called Z2 vortices.6–10 Integer spins and additional biquadratic nearest-neighbor coupling are predicted to yield spinnematic phases with no dipolar ordering.11,12 Coupling beyond nearest neighbors may lead to a quantum spin disordered ground state13 or a state with broken C3 symmetry.14,15 It has proved difficult to find experimental evidence for many of these transitions, although Z2 vortex binding has been proposed for a number of candi-
date 2D THAFM systems10 and a recent theory16 invokes impurity-spin interactions in a nonmagnetic spin-nematic low-temperature phase. The quasi-2D triangular-lattice antiferromagnetic insulator NiGa2 S4 was characterized by Nakatsuji and coworkers17,18 and found to possess a number of unusual properties that have attracted considerable attention, both experimentally19–34 and theoretically.8–10,14–16,35–41 It is a 2D THAFM with Ni2+ spin S = 1 and very little spin anisotropy. Third-nearest-neighbor antiferromagnetic exchange is dominant, with a weak nearest-neighbor ferromagnetic interaction17,21 as suggested by calculated superexchange pathways.42 A phase transition, possibly influenced by impurity effects, is indicated by a cusp and weak bifurcation between field-cooled (FC) and zerofield-cooled (ZFC) dc magnetic susceptibilities χdc (T ) at T ∗ = 8.5–9 K.18 A drastic slowing of Ni2+ spin fluctuations as T ∗ is approached from above is observed in NMR,20 ESR,21,22 and muon spin relaxation (µSR)23,25–28 experiments, with a frozen or nearly-frozen Ni2+ spin state below T ∗ characterized by an order-parameter-like temperature dependence of the (nearly) frozen moment and strong spin fluctuations down to 25 mK. The frequency-dependent ac magnetic susceptibility χac (T ) suggests a spin-glasslike transition at a lower temperature Tf = 2.2–2.7 K.29 Based on these results, a viscous “spin-gel” or extended
2 thermodynamic critical regime has been proposed between ∼Tf and T ∗ .18,29 A similar broad fluctuating regime is observed in NaCrO2 .43 Perhaps the most mysterious property of NiGa2 S4 is the magnetic specific heat CM , which is independent of applied magnetic field up to 7 T and exhibits a T 2 temperature dependence at low temperatures.17 This implies linearly-dispersing 2D excitations that do not couple to the field, which seems hard to reconcile with the observation that the low-temperature muon spin relaxation rate is rapidly suppressed by applied field.25 The isostructural insulator FeGa2 S4 ,18,19 in which Fe2+ is in the t42g e2g high-spin S = 2 configuration, is also a candidate for a 2D THAFM. Both FeGa2 S4 and NiGa2 S4 exhibit FC-ZFC bifurcation at ∼|θW |/10, where θW is the (negative) Weiss temperature from the paramagnetic-state susceptibility at high temperatures. Normally bifurcation occurs at a spin freezing temperature Tf . Thus the Ramirez parameter44 θW /Tf is large (> ∼ 10), indicating strong frustration. In both compounds CM exhibits an unusual two-peak temperature dependence with no sign of a phase transition. As in NiGa2 S4 , CM (T ) in FeGa2 S4 follows a field-independent T 2 law at low temperatures. Some properties of the two materials differ significantly, however. In NiGa2 S4 χac (T ) exhibits a frequency dependence below Tf ,18 whereas in FeGa2 S4 bifurcation, much stronger than that at T ∗ in NiGa2 S4 , is observed at Tf ≈ 16 K,19 indicating a spin-glass-like transition at this temperature. In the Ni1−x Fex Ga2 S4 series the specific heats scale with θW in the T 2 region but not at higher temperatures.24 To date FeGa2 S4 has been studied using only a few microscopic techniques. In Ni1−x Fex Ga2 S4 , 0.01 ≤ x ≤ 1, 57 Fe M¨ ossbauer-effect (ME) measurements30,33 indicate spin freezing at a temperature T ∗ that varies smoothly between 12(1) K for x = 0.01 and 33(1) K ≈ 2Tf for x = 1,33 with an order-parameter-like temperature dependence of the frozen moment and strong spin fluctuations below T ∗ similar to the µSR results in NiGa2 S4 . Initial µSR experiments in FeGa2 S4 45 revealed a magnetic transition at and strong muon relaxation below T ∗ ≈ 30 K, confirming the ME results. It was noted that the relation of T ∗ to CM (T ) is not the same in the two compounds: in NiGa2 S4 T ∗ lies just below the lowtemperature peak in CM (T ), whereas in FeGa2 S4 T ∗ is found between the two peaks. As a result CM (T ) does not scale with T ∗ , and the relation between spin freezing and entropy release is unclear. This paper (1) reports further measurements of χdc (T ) and results of µSR experiments in FeGa2 S4 , which were undertaken to clarify the nature of spin freezing and to probe Fe2+ spin dynamics, and (2) compares µSR and other data from FeGa2 S4 with those from NiGa2 S4 . The susceptibility data confirm earlier results,19 and extend measurements to applied fields in the range 0.1–2 T. As previously noted,45 there is no anomaly in the muon relaxation rate at Tf and also no sharp anomaly in χdc at T ∗ ; the latter is an extremely unusual feature of this
compound,46 not shared by NiGa2 S4 . The µSR results from FeGa2 S4 provide new insight into spin freezing and dynamical fluctuations in these compounds. The data reveal an abrupt transition at T ∗ ≈ 31 K to a phase with frozen or nearly-frozen spins and strong spin fluctuations but with almost no signature in bulk measurements. The agreement with the ME results rules out perturbation by the muon electric charge47 as the origin of this behavior. The theory of spin-wave excitations in a 2D frustrated quantum antiferromagnet has been treated by Chubukov, Sachdev, and Senthil48–50 (hereafter CSS) and others.51,52 Comparison of muon relaxation rates above T ∗ in both compounds with the CSS result for the spin-lattice relaxation rate of a probe spin (nucleus or muon) yields values of the 3d exchange interaction in remarkably good agreement with previous studies.17,19,21,31 There is no firm evidence for muon relaxation due to other mechanisms.9,10,15 The muon relaxation rates in FeGa2 S4 scale with those in NiGa2 S4 25 over a wide temperature range from ∼Tf to ∼1.5T ∗. Although the µSR data by themselves do not rule out a truly static spin component, as found in conventional magnetic phases, the spin dynamics revealed by µSR together with the absence of a susceptibility anomaly at T ∗ are consistent with an extended critical regime or slowly-fluctuating “spin-gel” state in both compounds below T ∗ .
II.
EXPERIMENTAL PROCEDURE AND RESULTS A.
Magnetic susceptibility
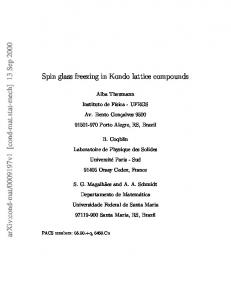
A powder sample of FeGa2 S4 was prepared as described previously.17,53,54 The bulk dc susceptibility was measured using a Quantum Design Magnetic Properties Measurements System over the temperature range 2– 300 K for applied magnetic fields in the range 0.1–6 T. For FC measurements the magnetic field was set and the sample was cooled to 2 K before collecting the data, while for ZFC measurements the sample was cooled in zero field, the field was set at 2 K, and data were taken upon warming. After each measurement the sample was warmed to 350 K in zero field to quench any magnetic order. The results are shown in Fig. 1. Consistent with a previous report,19 for applied field µ0 H = 0.1 T bifurcation between the FC and ZFC data is observed below 16(1) K, suggesting spin-glass-like freezing at this temperature. The data indicate a strong suppression of the spin freezing temperature with applied field, similar to that observed in Fe-rich (Ni,Fe)Ga2 S4 alloys,55 to about 10 K at 2 T; this is also consistent with spin-glass-like freezing. As in NiGa2 S4 ,29 the susceptibility is suppressed by field (i.e., a negative nonlinear susceptibility sets in) for ∗ temperatures < ∼ T obtained from ME and µSR experi-
3
Tf
χdc (emu/mol)
0.06
FeGa2S4 T*
0.04
P (t) = (1 − ηd )Pq (t) + ηd Pd (t) .
0.1 T 0.5 T 1.0 T 2.0 T
0.02 0 1
10 100 Temperature (K)
FIG. 1. (Color online) Temperature dependence of the dc magnetic susceptibility χdc of FeGa2 S4 for various applied magnetic fields. Filled symbols: field-cooled (FC) data. Open symbols: zero-field-cooled (ZFC) data. Tf : low-field spin freezing temperature. T ∗ : onset temperature of quasistatic muon spin relaxation [cf. Fig. 3(a)].
ments [cf. Fig. 3(a) below], but there is no sharp feature in χdc (T ) at T ∗ . As noted in Sec. I, the bifurcation in FeGa2 S4 is much stronger than that in NiGa2 S4 .
B.
It is straightforward to separate the relaxation rates associated with these processes in µSR experiments in zero and weak longitudinal magnetic field HL ,56,57 provided that the dynamic muon relaxation is slower than the quasistatic muon relaxation.60 Then P (t) has a characteristic two-component form that can be modeled by
Muon spin relaxation
The µSR technique is a sensitive probe of static and dynamic magnetism in magnetic materials.56,57 In µSR experiments spin-polarized positive muons are implanted in the sample and come to rest at interstitial sites. Each muon precesses in the sum of the local field Bloc (t) due to its magnetic environment and any applied field, and decays with a mean lifetime τµ = 2.197 µs into a positron and two neutrinos. The positron is emitted preferentially in the direction of the muon spin at the time of decay, so that detection of decay positrons permits determination of the evolution of the muon spin polarization. The resulting signal can be observed up to times of several τµ (typically 10–15 µs) and is conceptually similar to the free induction decay of NMR,58 although the detection technique is very different. The onset of a quasistatic59 component hBloc i of Bloc (t) is expected at a magnetic phase transition. In general muon spin relaxation [decay of the ensemble muon spin polarization P (t)] is due to a combination of two relaxation mechanisms:56,57 • quasistatic relaxation, due to dephasing of muon spin precession in hBloc i if its magnitude is inhomogeneously distributed, and • dynamic (spin-lattice) relaxation of the muon spin due to thermal fluctuations of Bloc (t). These are of course the inhomogeneous and homogeneous relaxation mechanisms of NMR.
(1)
Here the first and second terms on the right-hand side describe quasistatic and dynamic relaxation processes that control the evolution of P (t) at early and late times, respectively,57,60 and ηd is the fraction of the initial muon spin polarization that is relaxed dynamically, i.e., that survives at late times after Pq (t) → 0. Observation of such two-component behavior indicates the presence of quasistatic magnetism, with or without long-range order. In a randomly-oriented powder sample ηd = 1/3 for hBloc i ≫ µ0 HL and ηd → 1 for hBloc i ≪ µ0 HL ,60 so that for zero or low HL a sudden decrease of ηd with decreasing temperature signals the onset of a quasistatic local field due to a magnetic phase transition. µSR experiments were carried out on a powder sample of FeGa2 S4 using the M20 beam line at TRIUMF, Vancouver, Canada. The asymmetry A(t) in positron count rate, which is proportional to P (t), was measured using the standard time-differential µSR technique.56,57 Data were taken from 2 K to 260 K in a weak longitudinal field µ0 HL ≈ 2 mT to decouple nuclear dipolar fields,60 and also for µ0 HL between 2 and 100 mT at 1.7 K. Representative late-time muon asymmetry data for µ0 HL = 2.02 mT are shown in Fig. 2(a). As previously reported,45 the initial asymmetry decreases rapidly between 40 and 20 K. This indicates60 the onset of quasistatic Fe2+ spin freezing (reduction of ηd ) as discussed above. As noted in Sec. I, ME studies30,33 of Ni1−x Fex Ga2 S4 give evidence for quasistatic Fe2+ spins below T ∗ , consistent with this loss of asymmetry. Each technique places a lower limit on the correlation time τc of hBloc i. In ME and µSR experiments these limits are ∼10−8 s and ∼10−7 –10−6 s (cf. Sec. III B), respectively, so that the µSR results are a somewhat stronger. Unfortunately the early-time quasistatic muon relaxation could not be observed at low temperatures in FeGa2 S4 ,45 because the initial decay time was shorter than the spectrometer “dead time” between a muon stop and the earliest detection of the decay positron (∼10 ns). Thus hBloc i is large and broadly distributed. The spectrometer dead time puts a lower limit of roughly 200 µs−1 on the quasistatic muon relaxation rate Λq , corresponding to a quasistatic local field distribution width hBloc irms = Λq /γµ > ∼ 0.2 T; here γµ = 851.56 µs−1 T−1 is the muon gyromagnetic ratio. The average local field hBloc iav may be considerably larger than this; in NiGa2 S4 , where the early-time asymmetry was observable, hBloc iav > ∼ 5 hBloc irms (Refs. 23 and 25). The asymmetry data were fit to a relaxation function of the form A(t) = A0 P (t) ,
(2)
4
FeGa2S4
100
(a) µ0HL = 2.02 mT
0.2
39.9 K
0.01
(b) T = 1.7 K 100 mT
λd (T )/λd (T *)
16.1 mT 4.9 mT
0.05 2.0 mT
0
2
4
6
8
Time t (µs)
10
1
10
0
10
-1
10
-2
10
-3
1
10 100 T (K)
0.1
where A0 is the initial count-rate asymmetry and P (t) is given by Eq. (1) with (3)
the stretched-exponential form with relaxation rate λd and stretching power β < 1. This is a convenient parametrization of sub-exponential relaxation due to an inhomogeneous distribution of locally exponential relaxation processes.57,61 λd is a characteristic relaxation rate (not the average),62 and β controls the width of the distribution, which becomes larger for smaller β. Representative fits are shown in Fig. 2. The stretched-exponential form was also used to analyze late-time data from µSR experiments in NiGa2 S4 using powder samples23,25,26,28 and a mosaic of oriented single crystals with HL normal to the Ni planes.25 The origin of this relaxationrate inhomogeneity is not clear, since structural studies of these materials found nearly perfect triangular NiS2 lattice layers with no distortion.17,54 It does not seem to be the stacking faults inferred from NQR,20,54 since the bimodal distribution this would produce is not observed. We note that spin disorder and a short spin-spin correlation length are found in neutron scattering experiments on NiGa2 S4 .17,25
1 10 Temperature (K)
100
(b)
0.01
FIG. 2. (Color online) Representative late-time muon asymmetry data (positron count asymmetry vs time) in FeGa2 S4 . (a) Asymmetry vs time at various temperatures for longitudinal field µ0 HL = 2.02 mT. (b) Asymmetry vs time for various values of µ0 HL at temperature T = 1.7 K. Curves: fits to Eq. (2).
Pd (t) = exp[−(λd t)β ] ,
ηd β
0.5 0
20.0 K
T*
FeGa2S4 1
0.01
0.1
Tf
1 0.1
2.15 K
0
(a)
−1
λd (µs )
81.6 K
Asymmetry A(t )
NiGa2S4
10
292 K
0.1
T* Tf
0.1 T /T *
1
10
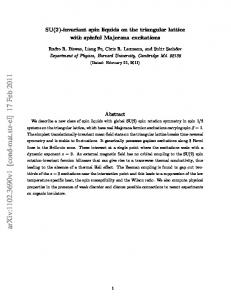
FIG. 3. (Color online) (a) Temperature dependence of dynamic muon spin relaxation rate λd in weak longitudinal applied field HL in FeGa2 S4 and NiGa2 S4 . Circles: FeGa2 S4 powder, µ0 HL = 2.02 mT. Squares: NiGa2 S4 powder, µ0 HL = 2.0 mT. Triangles: NiGa2 S4 , mosaic of oriented single crystals, HL k c, µ0 HL = 2.0 mT. Tf (FeGa2 S4 ): freezing temperature from FC-ZFC bifurcation in χdc (T ) (Fig. 1). Tf (NiGa2 S4 ): freezing temperature from onset of frequencydependent χac (T ) (Refs. 18 and 29). T ∗ : transition temperatures from µSR data. Inset: FeGa2 S4 , late-time asymmetry fraction ηd [Eq. (1)] (filled circles) and stretching power β [Eq. (3)] (open circles). (b) Normalized muon relaxation rate λd (T )/λd (T ∗ ) vs normalized temperature T /T ∗ . Symbols as in (a).
The temperature dependencies of λd for µ0 HL ≈ 2 mT in FeGa2 S4 and NiGa2 S4 are shown in Fig. 3(a).63 Sharp cusps in λd (T ) are observed at T ∗ = 31(2) K and 8.5(1.0) K in FeGa2 S4 and NiGa2 S4 , respectively. In both compounds λd (T ) increases by more than two orders of magnitude over a wide temperature range as T → T ∗ from above. This is clear evidence for critical slowing down of magnetic fluctuations: as in NMR, λd is proportional to the spin correlation time in the motional narrowing limit appropriate to the paramagnetic state.57,58 From Fig. 3(a), in FeGa2 S4 T ∗ is about twice the spin freezing temperature Tf . For T < T ∗ λd (T ) decreases with decreasing temperature in both compounds but saturates and shows no sign of vanishing as T → 0 (down to T /T ∗ ≈ 0.003 in FeGa2 S4 45 ). Such persistence of strong spin dynamics to low temperatures is a general feature of geometrically
5
10 (a) NiGa2S4
−1
λd (µs )
1
0.1
slope −1.2
0.01
FeGa2S4
1
(b) FeGa2S4
ηd
frustrated magnets64 and is not well understood, but seems to indicate a zero-energy singularity in the density of excited states.65 In FeGa2 S4 there is no anomaly in λd (T ) at Tf . This is very surprising, and is not understood: the observed strong FC-ZFC bifurcation is usually considered good evidence for spin freezing, which in turn would be expected to reduce the relaxation rate. In NiGa2 S4 a minimum in λd (T ) is seen near Tf , but data above and below this temperature were taken in different cryostats and an experimental artifact cannot be ruled out. The temperature dependencies of the late-time asymmetry fraction ηd and the stretching power β in FeGa2 S4 are shown in the inset to Fig. 3(a). At low temperatures ηd ≈ 0.3–0.5, close to the value 1/3 expected for µ0 HL ≪ hBloc i, and then rises rapidly to ∼1 at T ∗ . This is strong evidence for frozen or nearly-frozen Fe2+ spins below T ∗ , since it is the expected behavior if hBloc i sets in suddenly at this temperature. Below T ∗ β is considerably smaller than 1, although it is not accurately determined by the data; it was necessary to constrain β in this region to obtain consistent fits.45 We set a minimum β = 0.4, but the behavior of λd (T ) is not very sensitive to the specific choice. For T > T ∗ β tends to be larger but still < 1. The stretching has been found to be less pronounced above T ∗ at other applied fields in both FeGa2 S4 and NiGa2 S4 .23,27,45 Figure 3(b) shows the dependence of the normalized muon relaxation rate λd (T )/λd (T ∗ ) on the normalized temperature T /T ∗ in FeGa2 S4 and NiGa2 S4 . It can be seen that the data scale from ∼Tf to ∼1.5T ∗. This behavior and the possibility of slow quasistatic fluctuations below T ∗ (cf. Sec. III B) suggest an extended critical region, followed by disordered freezing at Tf .18,29 Scaling does not hold for the transition temperatures themselves, however: the ratio T ∗ /|θW | is 0.19(1) for FeGa2 S4 and 0.11(1) for NiGa2 S4 . The field dependencies of λd and ηd in NiGa2 S4 and FeGa2 S4 for T ∼ 2 K are shown in Fig. 4. It can be seen that in both compounds the muon relaxation is suppressed by field. For FeGa2 S4 λd varies roughly as HL −1.2 , and is suppressed by an order of magnitude for µ0 HL ≈ 10 mT. For fields an order of magnitude higher than this ηd remains in the neighborhood of 0.4– 0.5, close to the value 1/3 expected for µ0 HL ≪ hBloc i.60 In NiGa2 S4 the field dependence of λd is slower but still appreciable: λd (µ0 HL ) ≈ 0.1λd (∼1 mT) at µ0 HL ≈ 100 mT, where the increase of ηd is just beginning. This demonstrates that for both compounds the suppression of λd is not due to decoupling by HL , which is significant only as ηd → 1.60 It is also not due to the glassy dynamics mechanism of Keren et al.,66 which is not applicable when µ0 HL ≪ Bloc . The suppression occurs for fields two to three orders of magnitude smaller than kB T ∗ /µB , which is far too small to reduce the 3d-spin fluctuation amplitude by simple alignment of the 3d spins. A shift of spectral noise power to higher frequencies is required, which must be due to some less direct mechanism. The
0.5 NiGa2S4 0 1
10
100 µ0HL (mT)
1000
FIG. 4. (Color online) Dependence of dynamic muon spin relaxation parameters on longitudinal field HL in FeGa2 S4 and NiGa2 S4 at low temperatures (T ≪ T ∗ ). Circles: FeGa2 S4 powder, T = 1.7 K. Squares: NiGa2 S4 powder, T = 2.1 K. Triangles: NiGa2 S4 oriented single-crystal mosaic, T = 2.3 K. (a) Relaxation rate λd . (b) Late-time asymmetry fraction ηd .
nature of this mechanism, and why it results in a powerlaw field dependence for FeGa2 S4 , are unknown. In NiGa2 S4 ηd increases from its low-field value for µ 0 HL > ∼ ωµ (0)/γµ ≈ 250 mT, where ωµ (0) is the observed spontaneous muon precession frequency at T = 0.23,25 An increase is expected at precisely this field, as HL decouples the muon spin polarization from the quasistatic field.60 This quantitative agreement is strong evidence that the two-component structure of the muon relaxation function is not associated with separation of magnetically distinct phases. In that case ηd would be the relative fraction of the slowly-relaxing phase; it and the initial 100% muon spin polarization would both be field-independent. The stretched-exponential form of the late-time relaxation function indicates inhomogeneity of the muon relaxation rate, but there is no evidence for magnetic phase separation. Below 100 mT ηd varies somewhat more with field in FeGa2 S4 than in NiGa2 S4 . This behavior is not understood, but might involve the significantly broader local field distribution in FeGa2 S4 .
6 III.
T (K)
DISCUSSION
100 40
6
T > T : comparison with the CSS result
(5)
Here N0 A0 is a renormalized hyperfine coupling constant,49 ρs is the spin stiffness constant, and CCSS is a numerical constant that can be estimated from Eqs. (4.29) and (4.7) in the Appendix. It is equal to 114.59 if one assumes Eq. (4.29) to be an equality, but this is an order-of-magnitude estimate. The theory assumes nearest-neighbor AFM coupling, so that for NiGa2 S4 , where third-nearest-neighbor interactions dominate,21,31 the parameters obtained are effective values.68 In general ρk and ρ⊥ of ρs for spin twists parallel and perpendicular, respectively, to the 2D plane are not equal.50 In the present experiments the samples were randomly-oriented powders except for the mosaic of NiGa2 S4 single crystals, for which λd (T ) is not very different from the powder.25 We therefore take ρs in Eq. (5) to be the orientation average (2ρk + ρ⊥ )/3. We compare Eq. (4) to the muon relaxation rate λd , recognizing that the uncertain absolute value of 1/T1 from Eq. (4) and the inhomogeneity make full agreement unlikely. Nevertheless the predicted T 3 exp(T0 /T ) temperature dependence might be expected. Figure 5 is a semi-log plot of λd /T 3 vs 1/T for both compounds at temperatures above T ∗ . For each compound the data extend down to the transition, i.e., the upper right-hand data points are for T ≈ T ∗ . For FeGa2 S4 the straight line is a fit of Eq. (4) to the lowest temperature points. For NiGa2 S4 a straight line fits all the data for both powder and mosaic samples. The resulting values of T0 yield 1/2πρs = 2/T0 = 0.0068 K−1 and 0.0154 K−1 for FeGa2 S4 and NiGa2 S4 , respectively (arrows labeled by symbols in Fig. 5), thereby justifying a posteriori the procedure of obtaining ρs from T0 .67 For NiGa2 S4 all the data satisfy this condition, whereas for FeGa2 S4 the data fall below the straight line at small 1/T . This dropoff might be due to the onset of thermally-activated muon diffusion. It should be noted, however, that it occurs for T ≈ 2πρs , where the RC calculation ceases to be valid, and that similar behavior was observed in 7 Li NMR in the THAFM Li7 RuO6 in the temperature range 20–40 K,67 where Li diffusion would
−1
slope = 296 K
2
10
(s 3
µ0HL = 2 mT
4
10
K
−3
in the renormalized-classical (RC) regime T ≪ 2πρs , with
λd /T
We first consider muon spin relaxation for T ≥ T ∗ .67 The CSS calculation of the probe-spin dynamic relaxation rate 1/T1 due to spin fluctuations in a 2D frustrated quantum antiferromagnet, discussed in more detail in the Appendix, yields � �2 � �3 N0 A0 h T ¯ 1/T1 = CCSS exp(T0 /T ) (4) h ¯ ρs T 0
T0 = 4πρs .
10
10
∗
)
A.
20
slope = 130 K
( )
0
10
FeGa2S4 powder
-2
10
NiGa2S4 powder
( , )
NiGa2S4 mosaic
-4
10
0
0.05 1/T (K
0.1 −1
)
FIG. 5. (Color online) Dependence of λd /T 3 on inverse temperature 1/T in FeGa2 S4 and NiGa2 S4 , T ≥ T ∗ . Straight lines: fits of Eq. (4). Labeled arrows: values of 1/2πρs (see text). Curve: fit of the Z2 vortex theory9,10 (Sec. III C) to data for FeGa2 S4 .
not be expected. The situation is discussed further below. The curve is a fit of the Z2 vortex theory9,10 to the data, as described in Sec. III C. The spin stiffness constants are expected to be proportional to the exchange constant J; for a square lattice ρs = JS 2 in the classical limit.69 For the 2D THAFM ρk and ρ⊥ have been calculated in the spin-wave approximation, which yields50,52 (2/3)ρk + (1/3)ρ⊥ ρs 1 − 0.399/2S √ = = 2 JS JS 2 3
(6)
to first order in 1/S. Equation (6) and ρs obtained from the µSR data give a “spin-wave” value Jsw of J, which can be compared with the value JθW obtained70 from |θW | = zJθW S(S + 1)/3 for AF exchange between z = 6 near neighbors. Experimental values of these and other spin-system parameters and are given in Table I together with theoretical values of ρs /J. It can be seen that for both compounds the values of Jsw and JθW are in good agreement. This is strong evidence that their spin dynamics above T ∗ are dominated by the spin-wave fluctuations treated by CSS. For NiGa2 S4 there is also reasonable agreement with the values J3 = 32(7) K and 21 K of the dominant third-nearest-neighbor exchange constant obtained, respectively, from neutron scattering31 and the field dependence of the ESR resonance frequency well below T ∗ .21 The spin stiffness constants for the two compounds are in rough and good agreement with the values of T ∗ for FeGa2 S4 and NiGa2 S4 , respectively, as expected for Halperin-Saslow modes71 in spin-frozen states.18,40 The renormalized muon-Ni2+ hyperfine coupling constant N0 A0 /¯h estimated from Eq. (4) is expected to be of the order of the spontaneous T =0 muon precession frequency ωµ (0) = γµ hBloc iav (0), since the same interaction is involved in both cases. In FeGa2 S4 ωµ (0) has
7 TABLE I. Experimental and theoretical values of spin-system parameters in NiGa2 S4 and FeGa2 S4 . Tf : freezing temperature from χac (NiGa2 S4 ) and FC/ZFC bifurcation (FeGa2 S4 ). T ∗ : transition temperature from µSR and ME data. θW : (negative) Weiss temperature from χ(T ). ωµ (0): spontaneous T =0 muon precession frequency (NiGa2 S4 only). N0 A0 /¯ h, T0 : estimated renormalized muon hyperfine coupling constant (Ref. 49) and characteristic temperature from fits of Eq. (4) to λd (T ≥T ∗ ) (Fig. 5). ρs : orientation-averaged spin stiffness constant from Eq. (5). ρs /J: ratio of ρs to exchange constant J from calculation of Refs. 50 and 52. Jsw : exchange constant obtained from ρs . JθW : exchange constant obtained from |θW |. S NiGa2 S4 FeGa2 S4 a b c d
1 2
Tf (K) 2.2–2.7a 16(1)
T∗ (K) 9.0(0.5)b 31(2)
|θW | (K) 80(2)c 160(9)d
ωµ (0) (106 s−1 ) 200(10)b −−
N0 A0 /¯ h (106 s−1 ) 9.6(1.7) 63(9)
T0 (K) 130(6) 296(18)
ρs (K) 10.4(5) 23.5(1.4)
ρs /J 0.462 2.079
Jsw (K) 22(1) 11.3(7)
JθW (K) 20.0(5) 13(1)
Ref. 29. Refs. 23 and 25. Ref. 17. Ref. 19.
not been measured (cf. Sec. II B), but in NiGa2 S4 it is considerably larger than N0 A0 /¯ h obtained from Eq. (4) (Table I). There are a number of uncertainties in the comparison, including the prefactor CCSS in Eq. (4) and the inhomogeneity in the relaxation. Perhaps the least certain quantity in the CSS expression for 1/T1 is the value of ξ/c,49 where ξ is the spin correlation length and c is the spinwave velocity. Large discrepancies between calculated and observed correlation lengths have been reported.9,18 The situation is discussed in the Appendix. We conclude that the temperature dependence of λd in NiGa2 S4 is in good agreement with the CSS result, but the magnitude of the muon relaxation rate is not well understood. As shown in the Appendix, in the CSS treatment49 the spin-lattice relaxation rate falls below the RC temperature dependence in the crossover region between the RC (T ≪ 2πρs ) and quantum-critical (QC) (T ≫ 2πρs ) regimes. Thus the high-temperature dropoff in the relaxation rate in FeGa2 S4 (Fig. 5) might be due to this crossover. However, the QC regime, for which the condition ρs ≪ J is necessary,49 is suppressed for large spin [cf. Eq. (6)] and probably does not exist in FeGa2 S4 (S = 2) because ρs ≈ 2J (Table I). Nevertheless, rapid nonuniversal short-range spin fluctuations may dominate at high temperatures49 and reduce τc . The QC region might exist in NiGa2 S4 (S = 1), where ρs ≈ 0.5J (Table I), but here there is no sign of a dropoff for T < ∼ 30 K (T /2πρs < ∼ 0.46); apparently the crossover has not been reached. Above ∼30 K λd becomes too small to be measured reliably. The ESR linewidth in NiGa2 S4 above T ∗ has been analyzed in terms of lifetime broadening by critical spin fluctuations.21,22 The linewidth depends much less on temperature than the muon relaxation rate, and exhibits an anomaly at 23 K ∼ 3 T ∗ that was interpreted as a crossover between critical regimes. It should be noted that the ESR experiments were carried out in a field of 20 T, corresponding to a Zeeman energy ∼ 2 kB T ∗ ; such a large field is expected to perturb the spin fluctuation spectrum in theoretical scenarios for the 2D THAFM.9,72 It is also possible that the paramagnetic-
state ESR line is statically broadened, since neutron scattering in NiGa2 S4 17,31 and muon relaxation in both compounds suggest inhomogeneous spin structure above T ∗ that could be reflected in the susceptibility. Measurements of the ESR linewidth field dependence in the paramagnetic state might clarify the situation. There is no evidence for a crossover above T ∗ in the muon relaxation data for NiGa2 S4 , which agree quantitatively with Eq. (4) up to ∼7 K above the ESR anomaly temperature. B.
T < T ∗ : quasistatic relaxation
Quasistatic muon spin relaxation (the onset of nonzero hBloc i) is observed in µSR experiments below T ∗ in both NiGa2 S4 and FeGa2 S4 . An important issue is whether or not the quasistatic field itself is truly static or slowly fluctuating. We discuss this in terms of two limiting scenarios: (1) a static hBloc i together with a fluctuating component δBloc (t), and (2) slow fluctuations of hBloc i as a whole. We designate these scenarios “conventional” and “unconventional”, respectively, for reasons that will become apparent, and consider the correlation time τc associated with hBloc i. If quasistatic relaxation is observed τc must at least be longer than 1/λd (and possibly infinite), since otherwise motional narrowing would result in a single muon relaxation function rather than the twoterm form of Eq. (1).60 In the conventional scenario the dynamic muon relaxation is due to transitions induced by δBloc (t) between muon spin Zeeman levels in a truly static hBloc i (τc = ∞). This is the normal situation in an ordered magnetic phase, where δBloc (t) is due to thermally-excited magnons. These give rise to motionally-narrowed relaxation, because the frequencies associated with spin-flip scattering of magnons are much higher than γµ δBloc .73 In the unconventional scenario the muon relaxation is adiabatic,60,74 and τc ≈ 1/λd ∼ 10−7 and 10−6 s for NiGa2 S4 and FeGa2 S4 , respectively, below T ∗ [Fig. 3(a)]. This would be extremely slow on the time scale of the 3d exchange interaction (∼10−12 s), and would correspond
8 to a highly unusual “spin-gel” phase as has been discussed in the literature.8–10,18 Unfortunately the µSR data do not distinguish between these scenarios, and the observed value of 1/λd is therefore only a lower bound on τc . Strong muon relaxation and NQR signal wipeout20 below T ∗ could also occur in the conventional scenario.75 Nevertheless an extended critical regime or spin-gel phase, where constituent spins are strongly correlated but still fluctuating on the microsecond time scale with zero long-time average, is compatible with the µSR data for T < T ∗ . The absence of a sharp anomaly in bulk properties at T ∗ would be highly unusual in the conventional scenario but is perhaps not ruled out in the unconventional scenario; this feature may be evidence in favor of the latter. More work is needed to clarify the situation. As noted in Sec. I, the observation of the transition at T ∗ in 57 Fe ME experiments is evidence against the conjecture47 that the muon electric charge perturbs its environment and somehow induces the transition observed in µSR. In NiGa2 S4 substitutional Fe2+ and host Ni2+ ions are isovalent, and in Ni0.99 Fe0.01 Ga2 S4 the ME data yield a value of T ∗ close to that from µSR in the undoped end compound.34 Fe2+ is of course itself the host in FeGa2 S4 .
C.
Comparison with other models
We compare the µSR results in FeGa2 S4 and NiGa2 S4 with candidate models for 2D THAFM behavior other than CSS. Z2 vortex binding-unbinding transition. Kawamura and co-workers6–10 and others76 have carried out extensive studies of Z2 vortices as topological defects in a 2D THAFM with nearest-neighbor interactions. Z2 vortices been studied in detail only in the classical limit, but presumably they also exist for quantum spins. It was suggested that binding of thermally-excited Z2 vortices with decreasing temperature could lead to an unusual thermodynamic phase at a transition temperature Tv , with long but finite spin correlation lengths and times below Tv .9,10 It has been conjectured8–10,18 that the onset of quasistatic muon spin relaxation at T ∗ might arise from this transition, so that T ∗ = Tv . The existence of a critical regime between Tf and T ∗ has been proposed for NiGa2 S4 with Tf /T ∗ ∼ 0.4 (Refs. 18 and 29) and for NaCrO2 with Tf /T ∗ ∼ 0.3.43 From the present results in FeGa2 S4 Tf /T ∗ ≈ 0.5, although we note again that the signature of Tf is very different in the susceptibilities of FeGa2 S4 and NiGa2 S4 . The observed rapid muon spin relaxation below T ∗ and the lack of a divergence of λd at T ∗ seem consistent with an important qualitative feature of the Z2 vortex picture, viz., finite spin correlation times at and below Tv . A number of questions remain concerning the µSR results and predictions of the Z2 vortex binding model:
• In the model Tv is slightly lower than the temperature of the lower specific heat peak, as is the case for T ∗ in NiGa2 S4 .27 As previously noted,45 however, T ∗ in FeGa2 S4 lies between the two specific heat peaks, leading to doubt as to the applicability of the model to this compound. • The theory predicts only weak essential singularities at Tv , where the fluctuation spectrum is dominated by the spin-wave contribution9,10 so that the CSS calculation should apply. This varies exponentially (i.e., rapidly) with temperature, but a further abrupt increase of τc on cooling through T ∗ (Ref. 18) does not seem to be found in the Z2 vortex picture; τc merely increases (exponentially) with cooling through Tv .9,10 In this case the maximum rate is obtained for ωµ τc ≈ 1 (i.e., not neces−1 sarily at Tv ),60 and is of the order of ωµ > ∼ 200 µs , whereas the observed maximum rates in FeGa2 S4 and NiGa2 S4 [Fig. 3(a)] are one to two orders of magnitude slower than this. Furthermore, such a slowing-down would not account for the mean-fieldlike temperature dependence of ωµ (T ) below T ∗ observed in NiGa2 S4 ,23,25,34 since there would be no temperature dependence once ωµ τc > ∼ 1. Thus the data seem to rule out a smooth increase of τc on cooling with no other effects. • In the Z2 vortex model, spin dynamics above Tv involve both unbound vortices and conventional spin-wave excitations. A crossover from spin-wave-dominated to vortex-dominated spin dynamics with increasing temperature is predicted at a temperature slightly above Tv .9,10 No such crossover or other sign of spin dynamics beyond the CSS prediction is observed in the µSR data for NiGa2 S4 . As noted above a candidate for a crossover has been observed in ESR experiments on this compound,21,22 but the applied field used in these experiments (20 T) was much greater than the value (∼0.1 T) sufficient to change the symmetry of the Hamiltonian and suppress Z2 vortices.9 • An exponentially growing Z2 vortex density at high temperatures leads to a decrease in τc .9,10 The resultant motional narrowing could explain the observed high-temperature dropoff of λd /T 3 in FeGa2 S4 (Fig. 5) below the CSS prediction [Eq. (4)]. The curve in Fig. 5 is a fit to the FeGa2 S4 data of an expression of the form λd = A
τsw τv τsw + τv
(7)
suggested by the Z2 vortex model, where τsw and τv are the spin correlation times associated with spinwave and Z2 -vortex fluctuations, respectively.9 Each correlation time incorporates its predicted temperature dependence, i.e., τsw ∝ T 3 exp(T0 /T ) and τv ∝ exp {[TZ2 /(T − Tv )]α }, α ≈ 0.5.9,10 The
9 fit is good (curve in Fig. 5), but the parameters are not well determined from the fit: TZ2 = (1200 ± 2600) K and α = 0.5 ± 1.8. As noted in Sec. III A, however, the dropoff in FeGa2 S4 may be due to other mechanisms, and cannot be unambiguously attributed to muon relaxation by Z2 vortices. Thus there are points of agreement and points of disagreement between the Z2 -vortex model and the experimental µSR results. Additional work is necessary to resolve these issues. In particular, a quantitative estimate of the expected muon relaxation rate due to unbound Z2 vortices above Tv is necessary to determine whether the negative result in NiGa2 S4 would be expected. Spin-nematic ground state, impurity spin dynamics. Treatments of the unconventional properties of NiGa2 S4 via “spin nematic” models with nonmagnetic quadrupolar ground states16,35,37,41,77 are in agreement with the field-independent specific heat, but appear to be called into question by the observation of strong spin dynamics at low temperatures.18 These theories have specifically considered only S = 1 systems,78 and therefore do not explicitly address the similar behavior of the two compounds. However, the observation that the field independence and low-temperature T 2 behavior of the specific heat is preserved for integer-spin impurities in NiGa2 S4 but not for half-integer-spin impurities24,55 indicates the importance of integer spin for these properties. A recent theory by Takano and Tsunetsugu16 concludes that bond disorder generates magnetic impurities in an antiferroquadrupolar11 spin-nematic state of a S=1 2D THAFM with biquadratic interactions. Coupling to nonmagnetic excitations gives rise to an indirect longrange interaction between these impurities. “Freezing” of impurity spins occurs to a state with slowly-fluctuating spin moments with vanishing spin expectation value. The time scale of these fluctuations has not been reported. It is argued that slow fluctuations are also induced in the lattice spins, leading to a fluctuating field throughout the system for impurity concentrations of the order of 1%. Vortex unbinding strongly suppresses the impurity-spin interactions by preventing the definition of a consistent spin quadrupole director over a path around a vortex. This strong interplay between impurity spins and vortices leads to identification of Tv as the transition temperature for impurity-spin-moment freezing as well as vortex binding. Like the Z2 -vortex scenario, the spin-nematic impurity model is qualitatively consistent with a number of features of the µSR data. The abruptness of the transition, the possibility that the fluctuations are slow, and their suppression by relatively low magnetic fields coexisting with a field-independent T 2 specific heat are all consistent with the µSR results. Impurities give rise to magnetic inhomogeneity in the surrounding lattice, which might account for the observed sub-exponential muon relaxation.
The nature of the impurity-spin fluctuations in this model is an important question. They appear to be quantum fluctuations, reflecting the vanishing of the expectation value of the impurity spin in the ground state. One must be cautious in assuming that such ground-state fluctuations will result in probe-spin relaxation at a neighboring site, however, since the ground state is by definition an eigenstate that does not fluctuate; thermal excitations are generally required for spin-probe relaxation in magnetic systems. As a simple example, consider two antiferromagnetically-coupled spins A and B, where a probe spin is hyperfine-coupled only to spin A. One might expect the quantum fluctuations (oscillations) of A to induce transitions between probe-spin states. It is straightforward to show, however, that the matrix elements of the spin operator SA in the hyperfine coupling vanish in the singlet ground state, so that the probe spin is a constant of the motion even though the spin of A is not. It would be useful to clarify whether impurity-spin fluctuations in the spin-nematic impurity model are similarly ineffective at probe-spin relaxation or, alternatively, involve thermal excitation of degenerate or nearly-degenerate spin states. In the latter case persistent probe-spin relaxation at low temperatures would be expected. There are other questions concerning comparison of this theory with the experimental situation: • Consideration of a number of properties of NiGa2 S4 within the theory has not yet been reported. These include a quantitative estimate of the impurityspin fluctuation rate, its temperature dependence, the origin and effect of spin freezing at Tf < T ∗ , and the absence of persistent low-temperature relaxation in NQR experiments,20 which is in marked contrast with its presence in the µSR results. • Defect concentrations in NiGa2 S4 have been found to be much lower than 1%,18,54 and µSR experiments have been carried out on a number of samples of NiGa2 S4 from several laboratories with similar results.23,25–28 This suggests that impurities might not play a major role unless the concentration dependence is expected to be weak. On the other hand, the observation of two resonances in gallium NQR experiments on NiGa2 S4 20 suggests structural inhomogeneity at some level; stacking faults have been suggested. • The identification of impurity-spin freezing with vortex binding below Tv is based on the presence of unbound quadrupolar vortices above this temperature.16 As discussed above, there is no evidence for unbound Z2 vortices above T ∗ from µSR in NiGa2 S4 , and it has been argued8 that Z2 vortices based on noncollinear AF order are the most likely species in this compound. Muon spin relaxation by nonmagnetic quadrupolar vortex excitations would, however, be weak and likely to be masked by relaxation due to spin fluctuations.
10 We conclude that the spin-nematic model with impurityspin freezing is also a promising candidate mechanism, but that more work is required to determine the extent to which it is supported by µSR and other experiments. One important aspect is the need for evidence for or against the substantial biquadratic spin interaction that is necessary for a nematic ground state.16 Broken C3 symmetry. Models with nearest- and thirdnearest-neighbor exchange couplings, with15 or without14 biquadratic coupling, exhibit ground states with broken C3 rotational symmetry. Growth of quadrupolar shortrange order at high temperatures, proposed15 to account for the high-temperature specific heat peak, is not easily tested by the µSR data, since as noted above quadrupole excitations would be hard to detect with a magnetic probe such as the muon spin. The magnetic correlations that generate T ∗ are associated with the lower specific heat peak,15 however, whereas in FeGa2 S4 T ∗ is well above this peak.45
IV.
CONCLUSIONS
µSR studies of FeGa2 S4 indicate drastic slowing and possible freezing of magnetic fluctuations below an unconventional transition at T ∗ ≈ 31 K, which is twice the spin glass-like freezing temperature Tf ≈ 16 K from magnetic susceptibility measurements. Muon spin relaxation rates above T ∗ in both FeGa2 S4 and NiGa2 S4 are in very good quantitative agreement with the CSS result49 for spin-lattice relaxation in a 2D quantum antiferromagnet. An extended regime of strong spin fluctuations is observed for T < T ∗ , and the spin dynamics scale between the compounds from ∼Tf to above T ∗ . Although there are differences in the magnetic properties of FeGa2 S4 and NiGa2 S4 (most notably the very different anomalies at Tf ), similarities in the µSR data include the 2D critical spin dynamics above T ∗ , the absence of a divergence of λd at T ∗ , and scaling between the two compounds in the neighborhood of T ∗ . These features are qualitatively consistent with theories of phase transitions driven by two distinct types of defects: (1) Z2 vortex topological excitations,9,10 and (2) magnetic impurities in a nonmagnetic spin-nematic ground state.16 There are questions concerning reconciliation of either model with other aspects of the data, however. The few differences in the µSR behavior of the two compounds include a possible anomaly in λd (T ) at Tf in NiGa2 S4 [Fig. 3(a), but see the associated discussion] and the dropoff of λd (T )/T 3 at high temperatures in FeGa2 S4 (Fig. 5). It should be noted that in general an exponential temperature dependence is expected from any largescale excitation with constant energy.79 As discussed in Sec. III A, the strongest evidence that in FeGa2 S4 and NiGa2 S4 muon relaxation is dominated by the specific spin-wave excitations treated by CSS is the remarkable
agreement of the µSR values of the exchange constants with those from other experiments (Table I). The µSR experiments do not discriminate between slow fluctuations and truly static freezing below T ∗ . Nevertheless, a sharp anomaly is virtually always seen in some bulk property at a magnetic transition. In FeGa2 S4 the absence of an anomaly at T ∗ in the susceptibility and at Tf in the muon spin relaxation appears to rule out a transition to a fully spin-frozen state at either of these temperatures. This and the coexistence of strong and strongly field-dependent magnetic spin dynamics with a field-independent specific heat at low temperatures are probably the two most remarkable results of this study. ACKNOWLEDGMENTS
We are grateful for assistance with the experiments from the staff of the TRIUMF Center for Molecular and Materials Science. One of us (D.E.M.) wishes to thank L. Balents, Hu Cao, A. V. Chubukov, H. Kawamura, R. R. P. Singh, and C. M. Varma for helpful correspondence and discussions. This work was supported by the U.S. NSF, Grants 0604105 and 1105380 (CSULA) and 0801407 (UCR), by the European Science Foundation through the Highly Frustrated Magnetism program, and by the Japan MEXT, Grants-in-Aid Nos. 17071003, 19052003, and 24740223. Appendix: Spin-lattice relaxation in the renormalized-classical and quantum-critical regimes of a 2D frustrated antiferromagnet
We consider the CSS calculation of the spin-lattice relaxation rate 1/T1 (Ref. 49) in more detail, and compare their results in the renormalized-classical (RC) and quantum-critical (QC) regimes of a 2D frustrated antiferromagnet that orders at T = 0. We follow the equation numbering and notation of CSS. In the RC region �7/2 � �2 2 � 1 N0 ξ kB T A0 , kB T ≪ 2πρs , (4.29) ∝ (RC) ¯h c ρs T1 where A0 is the hyperfine coupling constant, N0 is the condensate magnitude (renormalized by quantum fluctuations but presumably of order unity), ξ is the correlation length, c is the spin-wave velocity, and ρs is the spinwave stiffness constant. The prefactor required to make Eq. (4.29) an equality is of order unity.68 The correlation length in the RC region is given by � � �1/2(N −1) � ¯hc 1 (N −1)kB T 4πρs ξ= ξ , exp 2 kB T 4πρs (N −1)kB T (4.7) where N = 2 is the dimensionality and �1/2(N −1) × Γ(1 + 1/2(N −1)) (4.8) ξ = 18 e
11
√ �1/2 �1/2 π = 0.5166 . ×Γ(3/2) = 81 e = 18 e 2 (A.1) (RC) The CSS result for 1/T1 is proportional to the ratio ξ/c. In Sec. III A we note that the discrepancy between the fit value of N0 A0 /¯ h in NiGa2 S4 and the expected value ∼ωµ (0) might be related to uncertainty in this quantity. Neutron scattering experiments in A at 10 K and spin-wave NiGa2 S4 31 obtained ξ = 25 ˚ velocity ¯hc = 29 meV ˚ A at 1.5 K, yielding ξ/c = 5.7 × 10⁻¹³ s. Using the value of ρs for NiGa2 S4 from Table I, the calculated CSS value of ξ/c from Eq. (4.7) at T ∗ = 9 K is 1.04 × 10⁻⁷ s, more than five orders of magnitude larger than the neutron scattering value. Assuming N0 A0 /¯h ≈ ωµ (0), the relaxation data and Eq. (4.29) yield ξ/c ≈ 2.5 × 10⁻¹⁰ s, more than two orders of magnitude smaller than that from Eq. (4.7) but still much larger than the neutron scattering value. Clearly this parameter is not well understood at present. In the QC region the CSS result for 1/T1 is 1 (QC)
T1
=
�
A0 ¯h
�2
Z
N02 ¯ h ρs
�
N kB T 4πρs
�η ,
kB T ≫ 2πρs ,
(5.15) √ where Z = ( 5 − 1)/8N = 0.07725 for N = 2, and η = 1 + 32/3π 2 N is a scaling exponent = 1.5404 for
∗
†
‡
1
2
3
4
5
6
Present address: Department of Electrical and Computer Engineering, McGill University, Montreal, Quebec, Canada H3A 2A7. Present address: Laboratory for Muon-Spin Spectroscopy, Paul Scherrer Institute, 5232 Villigen-PSI, Switzerland Present address: Neutron Science Laboratory, ISSP, 106-1 Shirakata, Tokai 319-1106, Japan. P. W. Anderson, Mater. Res. Bull. 8, 153 (Feb. 1973), ISSN 0025-5408, http://www.sciencedirect.com/ science/article/pii/0025540873901670 D. A. Huse and V. Elser, Phys. Rev. Lett. 60, 2531 (Jun. 1988), http://link.aps.org/doi/10.1103/ PhysRevLett.60.2531 B. Bernu, C. Lhuillier, and L. Pierre, Phys. Rev. Lett. 69, 2590 (Oct. 1992), http://link.aps.org/doi/10.1103/ PhysRevLett.69.2590 L. Capriotti, A. E. Trumper, and S. Sorella, Phys. Rev. Lett. 82, 3899 (May 1999), http://link.aps.org/doi/ 10.1103/PhysRevLett.82.3899 For reviews see Introduction to Frustrated Magnetism: Materials, Experiments, Theory, edited by C. Lacroix, P. Mendels, and F. Mila, Springer Series in SolidState Sciences, Vol. 164 (Springer, Heidelberg, 2011) ISBN 978-3-642-10589-0, http://dx.doi.org/10.1007/ 978-3-642-10589-0_4 H. Kawamura and S. Miyashita, J. Phys. Soc. Jpn. 53, 4138 (Dec. 1984), http://jpsj.ipap.jp/link?JPSJ/53/ 4138/
N = 2. To compare the results in the RC and QC regions we define the dimensionless quantities 1 ρs 1 = t1 ¯ N02 h
�2
�
¯ h A0
∝
1 ξ (2π)5/2 2−1/2 t3 exp(2/t) 2
1 , T1
t = kB T /2πρs ,
(A.2)
so that 1 (RC) t1
= 18.074 t3 exp(2/t) ,
t ≪ 1,
(A.3)
and 1 (QC) t1
= Ztη = 0.07725 t1.5404 ,
t ≫ 1.
(A.4)
In Fig. 6 1/t1 t3 is plotted versus 1/t for each region all the way to 1/t = 1 [i.e., beyond the validity of Eqs. (A.3) and (A.4)]. It can be seen that at 1/t = 1 the extrapolated value of 1/t1 t3 is much larger for the RC regime than for the QC regime. Thus in an exact solution 1/t1 would be expected to drop below the asymptotic RC result [Eq. (A.3)] as the QC region is approached, although the caveat concerning the prefactor in Eq. (4.29) should be noted.
7
8
9
10
11
12
13
14
15
16
H. Kawamura and M. Kikuchi, Phys. Rev. B 47, 1134 (Jan. 1993), http://link.aps.org/doi/10.1103/ PhysRevB.47.1134 H. Kawamura and A. Yamamoto, J. Phys. Soc. Jpn. 76, 073704 (Jul. 2007), http://jpsj.ipap.jp/link?JPSJ/76/ 073704/ H. Kawamura, A. Yamamoto, and T. Okubo, J. Phys. Soc. Jpn. 79, 023701 (Jan. 2010), http://jpsj.ipap.jp/link? JPSJ/79/023701/ H. Kawamura, J. Phys. Conf. Ser. 320, 012002 (Sep. 2011), http://stacks.iop.org/1742-6596/320/i=1/a=012002 H. Tsunetsugu and M. Arikawa, J. Phys. Soc. Jpn. 75, 083701 (2006), http://jpsj.ipap.jp/link?JPSJ/75/ 083701/ For a review see K. Penc and A. M. L¨ auchli, Ref. 5, Chap. 13 H. Morita, S. Watanabe, and M. Imada, J. Phys. Soc. Jpn. 71, 2109 (Sep. 2002), http://jpsj.ipap.jp/link?JPSJ/ 71/2109/ R. Tamura and N. Kawashima, J. Phys. Soc. Jpn. 77, 103002 (Oct. 2008), http://jpsj.ipap.jp/link?JPSJ/ 77/103002/ E. M. Stoudenmire, S. Trebst, and L. Balents, Phys. Rev. B 79, 214436 (Jun. 2009), http://link.aps.org/doi/10. 1103/PhysRevB.79.214436 J. Takano and H. Tsunetsugu, J. Phys. Soc. Jpn. 80, 094707 (Aug. 2011), http://jpsj.ipap.jp/link?JPSJ/ 80/094707/
12
27
1/t1t 3
104 102
28
RC QC
100
29
-2
10
0
1
2
3
30
1/t FIG. 6. (Color online) dependence of 1/t1 t3 on 1/t, where 1/t1 is the reduced dynamic relaxation rate from Ref. 49 [Eqs. (A.3) and (A.4)] and t is the reduced temperature (see text for definitions). Solid line: renormalized-classical (RC) region. Dashed curve: quantum-critical (QC) region.
17
18
19
20
21
22
23
24
25
26
S. Nakatsuji, Y. Nambu, H. Tonomura, O. Sakai, S. Jonas, C. Broholm, H. Tsunetsugu, Y. Qiu, and Y. Maeno, Science 309, 1697 (Sep. 2005), http://www.sciencemag.org/ content/309/5741/1697.abstract For a review and references through 2009 see S. Nakatsuji, Y. Nambu, and S. Onoda, J. Phys. Soc. Jpn. 79, 011003 (Jan. 2010), http://jpsj.ipap.jp/link?JPSJ/ 79/011003/ S. Nakatsuji, H. Tonomura, K. Onuma, Y. Nambu, O. Sakai, Y. Maeno, R. T. Macaluso, and J. Y. Chan, Phys. Rev. Lett. 99, 157203 (Oct. 2007), http://link. aps.org/doi/10.1103/PhysRevLett.99.157203 H. Takeya, K. Ishida, K. Kitagawa, Y. Ihara, K. Onuma, Y. Maeno, Y. Nambu, S. Nakatsuji, D. E. MacLaughlin, A. Koda, and R. Kadono, Phys. Rev. B 77, 054429 (Feb. 2008), http://link.aps.org/doi/10.1103/ PhysRevB.77.054429 H. Yamaguchi, S. Kimura, M. Hagiwara, Y. Nambu, S. Nakatsuji, Y. Maeno, and K. Kindo, Phys. Rev. B 78, 180404(R) (Nov. 2008), http://link.aps.org/doi/ 10.1103/PhysRevB.78.180404 H. Yamaguchi, S. Kimura, M. Hagiwara, Y. Nambu, S. Nakatsuji, Y. Maeno, A. Matsuo, and K. Kindo, J. Phys. Soc. Jpn. 79, 054710 (May 2010), http://jpsj.ipap.jp/ link?JPSJ/79/054710/ A. Yaouanc, P. Dalmas de R´eotier, Y. Chapuis, C. Marin, G. Lapertot, A. Cervellino, and A. Amato, Phys. Rev. B 77, 092403 (Mar. 2008), http://link.aps.org/doi/10. 1103/PhysRevB.77.092403 Y. Nambu, S. Nakatsuji, Y. Maeno, E. K. Okudzeto, and J. Y. Chan, Phys. Rev. Lett. 101, 207204 (Nov. 2008), http://link.aps.org/doi/10.1103/PhysRevLett.101. 207204 D. E. MacLaughlin, Y. Nambu, S. Nakatsuji, R. H. Heffner, L. Shu, O. O. Bernal, and K. Ishida, Phys. Rev. B 78, 220403(R) (Dec. 2008), http://prb.aps.org/abstract/ PRB/v78/i22/e220403 D. E. MacLaughlin, Y. Nambu, S. Nakatsuji, K. Ishida, R. H. Heffner, L. Shu, and O. O. Bernal, J. Phys.: Conf. Ser. 145, 012040 (Jan. 2009), http://stacks.iop.org/
31
32
33
34
35
36
37
38
39
40
41
42
43
44 45
1742-6596/145/i=1/a=012040 P. Dalmas de R´eotier, A. Yaouanc, Y. Chapuis, C. Marin, G. Lapertot, A. Cervellino, and A. Amato, J. Phys. Conf. Ser. 145, 012045 (Jan. 2009), http://iopscience.iop. org/1742-6596/145/1/012045 D. E. MacLaughlin, Y. Nambu, Y. Ohta, Y. Machida, S. Nakatsuji, and O. O. Bernal, J. Phys.: Conf. Ser. 225, 012031 (2010), http://iopscience.iop.org/1742-6596/ 225/1/012031 Y. Nambu, Novel Magnetic State of the Two-Dimensional Triangular Antiferromagnet NiGa2 S4 , Ph.D. thesis, Kyoto University (Dec. 2008) B. R. Myoung, S. J. Kim, and C. S. Kim, J. Korean Phys. Soc. 53, 750 (Aug. 2008), http://www. kps.or.kr/jkps/abstract_view.asp?articleuid= 5516E301-8784-4210-8696-C3EA0AA56E32&globalmenu= 3&localmenu=10 C. Stock, S. Jonas, C. Broholm, S. Nakatsuji, Y. Nambu, K. Onuma, Y. Maeno, and J.-H. Chung, Phys. Rev. Lett. 105, 037402 (Jul. 2010), http://link.aps.org/doi/10. 1103/PhysRevLett.105.037402 K. Takubo, Y. Nambu, S. Nakatsuji, Y. Wakisaka, T. Sudayama, D. Fournier, G. Levy, A. Damascelli, M. Arita, H. Namatame, M. Taniguchi, and T. Mizokawa, Phys. Rev. Lett. 104, 226404 (Jun. 2010), http://link.aps. org/doi/10.1103/PhysRevLett.104.226404 B. R. Myoung, S. J. Kim, B. W. Lee, and C. S. Kim, J. Appl. Phys. 107, 09E106 (Apr. 2010), http://link.aip. org/link/?JAP/107/09E106/1 B. R. Myoung, C. M. Kim, S. J. Kim, T. Kouh, Y. Hirose, T. Hasegawa, and C. S. Kim, J. Appl. Phys. 109, 07E133 (Apr. 2011), http://link.aip.org/link/doi/10. 1063/1.3561169 A. L¨ auchli, F. Mila, and K. Penc, Phys. Rev. Lett. 97, 087205 (Aug. 2006), http://link.aps.org/doi/10.1103/ PhysRevLett.97.087205 S. Bhattacharjee, V. B. Shenoy, and T. Senthil, Phys. Rev. B 74, 092406 (Sep. 2006), http://link.aps.org/doi/10. 1103/PhysRevB.74.092406 H. Tsunetsugu and M. Arikawa, J. Phys.: Condens. Matter 19, 145248 (Mar. 2007), http://stacks.iop.org/ 0953-8984/19/i=14/a=145248 I. I. Mazin, Phys. Rev. B 76, 140406 (Oct. 2007), http: //link.aps.org/doi/10.1103/PhysRevB.76.140406 C.-H. Chern, Phys. Rev. B 78, 020403(R) (Jul. 2008), http://link.aps.org/doi/10.1103/PhysRevB.78. 020403 D. Podolsky and Y. B. Kim, Phys. Rev. B 79, 140402 (Apr. 2009), http://link.aps.org/doi/10.1103/ PhysRevB.79.140402 Z.-X. Liu, Y. Zhou, and T.-K. Ng, Phys. Rev. B 81, 224417 (Jun. 2010), http://link.aps.org/doi/10.1103/ PhysRevB.81.224417 K. Takubo, T. Mizokawa, J.-Y. Son, Y. Nambu, S. Nakatsuji, and Y. Maeno, Phys. Rev. Lett. 99, 037203 (Jul. 2007) A. Olariu, P. Mendels, F. Bert, B. G. Ueland, P. Schiffer, R. F. Berger, and R. J. Cava, Phys. Rev. Lett. 97, 167203 (Oct. 2006), http://link.aps.org/doi/10.1103/ PhysRevLett.97.167203 A. P. Ramirez, Annu. Rev. Mater. Sci 24, 453 (1994) P. Dalmas de R´eotier, A. Yaouanc, D. E. MacLaughlin, S. Zhao, T. Higo, S. Nakatsuji, Y. Nambu, C. Marin, G. Lapertot, A. Amato, and C. Baines, Phys. Rev. B 85, 140407 (Apr. 2012), http://link.aps.org/doi/10.1103/
13
46
47
48
49
50
51
52
53
54
55
56
57
58
59
60
61
62 63
PhysRevB.85.140407 In spin glasses, for example, χ(T ) exhibits a strong welldefined cusp and bifurcation at Tf even though CM (T ) is smooth there; see, e.g., J. A. Mydosh, Spin Glasses: An Experimental Introduction (Taylor & Francis, London, 1993) C. Varma, “Mysterious order for spins on a triangular lattice,” J. Club Condens. Matter Phys. (Nov. 2008), http://www.condmatjournalclub.org/wp-content/ uploads/2008/12/jccm_nov08_3v2.pdf A. V. Chubukov, T. Senthil, and S. Sachdev, Phys. Rev. Lett. 72, 2089 (Mar. 1994), http://link.aps.org/doi/ 10.1103/PhysRevLett.72.2089 A. V. Chubukov, S. Sachdev, and T. Senthil, Nucl. Phys. B 426, 601 (Sep. 1994), http://www.sciencedirect.com/ science/article/pii/055032139490023X A. V. Chubukov, S. Sachdev, and T. Senthil, J. Phys.: Condens. Matter 6, 8891 (Jul. 1994), http://stacks.iop. org/0953-8984/6/i=42/a=019 P. Azaria, B. Delamotte, and D. Mouhanna, Phys. Rev. Lett. 68, 1762 (Mar. 1992), http://link.aps.org/doi/ 10.1103/PhysRevLett.68.1762 P. Lecheminant, B. Bernu, C. Lhuillier, and L. Pierre, Phys. Rev. B 52, 9162 (Oct. 1995), http://link.aps.org/ doi/10.1103/PhysRevB.52.9162 L. Dogguy-Smiri, N.-H. Dung, and M. Pardo, Mater. Res. Bull. 15, 861 (Aug. 1980), ISSN 0025-5408, http://www.sciencedirect.com/science/article/pii/ 0025540880902081 Y. Nambu, R. T. Macaluso, T. Higo, K. Ishida, and S. Nakatsuji, Phys. Rev. B 79, 214108 (Jun. 2009), http: //link.aps.org/doi/10.1103/PhysRevB.79.214108 Y. Nambu and S. Nakatsuji, J. Phys.: Condens. Matter 23, 164202 (Apr. 2011), http://stacks.iop.org/0953-8984/ 23/i=16/a=164202 A. Schenck, Muon Spin Rotation Spectroscopy: Principles and Applications in Solid State Physics (A. Hilger, Bristol & Boston, 1985) A. Yaouanc and P. Dalmas de R´eotier, Muon Spin Rotation, Relaxation, and Resonance: Applications to Condensed Matter, International series of monographs on physics (Oxford University Press, New York, 2011) C. P. Slichter, Principles of Magnetic Resonance, 3rd ed., Springer Series in Solid-State Sciences (Springer-Verlag, New York, 1996) A component hBloc i of the muon local field is quasistatic if it fluctuates at a slow rate compared to the muon precession frequency in hBloc i. We include the static limit in our use of this term. R. Kubo and T. Toyabe, in Magnetic Resonance and Relaxation, edited by R. Blinc (North-Holland, Amsterdam, 1967) pp. 810–823R. S. Hayano, Y. J. Uemura, J. Imazato, N. Nishida, T. Yamazaki, and R. Kubo, Phys. Rev. B 20, 850 (Aug. 1979), http://link.aps.org/doi/10.1103/ PhysRevB.20.850 D. C. Johnston, Phys. Rev. B 74, 184430 (Nov. 2006), http://link.aps.org/doi/10.1103/PhysRevB.74. 184430 From Eq. (3) Pd (t) = 1/e for λd t = 1 independently of β. The muon lifetime normally limits measurable muon relax-
64
65
66
67
68 69
70
71
72
73 74
75
76
77
78
79
−2 −1 ation rates to > ∼ 10 µs . S. R. Dunsiger, R. F. Kiefl, K. H. Chow, B. D. Gaulin, M. J. P. Gingras, J. E. Greedan, A. Keren, K. Kojima, G. M. Luke, W. A. MacFarlane, N. P. Raju, J. E. Sonier, Y. J. Uemura, and W. D. Wu, Phys. Rev. B 54, 9019 (Oct. 1996), http://link.aps.org/doi/ 10.1103/PhysRevB.54.9019J. S. Gardner, M. J. P. Gingras, and J. E. Greedan, Rev. Mod. Phys. 82, 53 (Jan. 2010), http://rmp.aps.org/abstract/RMP/v82/i1/p53_ 1P. A. McClarty, J. N. Cosman, A. G. Del Maestro, and M. J. P. Gingras, J. Phys.: Condens. Matter 23, 164216 (2011), http://stacks.iop.org/0953-8984/23/i=16/a= 164216P. Carretta and A. Keren, in Ref. 5,Chap. 4, pp. 79– 105 A. Yaouanc, P. Dalmas de R´eotier, V. Glazkov, C. Marin, P. Bonville, J. A. Hodges, P. C. M. Gubbens, S. Sakarya, and C. Baines, Phys. Rev. Lett. 95, 047203 (Jul. 2005), http://prl.aps.org/abstract/PRL/v95/e047203/ A. Keren, P. Mendels, I. A. Campbell, and J. Lord, Phys. Rev. Lett. 77, 1386 (Aug. 1996) A similar analysis of 7 Li nuclear spin relaxation in the 2D THAFM Li7 RuO6 is given in Y. Itoh, C. Michioka, K. Yoshimura, K. Nakajima, and H. Sato, J. Phys. Soc. Jpn. 78, 023705 (Feb. 2009), http://jpsj.ipap.jp/link? JPSJ/78/023705/ A. V. Chubukov (private communication) See, for example, R. R. P. Singh and D. A. Huse, Phys. Rev. B 40, 7247 (Oct. 1989), http://link.aps.org/doi/ 10.1103/PhysRevB.40.7247 See, for example, R. J. Elliott, in Magnetism, Vol. IIA, edited by G. T. Rado and H. Suhl (Academic Press, New York & London, 1965) Chap. 7 B. I. Halperin and W. M. Saslow, Phys. Rev. B 16, 2154 (Sep. 1977), http://link.aps.org/doi/10.1103/ PhysRevB.16.2154 L. Seabra, T. Momoi, P. Sindzingre, and N. Shannon, Phys. Rev. B 84, 214418 (Dec. 2011), http://link.aps.org/ doi/10.1103/PhysRevB.84.214418 V. Jaccarino, Ref. 70, Chap. 5. See Ref. 57, Sec. 6.3, also A. Abragam, “The Principles of Nuclear Magnetism,” (Oxford University Press, Oxford, 1961) p. 34 ff The emergence of the NQR signal below ∼3 K (Ref. 20) is not necessarily a sign of a phase transition, but simply means the spin-echo decay time T2 has become long enough so that the NQR signal is visible after the spectrometer “dead” time. This is not surprising, since T2 ∝ 1/T at lower temperatures. K. Hirakawa and H. Kadowaki, Physica B+C 136, 335 (Jan. 1986), ISSN 0378-4363, http: //www.sciencedirect.com/science/article/pii/ S0378436386800869 P. Li, G.-M. Zhang, and S.-Q. Shen, Phys. Rev. B 75, 104420 (Mar. 2007), http://link.aps.org/doi/10.1103/ PhysRevB.75.104420 A “tensor magnet” ground state has been proposed for S = 2: A. V. Chubukov, K. I. Ivanova, P. C. Ivanov, and E. R. Korutcheva, J. Phys.: Condens. Matter 3, 2665 (Apr. 1991), http://stacks.iop.org/0953-8984/3/ i=16/a=006 H. Kawamura (private communication)