Oct 15, 1995 - Spin-resolved 3p and 3s core-level photoemission spectra of ferromagnetic nickel. Y. Saitoh, T. Matsushita, S. Imada, H. Daimon, and S. Suga.
PHYSICAL REVIEW B
Spin-resolved Department
VOLUME 52, NUMBER 16
3p and 3s core-level photoemission
15 OCTOBER 1995-II
spectra of ferromagnetic
nickel
Y. Saitoh, T. Matsushita, S. Imada, H. Daimon, and S. Suga of Material Physics, Faculty of Engineering Science, Osaka University, Osaka 560, Japan
J. Fujii Department
of Physics,
Gakushuin
University,
Tokyo
171, Japan
K. Shimada Department
of Physics, University of Tokyo,
Tokyo
II3, Japan
A. Kakizaki, K. Ono, M. Fujisawa, T. Kinoshita, and T. Ishii of Solid State Physics, University of Tokyo, Tokyo 106, Japan
Institute
(Received 7 July 1995) We have measured the spin-resolved 3p and 3s core-level photoemission spectra of ferromagnetic Ni in the whole region of the main peak and the satellites with reliable statistics. The observed spin-polarization spectrum for the 3p core excitation has revealed an overestimation of the 3p-3d interaction in a recent theoretical calculation. It is found that the 3s photoemission spectrum is strongly modified by the hybridization between the 3s3d and 3s3d states and the spin polarization results from the exchange interaction between the 3s and 3d electrons in the 3s3d component.
Core-level photoemission spectra provide us with information on the electronic structure of the ground state as well as the final state. The core-level spectra in such materials with 3d, 4f, or Sf outer shells often show multiplet and/or satellite structures, which indicate the large contribution of intra-atomic electrostatic interaction between the core hole and the valence electrons as well as interatomic hybridization. So far, many theoretical studies have revealed various mechanisms of the many-electron effects in the spectral features. However, a proper interpretation of the complicated spectral structure is not always straightforward. One obtains more information on electronic states by means of resonant photoemission spectroscopy by tuning the photon energy near the deeper core excitation threshold. ' In many cases, however, a distinction between a coherent resonant photoemission and an incoherent Auger decay is rather difficult. It has been considered that the analysis of the photoelectron spin is one of the direct ways to clarify the origin of the satellite structures. Recently, Thole and van der Laan achieved theoretical calculations for the spin- and x-ray polarization dependences of photoemission in a local model. They have shown that the magnetic dichroism in the spinresolved photoemission gives information not only on the core hole spin but also on the spin and orbital moments of the valence electrons. So far, the electron-spin dependence of the interaction between the core hole and the valence electrons has been disspin-resolved cussed photoemission spectroscopy by Ni is one of (SRPES) in a few ferromagnetic materials. the typical itinerant ferromagnets and its electronic structures have been studied by means of high-energy spectroscopies such as x-ray-absorption spectroscopy (XAS) and x-ray photoemission spectroscopy (XPS). ' The satellite structures observed in XAS and XPS of Ni are considered to originate from the strong electron correlation effect. Recent studies of 0163-1829/95/52(16)/11549(4)/$06. 00
52
magnetic circular dichroism in XAS of Ni suggest the noticeable contribution of the 3d character in the ground state. In this paper, we report remarkable spin polarizations in the Ni 3p and 3s spectra and discuss the electronic structure of Ni. SRPES measurement was carried out at the Revolver undulator beamline BL-19B of the Photon Factory, National This beamline is Laboratory for High Energy Physics. equipped with a varied space plane grating monochromater and a spin- and angle-resolved photoelectron spectrometer. The electron spectrometer consists of a Jost-type electron and a low-energy-electron-diffraction energy analyzer (LEED) spin detector. ' The instrumental energy resolution was set to about 1.2 eV full width at half maximum (FWHM). The pressure of the analyzer chamber during the measurement was better than 2.5X 10 Torr. The efficiency of the spin analysis (figure of merit) was increased to X 10 by measuring the intensity of both (2, 1) and (2,0) spots. A Ni(110) single crystal was shaped into a picture frame, with each frame being oriented along the easy magnetization axis of (111). A clean surface was prepared by Ne+ bombardment followed by annealing and its quality was checked by LEED and Auger-electron spectroscopy. The emitted from the surface were collected photoelectrons within an acceptance angle of ~4' from the surface normal n. The direction of the incident light was about 45 from n and the E vector was perpendicular to the (111) direction (p-polarized light). The magnetization M was perpendicular to both K and n. The magnetic linear dichroism in angular distribution of the 3p photoemission intensity for reversing M (Refs. 14 and 15) was measured with the excitation energy (hv) of 250 eV and found to be negligible in the present configuration. Figure 1(a) shows the spin-integrated Ni 3p photoemission spectrum measured for hv=175 eV. The spectrum
-2
R11 549
1995 The American Physical Society
Y. SAITOH et aI.
R11 550
'
10— Ni 3P
(a)
hv=175eV
A', ~ ~
0 experiment ------ calculation
6—
.
8
C
1
4
3p 3d
3p 3d
1
g
FP
3 53d10
3, F..'
D
~
1 I
'
3D3P
~
I
'
~
y
1
—----.-I ----------2 —----
~
~ I
t
8
e
~
g
I
I
I
I
I
(b) O
0 II
o
05
N
II o
o lhh&
l
o
oo
11
&&
I)
I
I
o
O
0
&
II
h
h
t
6
(c) 4
2—
(d) 0.1— 0 Q
P
0
q&;
0.0
-0. 1
I
—,
'Is
I
~~
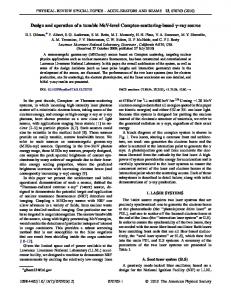
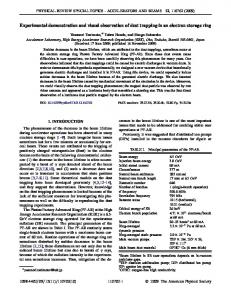
crepancy was already pointed out in resonant photoemission near the 2p core excitation threshold (2p RPES).' It was also pointed out that the calculation with one set of parameters could not consistently reproduce all the resonant behavior of the valence-band, 3p, and 3s photoemission. Figure 1(b) shows the spin polarization of the measured photoelectron spectrum. The spin polarization of the Ni 3p the obvious spin main peak has already been reported; dependence of the satellite peaks is reported here. The spin polarization shows dip structures for A and B, whereas it shows a positive peak near A'. Figure 1(c) shows the spininteresolved partial intensities t and II obtained from the and the spin polarization P according to the gral intensity relations It =I(1+P)/2 and I& =I(1 P)/2. — At each binding energy the intensities are proportional to the number of electrons with the spin parallel (I&) and antiparallel (I&) to the majority-spin direction. In order to compare our spectrum with the calculation, ' we have extracted the net 3p cornponent of It- and I& by subtracting smooth backgrounds from each spectrum. The difference spectrum It —I& thus estimated is shown in Fig. 1(d) in comparison with the calculated spectrum. The ordinate of Fig. 1(d) is the same as those of Figs. 1(a) and 1(c). If the calculated spectrum is normalized at the main peak A in the spin-integrated spectrum, the is about —,'. But this facreduction factor for the calculation tor is estimated to be —' if we compare the result with another calculation based on the impurity Anderson model. Part of this factor would be explained by the different value of the spectral half-widths between the experimental and the theoretical spectra. Even though we consider the experimental energy resolution, the experimental value is still too small. In the case of the magnetic circular dichroism in the Ni 3p photoemission intensity, the measured dichroism was about 2.5 times larger than the calculated one. The discrepancy was ascribed to the influence of the surface, where the orbital moment might be strongly enhanced in the ground state. Then the enlarged effective spin-orbit coupling would more strongly mix the spin-up and -down 3d states, making the difference between I& and I& much reduced on the surface. The considerable surface sensitivity was found at kinetic energies of several tens of eV. The spectral features of the spin polarization shown in Fig. 1(d) are qualitatively reproduced by the calculation, ' where the main peak and the P+ D satellite have the negative polarization and the 'P+ F satellite has the positive polarization. This is consistent with the interpretation that 8 and C correspond to the spin-triplet and the spin-singlet predominated final states, respectively. As for the spin polarization of the main peak A, an appreciable hybridization of some spin-triplet components of the 3p 3d state can exof this plain the remarkably negative spin polarization mainly 3p 3d final state. This is possible because the triplets are energetically closer to the 3p 3d state than the singlets. In Fig. 1(d), one recognizes again a noticeable difference of the energy between the experimental and the calculated spectra. If one reduces the energy spread of the calculation by 20%%uo, the calculated result agrees better with the experimental spectrum, as demonstrated in the inset in Fig. 1(d). It is known that the calculated spectrum is drastically modified, depending upon the magnitude of the parameters dominating
0 experiment ------ calculation I
I
90
80
8'
0 06'
',
orat,
',
0
A
70
60
binding energy (eV)
FIG. 1. SRPES spectra of Ni 3p core level measured for the excitation photon energy (hv) of 175 eV. (a) Spin-integrated photoelectron intensity (full circles) compared with an available calculation [dashed curve (Ref. 14)j, (b) spin polarization shown with the error bars, (c) spin-resolved partial intensities where the errors are within the triangles, and (d) difference spectrum between the spin-up and -down spectra (open circles) and calculated spinpolarization spectrum Idashed curve (Ref. 14)]. The typical error bar is indicated in the figure. The inset shows the comparison where the energy scale of the calculated spectrum is reduced by 20%. shows an asymmetric main peak (labeled A in the figure) accompanied with a shoulder structure A' on the larger side and the satellite structures B and C binding-energy separated from the main peak by 6 and 12 eV, respectively. The dashed line in the figure is a result of a theoretical calculation based on the impurity Anderson model. ' According to the calculation, the main peak has primarily 3p 3d character and the satellite structures have mainly 3p 3d character. Because of the large 3p-3d electrostatic inteiaction, the 3p 3d final state splits into three peaks A', B, and C, which are assigned as F+ D, P+ D, and P+ F states, respectively. The calculation qualitatively reproduces the experimentally observed satellite structures. However, the observed separation between the main and satellite peaks (8 and C) is much smaller than the calculated one. Such a dis-
52
SPIN-RESOLVED 3p AND 3s CORE-LEVEL PHOTOEMISSION 2.0 y
Ni 3s
(a)
hv=240eV
4sek ~ i«0i
Oy
~
experiment ------ calculation
1.5
9
~
~
0
3$3d lD3D re
3$3d e
e
$.0
~
3$3d
~~
~'0~OO
~ i»OI
~
~
e
«« e r»
«eeree
'
~
ee«r r ee re« e
4
(b)
c0
5
OOOO'
ii iHNi' iHi
hi)
i)i)i ii i
hi
I ii
i
o IHQi
0
~00 ~
o ~ 0 ~ 0 ~ 0 ~ 0 ~ 00 ~ 0 ~ 0 ~ 0 ~ 0 ~ 0 ~ OOHO ~ 0 ~ 0 ~ 0 ~ ~ 0 ~ 00 ~ 0 ~ 0 ~ 0 ~ \ ~ 0 ~ ~ 0 ~ OOHO ~ 0 ~ 00 ~ 0 ~ 0 ~ ~
I
~ ~ t ~ 000 ~ 0 ~ 0 ~
~
0 ~ OHO
~~
~0 ~ ~ ~0~0~ 0~ 0~
0~
1.0 +
(c) 09
v
0.8— ~
~077 ~akkaLL&r r~ jerk&++
iori
.&
V
U
CA
U~VVgg~U~UUU~~
U'Q%pi
gL
060.5 + I
(d) T+
o
0.5 I
T-
0.0
~0 ~ 0 ~ 0 ~ OQO
~0
~ 0 ~ 0 ~ OHOO\ ~ 00 ~ 00 ~ 0 ~ OOHO ~ 0 ~ 0 ~ ~ 0
~~
I
I
130
120
x5
0
~0~ 0
0.0
0 ~ 0 ~ 00 ~ 0 ~ ~
CQ
d I
I
110
100
binding energy (eV)
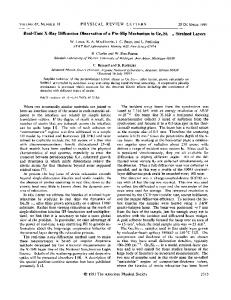
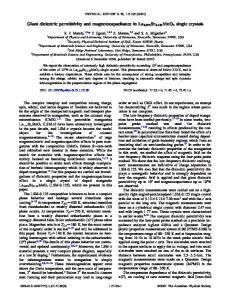
FIG. 2. Ni 3s spectra measured for h v= 240 eV with error bars as in Fig. 1. (a) Total intensity (full circles) compared with an available calculation [dashed curve (Ref. 17)]; (b) spin polarization; (c) spin-resolved partial intensities; and (d) spin-integrated photoemission (solid curve), spin-resolved partial intensities (dashed curves), and difference between the spin-up and -down spectra (open circles), all obtained after subtracting integral backgrounds. in the Anal state, such as the core hole potential acting on 3d electrons and the hybridization between the 3d and conduction-band states. ' In other words, the spin-resolved photoemission enables us to obtain much detailed information about the electrostatic interaction between the 3p hole and the valence electrons as well as the hybridization. Figure 2(a) shows the spin-integrated spectrum of the Ni 3s photoemission, where the experimental result (full circles) is compared with the calculated spectrum (dashed curve). The observed spectrum consists of a main peak at 110 eV and a satellite at about 6 eV higher binding energy.
R11 551
The observed spectral shape in the satellite region is considerably broader than the calculation. Figure 2(b) shows the observed spin polarization. The spin polarization decreases, relative to the value of the background around the main peak and shows a peak around the 6-eV satellite. Figure 2(c) shows the spin-resolved partial intensities. In order to examine the spectrum in more detail, we obtained the net 3s component of I& and I& in the same manner as in the case of 3p spectrum. They are presented in Fig. 2(d). One clearly sees that the main peak has a predominantly negative spin polarization and the 6-eV satellite has a positive spin polarization. If the main peak is resulting from a pure 3s3d state, no spin polarization is expected. Hence, the negative spin polarization of the main peak strongly suggests an appreciable of the spin-triplet component of the 3s3d hybridization state. The most probable explanation is that the 6-eV satellite is mainly resulting from the 3s3d state and has more D component than the D component, where the D component is energetically closer to the 3s3d state. Then the main peak has more D component than the D component due to the configuration interaction mixing. We therefore have an interpretation of the Ni 3s photoemission where the total spectral shape of the doublet structure is dominated by the hybridization between the 3s3d' and 3s3d states but its spin polarization is governed by the exchange splitting of the 3s3d states. The recent calculation based on the impurity Anderson model with full multiplets strongly supports this interpretation. In the 2p RPES in Ni, the enhancement of the 3s photoernission was observed only for the satellite. Hence it was interpreted that the doublet structure of Ni 3s photoemission is not due to the exchange interaction but due to the mixing between the 3s3d and 3s3d states, as is assigned in the calculated spectrum in Fig. 2(a). If the main peak has appreciable character of the 3s3d component, it may interfere with the Auger decay of the 2p core hole (represented as 2p 3d' ~3s3d +el) and will show resonant enhancement. The negligible resonance of the main peak in spite of the mixing of the 3s3d component, however, suggests the following possibilities. One possibility is that the hybridization of the 3s3d is still not predominant in the main peak and the resonance enhancement of the 3s photoemission in the 2p RPES is much weaker than in the case of the satellite. The second one is that the incoherent Auger peak which moves linearly with hv is still far away from the main 3s peak for the resonance excitation due to some possible energy deviation mechanism in the Auger decay process. The third possibility is the multiplet dependence of the Auger decay probability. For example, not all of the 3p 3d Analshow resonance enhancement in 2p state components RPES. Namely, the F+'D component resonates only a little. In this way, the D component of the 3s3d state hybridized in the main peak might not be much enhanced for 2p3]2 RPES. In summary, we have measured the complete spin polarization of the 3p and 3s core-level photoemission of ferromagnetic Ni. Clear spin polarization is found not only for the main peak but also for satellite structures. The spin polarization of the Ni 3p photoemission is qualitatively consistent with a recent theoretical calculation, but the 3p-3d interac-
R11 552
Y. SAITOH et al.
tion is overestimated in the calculation. The 3s photoemission has shown negative polarization for the main peak and positive spin polarization for the satellite, in contrast to the recent model on the 2p core resonant photoemission. We propose an interpretation that the hybridization between the 3s3d and 3s3d' provides the double photoemission peaks, whereas the spin polarization comes from the exchange split-
L. H. Tjeng, C. T. Chen, J. Ghijsen, P. Rudolf, and F. Sette, Phys. Rev. Lett. 67, 501 (1991). A. Tanaka and T. Jo, J. Phys. Soc. Jpn. 63, 2788 (1994). M. F. Lopetz, A. Hohr, C. Laubschat, M. Domke, and G. Kaindl, Europhys. Lett. 20, 357 (1992). G. van der Laan, J. Electron Spectrosc. Relat. Phenom. 68, 489 (1994), and references therein. F. U. Hillebrecht, R. Jungblut, and E. Kisker, Phys. Rev. Lett. 65, 2450 (1990). T. Kachel, C. Carbone, and W. Gudat, Phys. Rev. B 47, 15 391
(1993). L. E. Klebanoff, D. G. Van Campen, and R. J. Pouliot, Phys. Rev. B 49, 2047 (1994). S. Hiifner and G. K. Wertheim, Phys. Lett. 51A, 299 (1975). C. T. Chen, F. Sette, Y. Ma, and S. Modsti, Phys. Rev. B 42, 7262
(1991). toT. Jo and G. A. Sawatzky, Phys. Rev. B 43, 8771 (1991). A. Kakizaki, K. Soda, M. Fujisawa, S. Suga, T. Mori, Y. Watanabe, T. Ishii, M. Taniguchi, M. Ikezawa, S. Suzuki, H. Sugawara, Y. Kamiya, T. Miyahara, K. Tanaka, H. Kato, K. Ito, A. Yagishita, Y. Satow, T. Kosuge, S. Sato, S. Asaoka, and N. Kanaya, Rev. Sci. Instrum. 60, 1893 (1989). K. Jost, J. Phys. E 12, 1006 (1979).
52
ting of the 3s3d component in both the main and satellite photoemission peaks. The result of the 2p resonant photoemission is consistent with this interpretation.
The authors thank the collaboration of A. Harasawa, M. Watanabe, and T. Sendohda for skillful technical assistance on measurement. They acknowledge T. Jo and A. Tanaka for fruitful discussions.
J.
Kirschner, in Polarized Electrons at Surfaces, edited by G. Hohler, Springer Tracts in Modern Physics Vol. 106 (SpringerVerlag, Berlin, 1985). C. Roth, F. U. Hillebrecht, H. B. Rose, and E. Kisker, Phys. Rev.
Lett. 70, 3479 (1993). W. Kuch, M. -T. Lin, W. Steinhogl, C. M. Schneider, D. Venus, and J. Kirschner, Phys. Rev. B 51, 609 (1995). B. T. Thole and G. van der Laan, Phys. Rev. Lett. 67, 3306
(1991). G. van der Laan, B. T. Thole, H. Ogasawara, Y. Seino, and A. Kotani, Phys. Rev. B 46, 7221 (1992). G. van der Laan, M. Surman, H. A. Hoyland, C. F. Flipse, B. T. Thole, H. Ogasawara, Y. Seino, and A. Kotani, Phys. Rev. B 46, 9336 (1992). A. K. See and L. E. Klebanoff, Phys. Rev. Lett. 74, 1454 (1995). A. Tanaka and T. Jo, J. Phys. Soc. Jpn. (to be published). G. van der Laan, M. A. Hoyland, M. Surman, C. J. Flipse, and B. T. Thole, Phys. Rev. Lett. 69, 3827 (1992). A. Kakizaki, J. Fujii, K. Shimada, A. Kamata, K. Ono, K.-H. Park, T. Kinoshita, T. Ishii, and H. Fukutani, Phys. Rev. Lett. 72, 2781 (1994). S. Sugano, Y. Miwa, and T. Yamaguchi, Phys. Rev. Lett. 44, 1527
(1980).