Jul 9, 2009 - Phen. Model 1 (Burkert-Ioffe). Phen. Model 2 (Soffer-Teryaev 2004) ... ÏPT calculation without and with [14] the â and vector meson ...
Spin Sum Rules at Low Q2 Jian-ping Chen
arXiv:0907.1475v1 [nucl-ex] 9 Jul 2009
Thomas Jefferson National Accelerator Facility, Newport News, VA 23606, USA Abstract. Recent precision spin-structure data from Jefferson Lab have significantly advanced our knowledge of nucleon structure at low Q2 . Results on the neutron spin sum rules and polarizabilities in the low to intermediate Q2 region are presented. The Burkhardt-Cuttingham Sum Rule was verified within experimental uncertainties. When comparing with theoretical calculations, results on spin polarizability show surprising disagreements with Chiral Perturbation Theory predictions. Preliminary results on first moments at very low Q2 are also presented. Keywords: Spin, neutron, polarized 3 He, JLab, sum rule, polarizability PACS: 13.60.-r, 13.60.Hb, 13.88.+e
Introduction Sum rules involving the spin structure of the nucleon offer an important opportunity to study QCD. In recent years the Bjorken sum rule [1] at large Q2 and the Gerasimov, Drell and Hearn (GDH) sum rule [2] at Q2 = 0 have attracted large experimental and theoretical [3] efforts that have provided us with rich information. A generalized GDH sum rule [4] connects the GDH sum rule with the Bjorken sum rule and provides a clean way to test theories with experimental data over the entire Q2 range. Spin sum rules relate the moments of the spin-structure functions to the nucleon’s static properties or real or virtual Compton amplitudes, which can be calculated theoretically. Refs. [5, 6] provide comprehensive reviews on this subject.
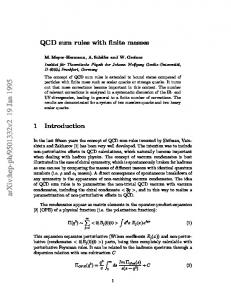
Results on moments of the neutron spin-structure functions Recently, the high polarized-luminosity available at Jefferson Lab has allowed a study of nucleon spin structure with an unprecedented precision. The neutron results on both g1 and g2 from Hall A were extracted from data on a 3 He target polarized in both longitudinal and transverse directions. Fig. 1 shows Γ1 [7, 8]R (left), the first moment of g1 , and the extended GDH integrals [8] (right) I(Q2 ) = ν∞th [σ1/2 (Q2 ) − σ3/2 (Q2 )]d ν /ν for the neutron. The left panel shows the preliminary results of Γn1 at very low Q2 [7] together with the results at low to intermediate Q2 region [8]. Also shown are the neutron results extracted from the deuteron and proton data from Hall B [9] and high Q2 data from HERMES [10] and SLAC [11]. At Q2 =0, the GDH sum rule predicts the slope of Γ1 (dotted lines). The behavior at low Q2 can be calculated with Chiral Perturbation Theory (χ PT). We show a Heavy Baryon χ PT (HBχ PT) calculation [12] (dashed lines) and a Relativistic Baryon χ PT (RBχ PT) calculation[14] including vector mesons and ∆ contributions (shaded
0.08 0.06 0.04 0.02
JLab E94010 JLab E97110 Preliminary HERMES JLab CLAS EG1a SLAC E143 GDH sum rule Phen. Model 1 (Burkert-Ioffe) Phen. Model 2 (Soffer-Teryaev 2004)
y
nar limi
50
Pre
0
−50
0
GDH Integral (µb)
Γ1n
band). The predictions are in reasonable agreements with the data at the lowest Q2 settings of 0.04 - 0.1 GeV2 . At moderate to large Q2 data are compared with two model calculations [15, 16]. Both models agree well with the data. The open symbols on the right plot are measured GDH integral from pion threshold to W = 2 GeV. The solid squares include an estimate of the unmeasured high-energy part. The results indicate a smooth variation of I(Q2) to increasingly negative values as Q2 varies from 0.9 GeV2 towards zero. The data (open squares) are more negative than the MAID model calculation[17]. The GDH sum rule prediction, I(0) = −232.8 µ b, is indicated in Fig. 1, along with extensions to Q2 > 0 using the next-to-leading order HBχ PT) calculation [12] (dashed line) and the RBχ PT) calcualtion [14] (shaded band) including resonance effects [14].
Χpt heavy baryons -0.02 -0.04
−100
−200
-0.06
−250
-0.08 Χpt Relativistic
−300
-0.1 10
-1
−350
1
2
2
Q (GeV )
JLab (Resonance) JLab (Resonance+DIS) Hermes GDH Sum Rule MAID Ji et al. Bernard et al.
−150
0
0.2
0.4
0.6
0.8 2 2 Q (GeV )
1
10
FIGURE 1. Results of Γ1 and GDH sum I(Q2 ) for the neutron [8]. The results are compared with χ PT calculations of ref. [12] (dashed line) and ref. [14] (shaded band). The MAID model calculation of ref. [17], is represented by a solid line. Data from HERMES [10] are also shown.
Combining the neutron results with the proton data from Hall B, results on the moment of g1p − gn1 , the generalized Bjorken sums [18], were obtained. The data at high Q2 values were used to test the Bjorken sum rule as one of the fundamental tests of QCD. They were also used to extract a value of strong coupling constant, αs . The new JLab data at low Q2 provide important information in the low energy region, where the strong interaction is non-perturbative. An attempt [19] was made to extract an effective strong ef f ef f coupling, αs in the low Q2 region. The extracted αs shows a trend of weakening Q2 -dependence with decreasing Q2 . Preliminary results of the first moment of gn2 , Γn2 , at very low Q2 are plotted on the left panel of Fig. 2 in the measured region (open squares). Solid suqares show the results after adding an elastic and an estimated low-x contributions. Also shown as open circles (measured) and solid circles (total) are the previously published results at low Q2 to intermediate Q2 . The MAID estimate agrees well with the measured resonance data. The two bands correspond to the experimental systematic errors and the estimate of the systematic error for the low-x extrapolation. The total results are consistent with the BC sum rule [20]. The SLAC E155x collaboration[11] previously reported a neutron result
0.0
E97110 (Resonances)
E94010 (elast+res+DIS)
E97110 (elast+res+DIS)
4
E94010 (resonances)
γ0 (10 fm )
Γ2
n
0.1
−4
0.08
SLAC E155x MAID 2003 (resonances) 0.06
ary
in relim
−5.0
P
0.04
E94010 MAID estimate 3 4 Kao et al. O(p )+O(p ) Bernard et al. Bernard et al. (VM + ∆)
3.0 4
δLT (10 fm )
0.02
2.0
−4
0
-0.02 10
-1
1
2
1.0
2
Q (GeV )
0.0
0
0.1
0.2 2
0.3
2
Q (GeV )
FIGURE 2. Results on the BC sum, Γn2 (Q2 ) (left) at very low Q2 [7] (preliminary) and at low to n (bottom-panel) at low intermediate Q2 [8]. Results on the spin polarizabilities γ0n (top-panel) and δLT 2 Q [8]. Solid curves are the MAID model [17] calculations. The dashed curves represent the heavy baryonχ PT calculation [13]. The dot-dashed curves and the shaded bands represent the relativistic baryon χ PT calculation without and with [14] the ∆ and vector meson contributions, respectively.
at high Q2 (star) with a rather large error bar. On the other hand, the SLAC proton result was reported to deviate from the BC sum rule by 3 standard deviations. The generalized spin polarizabilities provide benchmark tests of χ PT calculations at low Q2 . Since the generalized polarizabilities have an extra 1/ν 2 weighting compared to the first moments, these integrals have less contributions from the large-ν region and converge much faster, which minimizes the uncertainty due to the unmeasured region at large ν . At low Q2 , the generalized polarizabilities have been evaluated with next-to-leading order χ PT calculations [13, 14]. Measurements of the generalized spin polarizabilities are an important step in understanding the dynamics of QCD in the chiral perturbation region. The results for γ0 (Q2 ) [8] are shown in the top-right panel of Fig. 2. The data are compared with a next-to-leading order (O(p4 )) HBχ PT calculation [13], a next-to-leading order RBχ PT calculation and the same calculation explicitly including both the ∆ resonance and vector meson contributions [14]. Predictions from the MAID model [17] are also shown. At the lowest Q2 point, the RBχ PT calculation including the resonance contributions is in good agreement with the experimental result. For the HBχ PT calculation without explicit resonance contributions, discrepancies are large even at Q2 = 0.1 GeV2 . This might indicate the significance of the resonance contributions. The data are in reasonable agreement with the MAID predictions. Since δLT is insensitive to the ∆ resonance contribution, it was believed that δLT should be more suitable than γ0 to serve as a testing ground for the chiral dynamics of QCD [13, 14]. The bottom-right panel of Fig. 2 shows δLT [8] compared to χ PT calculations and the MAID predictions. While
the MAID predictions are in good agreement with the results, it is surprising to see that the data are in significant disagreement with the χ PT calculations even at the lowest Q2 , 0.1 GeV2 . This surprising disagreement (“δLT puzzle”) presents a significant challenge to the present Chiral Perturbation Theory. The spin polarizabilities data at very low Q2 [7] should be avalaible soon. These results will provide benchmark tests to the χ PT calculations at the kinematics where p they are expected to work. A new proposal [22] was recently approved to measure g2 with a transversely polarized proton target in the low Q2 region. It will provide an isospin separation of the spin polarizabilities to shed light on the “δLT ” puzzle.
Summary In summary, the high polarized-luminosity available at JLab has provided us with high-precision nucleon spin structure data in the low to intermediate Q2 region. These data help to study the non-perturbative region and the transition between perturbative and non-perturbative regions of QCD. The work presented was supported in part by the U. S. Department of Energy (DOE) contract DEAC05-84ER40150 Modification NO. M175, under which the Southeastern Universities Research Association operates the Thomas Jefferson National Accelerator Facility.
REFERENCES 1. J. D. Bjorken, Phys. Rev. 148, 1467 (1966); Phys. Rev. D1, 465 (1970). 2. S. B. Gerasimov, Sov. J. Nucl. Phys. 2, 598 (1965); S. D. Drell and A. C. Hearn, Phys. Rev. Lett. 162, 1520 (1966). 3. see, for example, S. E. Kuhn, J. -P. Chen and E. Leader, Prog. Part. Nucl. Phys. 63, 1 (2009). 4. X. Ji and J. Osborne, J. Phys. G 27, 127 (2001). 5. J. P. Chen, A. Deur and Z. E. Meziani, Mod. Phys. Lett. A 20, 2745 (2005). 6. D. Drechsel, B. Pasquini and M. Vanderhaeghen, Phys. Rep. 378, 99 (2003). 7. JLab E97-110, Spokespersons, J. P. Chen, A. Deur and F. Garibaldi. 8. M. Amarian, et al., Phys. Rev. Lett. 89, 242301 (2002); ibid., 92, 022301 (2004); ibid., 93, 152301 (2004). 9. R. Fatemi et al., Phys. Rev. Lett. 91, 222002 (2003); J. Yun et al., Phys. Rev. C 67, 055204 (2003). 10. A. Airapetian, et al., Eur. Phys. J. C 26, 527 (2003); Phys. Rev. D 75, 012007 (2007). 11. K. Abe et al., Phys. Rev. Lett. 78, 815 (1997). 12. X. Ji, C. Kao, and J. Osborne, Phys. Lett. B 472, 1 (2000). 13. C. W. Kao, T. Spitzenberg and M. Vanderhaeghen, Phys. Rev. D 67, 016001 (2003). 14. V. Bernard, T. Hemmert and Ulf-G. Meissner, Phys. Rev. D 67, 076008 (2003). 15. J. Soffer and O. V. Teryaev, Phys. Rev. D 70, 116004 (2004). 16. V. D. Burkert and B. L. Ioffe, Phys. Lett. B 296, 223 (1992). 17. D. Drechsel, S.S. Kamalov, and L. Tiator, Phys. Rev. D 63, 114010 (2001). 18. A. Deur, et al., Phys. Rev. Lett. 93, 212002 (2004). 19. A. Deur, et al., Phys. Lett. B 650,4 244 (2007); Phys. Lett. B 665, 349 (2008). 20. H. Burkhardt and W. N. Cottingham, Ann. Phys. 56, 453 (1970) 21. K. Abe, et al., E155 collaboration, Phys. Lett. B 493, 19 (2000). 22. JLab E08-027, Spokespersones, A. Camsonne, J. P. Chen and K. Slifer.