A. E. Bailey,1,* W. C. K. Poon,2 R. J. Christianson,1,â A. B. Schofield,2 U. Gasser,1,â¡ V. Prasad,1,x ..... [28] K. Jules et al., IAC-02-J.6/T.5.02, 53rd International.
PRL 99, 205701 (2007)
PHYSICAL REVIEW LETTERS
week ending 16 NOVEMBER 2007
Spinodal Decomposition in a Model Colloid-Polymer Mixture in Microgravity A. E. Bailey,1,* W. C. K. Poon,2 R. J. Christianson,1,† A. B. Schofield,2 U. Gasser,1,‡ V. Prasad,1,x S. Manley,1,k P. N. Segre,1,x L. Cipelletti,1,{ W. V. Meyer,3 M. P. Doherty,4 S. Sankaran,3 A. L. Jankovsky,4 W. L. Shiley,5 J. P. Bowen,5 J. C. Eggers,5 C. Kurta,5 T. Lorik, Jr.,5 P. N. Pusey,2 and D. A. Weitz1 1
2
Dept. of Physics & SEAS, Harvard University, Cambridge, Massachusetts 02138, USA School of Physics, The University of Edinburgh, Mayfield Road, Edinburgh EH9 3JZ, Scotland, United Kingdom 3 National Center for Microgravity Research, NASA Glenn Research Center, Cleveland, Ohio 44135, USA 4 NASA Glenn Research Center, Cleveland, Ohio 44135, USA 5 Zin Technologies, Inc., Brook Park, Ohio 44142, USA (Received 8 April 2007; revised manuscript received 19 August 2007; published 12 November 2007) We study phase separation in a deeply quenched colloid-polymer mixture in microgravity on the International Space Station using small-angle light scattering and direct imaging. We observe a clear crossover from early-stage spinodal decomposition to late-stage, interfacial-tension-driven coarsening. Data acquired over 5 orders of magnitude in time show more than 3 orders of magnitude increase in domain size, following nearly the same evolution as that in binary liquid mixtures. The late-stage growth approaches the expected linear growth rate quite slowly. DOI: 10.1103/PhysRevLett.99.205701
PACS numbers: 64.75.+g, 64.70.�p, 82.70.Dd
Mixtures of colloids and nonadsorbing polymer serve as a model system with which to study the phase behavior of weakly attractive colloidal particles [1]. In such colloidpolymer (C-P) mixtures, closely packed colloidal particles can exclude polymer from the region between them resulting in an unbalanced osmotic force pushing the particles together. The size and concentration of the polymer determine the range and strength, respectively, of this ‘‘depletion attraction’’ between the spheres. C-P mixtures exhibit a rich phase behavior which includes a region of coexistence between a colloid-poor ‘‘gas‘‘ and a colloid-rich ‘‘liquid‘‘ in analogy with molecular systems. Like molecular liquids, these systems exhibit spinodal decomposition; however, while this phase separation process has been extensively studied in molecular binary liquids near their critical consulate point, in C-P mixtures, the phase separation kinetics remains poorly understood. Spinodal decomposition occurs when a fluid is quenched into the center of its coexistence region and separates into gas and liquid phases [2]. Immediately after the quench, density fluctuations whose length scale is approximately the correlation length � become unstable and increase in amplitude through diffusion. During this early stage, the domain size ‘ increases as ‘�t� � t1=3 [3]. As the phases reach nearly equilibrium density, interfaces between the phases sharpen to a thickness of order �. Ultimately, minimization of interfacial area drives viscous flows resulting in a coarsening growth of ‘�t� � t [3]. This behavior has been observed in molecular fluids [4], binary fluid mixtures [5–7], and polymer blends [8]. However, theory [9] suggests spinodal decomposition in C-P mixtures may have somewhat different growth laws. Measuring the growth law exponents in C-P mixtures is exceedingly difficult on Earth because of gravity. Domains grow to the capillary length, ‘c � ��=��g�1=2 where � is 0031-9007=07=99(20)=205701(4)
the interfacial tension and �� is the density difference between phases. Domains larger than ‘c are torn apart by buoyancy forces [10]. Previous measurements of C-P mixtures on Earth spanned approximately one decade in time before being overtaken by gravitational effects [11]. By comparison, studies of polymer-micelle mixtures cover three decades in time [12]. Thus, full characterization of both the early and late stages of spinodal decomposition requires a reduced gravity environment. In this Letter, we report a study of spinodal decomposition in a C-P mixture in the microgravity of the International Space Station (ISS). The sample is deep inside the two phase region at close to the critical concentration. After mixing the sample, the phase separation following this ‘‘deep quench’’ was studied using both light scattering and imaging. In contrast to previous experiments [11], our results span nearly five decades in time, following the process until the domains reach nearly a centimeter in size. Remarkably, the phase separation dynamics of this deeply quenched C-P mixture closely mimic those of molecular liquid mixtures after very shallow quenches through the critical point. Only measurements performed on polymer blends [8] approach comparable time and length scales. NASA’s ‘‘Physics of Colloids in Space’’ instrumentation [13] permits both light scattering and direct observation. The cylindrical sample cells are 20 mm in diameter by 10 mm in height. A window in the bottom of the cell allows the sample to be imaged using two digital color cameras having different spatial resolutions: 4:4 �m and 44 �m. The small angle light scattering (SALS) from an 8 mm diameter, 533 nm laser beam is collected by a CCD camera imaging the focal plane of a 103 mm focal length lens comprising the top of the sample cell, collecting scattered light from scattering angles between 0.1� and 6.0�.
205701-1
© 2007 The American Physical Society
PRL 99, 205701 (2007)
PHYSICAL REVIEW LETTERS
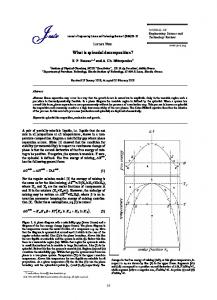
Additional optics allowed static light scattering to be collected from a 0:08 cm3 scattering volume over scattering angles from 11� to 169�. The sample could be homogenized in situ with oscillatory shear. The experiment launched on mission STS-100 aboard NASA Shuttle Endeavor and operated on the ISS for more than eight months, controlled remotely from the NASA Glenn Research Center. We use polymethylmethacrylate particles [14] with radius R � 159 nm determined with static light scattering. Polystyrene with Mw � 13:2 � 106 (Polymer Laboratory) was dissolved in a 60:40 by volume mixture of cis-decalin and tetralin, which nearly matches the refractive index of the particles. In this mixture, the polymer radius of gyration rg � 101 nm [15] so that rg =R � 0:63. The sample had a colloid volume fraction � � 0:22 and polymer concentration cp � 1:285 mg=ml. On Earth, complete phase separation required *2 hours resulting in 45%:55% by volume liquid and gas phases. On ISS, without Earth’s gravity driving the process, phase separation took more than 30 times longer. After mixing, the homogeneous sample formed an interconnected domain structure that coarsened, as illustrated in the five images in Fig. 1 [16]. The patterns are characteristic of domain growth during spinodal decomposition but are typically not observed so dramatically on such large length scales. The domains appear undisturbed by the cell walls up to �42 hr after mixing, whereupon the pattern distorts as the colloid-rich phase wets the wall completely coating it �60 hr after mixing [17,18]. Static light scattering, measured with the colloid-rich phase in the scattering volume, showed a liquid structure factor, which provides an estimate of the colloid volume fraction in each phase. The scattered intensity is fit to the colloid form factor multiplied by a liquid structure factor. Using an approximate analytic solution of the PercusYevick expression [19] for the structure factor to fit the data gives �liquid � 0:477 � 0:002. Conservation of mass 0:55�gas 0:45�liquid � 0:22 yields �gas � 0:010. This large concentration difference is characteristic of a deep quench. Interestingly, this large �liquid will result in a much larger viscosity in the colloid-rich phase estimated to be 30 mPa s; nevertheless, we do not see the morphology modified by the formation of drops [16] as predicted with such a large viscosity mismatch [20]. The early stages of spinodal decomposition were studied with SALS. Two seconds after mixing, no increase in fluctuation amplitude is observed as shown in Fig. 2 confirming homogenization of the sample. Six seconds after mixing, fluctuations at all accessible scattering vectors, q, have increased. Four seconds later, a peak is observed at qm , which shifts to lower q as time progresses, with no indication of a peak stationary in q but growing in intensity. Because the particle form factor varies only 1.8% over this q range, the scattered intensity is an accurate measure of the time-dependent structure factor S�q; t�.
week ending 16 NOVEMBER 2007
FIG. 1. Images of a colloid-polymer mixture undergoing spinodal decomposition in microgravity. The time after homogenization is shown in each image. The first five images show the entire 2 cm diameter sample cell. The bottom right image shows a higher resolution view of an interface between domains in the sample cell.
At later times, the domain size, ‘�t�, can be obtained from the real-space images. Because the depth of focus of the camera is short, we compute the 2-D correlation function, C�r~� � hI�r~�I�~r � r~0 �i=hI�r~�2 i, by multiplying an image by a copy of itself, shifted by an offset r~0 from an arbitrary origin. The nearest-neighbor peak in the azimuthally-averaged C�r~� was fit locally to a Gaussian to obtain ‘�t�. This was converted to an equivalent SALS peak position using qm � 2�=‘. Growth of the domain size exhibits a crossover from diffusion-limited dynamics to interfacial-tension-driven dynamics [3]. If phase separation is exclusively diffusive, qm � t�1=3 is expected [3]; the first few data points shown in Fig. 3 are consistent with this behavior. The peak position then evolves more rapidly with time. At later times, domains coarsen by interfacial-tension-driven viscous flow [3]. Different radii of curvature within the bicontinuous structure (Fig. 1) have different Laplace pressures. The resulting Poiseuille flow drives the coarsening, ‘�t� � ��=��t1 , where � is the viscosity of the coarsening phase [3]. The difference between the data and a t1 growth law reveals that this exponent is reached only asymptotically, at approximately 4 � 104 s after mixing as is highlighted by the time-dependence of qm t, shown in the inset
205701-2
PRL 99, 205701 (2007)
PHYSICAL REVIEW LETTERS
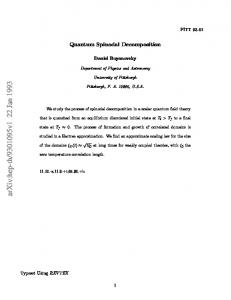
FIG. 2. Small-angle scattering data. The upper portion shows raw SALS data exhibiting growth of fluctuations and length scale. From bottom to top, the times after the mixing quench are 6, 13, 25, 40, 59, 78, and 101 seconds. The data shown in the lower pane were acquired later. Note scale change of q-axis. From bottom to top, the data were acquired 98, 128, 157, 188, 217, 248, and 278 seconds after the quench.
to Fig. 3. These data are reminiscent of the prediction that the growth exponent can vary between 0.2 –1.1 depending on the importance of hydrodynamic interactions [9]. However, this prediction covers the stage characterized by moderate density variations and diffuse interfaces. This regime occurs much earlier and has a short duration; the SALS data exhibit a I � q�4 consistent with scattering from sharp interfaces as early as 85 s after homogenization; moreover, the interface appears sharp to within the resolution of the high-magnification camera (Fig. 1, bottom right). Thus, the origin of the slow approach to t1 growth requires further investigation. The crossover from early to late-stage dynamics permits estimation of the correlation length, �. The crossover occurs at qm � � 0:1 [3]. Extrapolating forward in time from the early points with qm � t�1=3 and backward from the late points with qm � t�1:0 , the two intersect at qm � 3350 cm�1 , giving � � 300 nm; given the uncertainty of this estimation, we assume � � 2R. Thus, the particle size sets the minimum correlation length in a C-P system, unlike binary liquids or polymer blends where � is determined by molecular length scales; so even far from the critical point, � remains large for C-P mixtures. Using this value, the time evolution of the dimensionless domain size can be compared with several studies of phase separation which collapse to a single curve when the evolution is plotted using dimensionless quantities [5]. The wave vector is reduced by the correlation length as q�, and the time is reduced by the relaxation time of a fluctuation with wave vector 1=�, � kB Tt=�6���3 �. The value of the viscosity is estimated to be that of a solventpolymer mixture in the free volume of the homogenized
week ending 16 NOVEMBER 2007
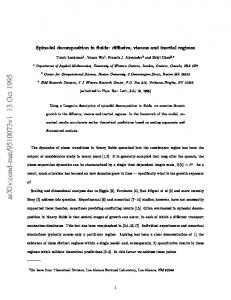
FIG. 3. The time-dependence of qm �t� on a double-log plot. Short-time data from SALS, and long-time data from direct imaging. The lines have slopes �1=3, �1=2, and �1 as indicated. The dash-dot line shows the domain growth in binary liquids plotted relative to the dimensionless axes. The upper x-axis is time in seconds while the lower x-axis is the scaled time described in the text. For this sample, they differ by only 12%. For comparison, the data of Verhaegh et al. is shown as crosses (A1) and circles (A2). The inset, qm t vs t, shows the slow approach to the final growth exponent, �1.
sample, 6 mPa s. This is a good estimate at early times before any significant phase separation; however, after appreciable phase separation. we expect a pronounced asymmetry in the viscosity of the phases due to the large increase in � in the colloid-rich region. The rescaled axes are shown in Fig. 3. The dot-dash curve shown in Fig. 3 is a fit [5] to data collected from an isodensity binary fluid to a theoretical form, which captures the physical scaling at both early and late stages and assumes a smooth crossover between them [21]. The evolution of the domain size in the C-P sample is remarkably similar to that of binary liquids and polymer blends [8]. However, the C-P system has a longer length scale at early time and a more gradual crossover to interfacial-tension-driven coarsening. Considering the depth of the quench performed during these experiments, the close agreement of the observed domain growth with previous experiments and theory is remarkable. As already shown, our quench depth reduced the correlation length to its minimum size, the colloid diameter. To compare with the results of Verhaegh et al. [11], we estimated the viscosity of their samples as 2.6 times the viscosity of the solvent. To place their data on Fig. 3, the correlation length was adjusted until their data lay on the curve. Only the samples in close proximity to the critical concentration, A1 and A2, were considered. We estimate the correlation length in sample A1 at 440 nm and in sample A2 at 470 nm. These correspond to 37 and 39 colloid diameters, respectively, which indicates these quenches were relatively shallow.
205701-3
PRL 99, 205701 (2007)
PHYSICAL REVIEW LETTERS
The key assertion leading to universal domain growth curve is that a single length scale governs the late-stage phase separation, when the phases have sharp interfaces and nearly their equilibrium concentration. This assertion also leads to dynamic scaling of the scattering data [21] observed in numerous experiments, including those examining depletion-induced phase separation [11,12]. However, dynamic scaling fails to collapse our SALS data. There are several possible explanations. Our scattering data are acquired in the early stage of phase separation when the domains have not reached their final equilibrium concentrations and interfaces have not formed. Experimentally, measurement of the transmitted laser beam failed preventing normalization of the data to eliminate the effect of rapidly varying turbidity. Given the close agreement of our data with the domain growth predicted by Furukawa and observed in other systems, a failure of dynamic scaling seems unlikely. The late-stage growth rate is consistent with the interfacial tension estimated by � � nkB T�=�2 where nkB T is the depth of the depletion potential between the colloidal particles [22]. We estimate [23,24] n � 2:65, yielding � ’ 2:4 � 10�8 N=m. The late-stage domain size varies as L � � �=��t, where is a dimensionless coupling constant between the order parameter and the fluid flow velocity [3,25]. Our data exhibit a growth rate of 4:1 � 10�8 m=s, which implies � 0:01 using � � 6 mPa s; would be higher if the larger viscosity of the colloid-rich phase were used. The measured value compares favorably with an estimate obtained from a linear stability analysis [26], � 0:04, and with that obtained from detailed simulations [27],
� 0:072, and is nearly identical to that found in binary liquids [5] and polymer blends [8]. The quench conditions of our C-P mixture are comparable to those of critical binary liquid mixtures. Small particles tend to a higher surface tension [10], whereas larger particles, such as those used here, yield a much lower surface tension, without the need to be in proximity to the critical point. The experimental importance of microgravity results not only from the large density difference between the phases but also from the ultralow interfacial tension. The maximum tolerable acceleration is found by requiring the capillary length to be larger than the largest domains observed, ‘c > 1 cm. This yields a maximum acceleration of 2:4 �g. The ISS has residual, low-frequency acceleration approximately 10 times lower [28] than this. Our results suggest that spinodal decomposition proceeds via wavelengths that start at the size of an individual colloid and become larger through coarsening. Surprisingly, this deep quench follows nearly the same time evolution as a shallow quench of a binary liquid. This has important implications for the characteristic length scale of colloidal gels, as it implies that any variations depend on the rates of coarsening rather than the initial size. These results further suggest that a C-P mixture near its critical point, where the correlation length exceeds the
week ending 16 NOVEMBER 2007
colloid size, would exhibit very low interfacial tensions, leading to phase separation on exceedingly long time scales, with very diffuse interfaces [29]. However, such experiments demand microgravity. This work was supported by NASA (No. NAG3-2284).
*Current Address: Scitech Instruments, Inc., North Vancouver, BC, Canada V7J 2S5 † Current Address: Olin College, Newton MA, USA ‡ Current Address: ETHZ & PSI, 5232 Villigen PSI, Switzerland x Current Address: Dept. of Physics, Emory University, Atlanta, GA 30322, USA k Current Address: NIH, Bethesda, MD, USA { Current Address: LCVN cc 26, Universite Monpellier II, P. E. Bataillon, Montpellier 34000, France [1] W. C. K. Poon, J. Phys. Condens. Matter 14, R859 (2002). [2] S. Puri, Phase Transit. 77, 407 (2004). [3] E. D. Siggia, Phys. Rev. A 20, 595 (1979). [4] Y. Garrabos et al., Europhys. Lett. 19, 491 (1992). [5] P. Guenoun et al., Phys. Rev. A 36, 4876 (1987). [6] J. S. Huang, W. I. Goldburg, and A. W. Bjerkaas, Phys. Rev. Lett. 32, 921 (1974). [7] N. C. Wong and C. M. Knobler, J. Chem. Phys. 85, 1972 (1981). [8] F. S. Bates and P. Wiltzius, J. Chem. Phys. 91, 3258 (1989). [9] J. K. G. Dhont, J. Chem. Phys. 105, 5112 (1996). [10] D. G. A. L. Aarts, R. P. A. Dullens, and H. N. W. Lekkerkerker, New J. Phys. 7, 40 (2005). [11] N. A. M. Verhaegh et al., Physica A (Amsterdam) 230, 409 (1996). [12] S. Bhat, R. Tuinier, and P. Schurtenberger, J. Phys. Condens. Matter 18, L339 (2006). [13] C. T. Lant et al., Appl. Opt. 36, 7501 (1997). [14] J. W. Antl et al., Colloids Surf. 17, 67 (1986). [15] V. Prasad, Ph.D. thesis, Harvard University, 2002. [16] See EPAPS Document No. E-PRLTAO-99-013745 for a video of the phase separation. For more information on EPAPS, see http://www.aip.org/pubservs/epaps.html. [17] W. K. Wijting, N. A. M. Besseling, and M. A. C. Stuart, Phys. Rev. Lett. 90, 196101 (2003). [18] D. G. A. L. Aarts and H. N. W. Lekkerkerker, J. Phys. Condens. Matter 16, S4231 (2004). [19] L. Verlet and J.-J. Weis, Phys. Rev. A 5, 939 (1972). [20] H. M. Tanaka, Prog. Theor. Phys. 101, 863 (1999). [21] H. Furukawa, Adv. Phys. 34, 703 (1985). [22] J. S. Rowlinson and B. Widom, Molecular Theory of Capillarity (Clarendon Press, Oxford, 1982). [23] S. Asakura and F. Oosawa, J. Polym. Sci. 33, 183 (1958). [24] A. Vrij, Pure Appl. Chem. 48, 471 (1976). [25] T. Lookman et al., Phys. Rev. E 53, 5513 (1996). [26] M. San Miguel, M. Grant, and J. D. Gunton, Phys. Rev. A 31, 1001 (1985). [27] V. M. Kendon et al., Phys. Rev. Lett. 83, 576 (1999). [28] K. Jules et al., IAC-02-J.6/T.5.02, 53rd International Astronautical Congress, 2002. [29] D. G. A. L. Aarts, M. Schmidt, and H. N. W. Lekkerkerker, Science 304, 847 (2004).
205701-4